

Abstract
Background. Transcutaneous electrical nerve stimulation (TENS) is generally applied for tactile feedback in the field of prosthetics. The distinct mechanisms of evoked tactile perception between stimulus patterns in conventional TENS (cTENS) and neuromorphic TENS (nTENS) are relatively unknown. This is the first study to investigate the neurobiological effect of nTENS for cortical functional mechanism in evoked tactile perception. Methods. Twenty-one healthy participants were recruited in this study. Electroencephalogram (EEG) was recorded while the participants underwent a tactile discrimination task. One cTENS pattern (square pattern) and two nTENS patterns (electromyography and single motor unit patterns) were applied to evoke tactile perception in four fingers, including the right and left index and little fingers. EEG was preprocessed and somatosensory-evoked potentials (SEPs) were determined. Then, source-level functional networks based on graph theory were evaluated, including clustering coefficient, path length, global efficiency, and local efficiency in six frequency bands. Main results. Behavioral results suggested that the single motor units (SMUs) pattern of nTENS was the most natural tactile perception. SEPs results revealed that SMU pattern exhibited significant shorter latency in P1 and N1 components than the other patterns, while nTENS patterns have significantly longer latency in P3 component than cTENS pattern. Cortical functional networks showed that the SMU pattern had the lowest short path and highest efficiency in beta and gamma bands. Conclusion. This study highlighted that distinct TENS patterns could affect brain activities. The new characteristics in tactile manifestation of nTENS would provide insights for the application of tactile perception restoration.
Export citation and abstract BibTeX RIS
1. Introduction
As one of the most basic and critical senses in human body movement, tactile perception plays an important role in contacting with objects and getting familiar with the surrounding environment. Losing tactile perception could cause much inconvenience especially for the upper limb amputees. With the development of intelligent prosthetic hand, a closed-loop prosthetic control system with tactile feedback system has been promisingly applied for tactile perception restoration, which is essential in the recognition of object features in grasping.
TENS (Johnson 2012) has been generally used to elicit artificial tactile perception in the tactile feedback system (Antfolk et al 2013, Tan et al 2014, Valle et al 2018). As a portable and non-invasive method, TENS of the median and ulnar nerves by surface electrodes was reported to produce hand sensations in able-bodied subjects (Forst et al 2015), and referred sensations of phantom fingers or palms in amputated subjects (D'Anna et al 2019) for a short period. Mounting evidence indicates that TENS could activate the primary somatosensory cortex of upper limb amputees and healthy subjects (D'Anna et al 2017, Liu et al 2017, Osborn et al 2018, Ding et al 2020, Hao et al 2020, Tayeb et al 2020, Vargas et al 2020, Su et al 2020a, 2020b). TENS could stimulate distinct tactile perceptions by customizing the frequency, current amplitude and pulse width of the waveform pattern (Chai et al 2015, D'Anna et al 2017). The modulated square waveform pattern is mostly applied in cTENS, which has been suggested to stimulate finger tactile perceptions in upper limb amputees and healthy subjects (Chai et al 2015, Li et al 2018). However, the square pattern mainly provide the sensations of pressure and vibration, and the customizing parameters of stimuli waveform remain heterogeneous (Li et al 2018). Previous studies suggested that the sensation elicited by the square pattern varies in different subjects, and there is not a generally suitable parameter setting for all the subjects. Hence, Osborn and colleagues (Osborn et al 2018) revealed the possibility of creating a more natural tactile perception by using neuromorphic waveform. In their study, the neuromorphic waveform is transformed from a pressure signal into a biologically relevant signal instead of the conventional square waveform pattern, suggesting that frequency and pulse width are key factors in providing tactile perceptions; more importantly, higher frequency stimulation trends towards more pleasant tactile sensation. This allows the exploration of building nTENS patterns to elicit tactile perception. Nevertheless, most previous studies were limited by the sample size of enrolled participants for both upper limb amputees and healthy subjects (Osborn et al 2018, Su et al 2020a, 2020b). Therefore, developing another waveform pattern with a higher frequency and reduced mechanical sensation for TENS with a larger sample size is essential to explore and enhance the restoration of tactile perception.
EEG has been widely used in brain mechanistic studies because of its advantages of non-invasiveness, portability and safety. EEG and related methods are known as technics in brain functional investigation with relatively high time resolution, which would be suitable in revealing brain mechanisms of tactile perceptual restoration by TENS. There were previous researches investigating EEG features of tactile perception elicited by cTENS during the tactile discrimination task (D'Anna et al 2017, Ding et al 2020, Su et al 2020a, 2020b). Evidences revealed that the event-related desynchronization (ERD) of the alpha band in the prefrontal region is related to tactile cognitive processing in healthy subjects (Zhang et al 2016) and upper limb amputees (Su et al 2020a). As a typical EEG feature, the components of event-related potentials (ERPs) could reflect the physical characteristics of the external stimulation and psychological reaction to stimulus. ERPs studies revealed that electrical stimulation-related ERPs components could reflect the characteristics of electric stimuli (Zhang et al 2016). Additionally, distinct SEPs could reflect contralateral stimulation sites and characterize distinct stimulation modulations by cTENS (D'Anna et al 2017, Strauss et al 2019). Moreover, the increased amplitudes of steady-state SEP (SSSEP) are considered to be associated with the stimulation intensity of cTENS (Su et al 2020b). However, little is known about the neurobiological mechanisms of evoked tactile perception for nTENS patterns.
In addition, the information processing of the brain is regarded as a spatially separated but functionally connected procedure. Conventional EEG features based on local region of interest could barely reflect the characteristics of integration and separation of the whole brain. Therefore, an increasing number of studies focus on using graph theory to investigate functional activities of brain networks (Stam and Reijneveld 2007, Bullmore and Sporns 2009, Rubinov and Sporns 2010, Hasanzadeh et al 2020, Hatlestad-Hall et al 2021). Particularly, the small-world network has been considered the most suitable model to elucidate information transfer in the human brain (Bolanos et al 2013). Meanwhile, its representable metrics, including the clustering coefficient, path length and efficiency, could reveal the local and global changes in brain information processing.
The conventional EEG brain network is constructed at the electrode-level which has spatial limitation due to volume conduction (Nolte et al 2004) and poor signal-to-noise ratios (Lemm et al 2006) when depending on the position of scalp electrodes. The improved method of source-level brain functional network can help investigate the connectivity between cortical and subcortical regions of the brain. Previous studies have evaluated the source-level functional networks of EEG for exploring the pathophysiological mechanism in patients with psychiatric disorders (Kim et al 2020a, 2020b, Zhang et al 2021). To the best of our knowledge, this is the first study investigating the altered cortical functional networks between the cTENS and nTENS patterns.
In this study, we creatively applied the electromyography (EMG) and SMU signal as nTENS patterns to elicit tactile perception and to investigate brain mechanisms of cTENS and nTENS in healthy subjects. The cTENS and nTENS characteristics and behavioral data of subjects have been evaluated. In addition, the features of ERPs in somatosensory regions have been assessed to investigate distinct time-frequency characteristics in right and left fingers. Furthermore, we generated cortical functional networks in various frequency bands to investigate tactile perception changes into the underlying cortical source space. We hypothesized that manifestations affected by cTENS and nTENS during the experimental task would be different, and the time-frequency characteristics of EEG would differ between cTENS and nTENS patterns in distinct fingers. Evaluating source-level network metrics in cTENS and nTENS patterns would exhibit an altered cortical functional network at both the global and nodal levels during the experimental task.
2. Methods
2.1. Participants
Twenty-one healthy subjects (9 male and 12 female, mean age ± SD = 25.52 ± 2.502, mean educational years ± SD = 18.62 ± 2.356) were enrolled in this study. All of them was right-handed and had normal or corrected-to-normal vision. None of them had a history of nervous system or mental disease. The study followed the standards of the Declaration of Helsinki. Every participant was informed about the process before the study, and provided signed informed consent. The study was approved by the ethics committee of the Beijing institute of basic medical sciences.
2.2. Experimental procedure
The electrical stimulation test was conducted in each participant before the formal study. Testing amplitude could range from 100 to 16 000 µA with every 100 µA as a step in the square pattern. The square pattern was used for testing and its intensity was set for each participant when he/she feels 'light touch on fingertip which could barely be ignored'. The parameters of EMG and SMU patterns were set according to the intensity of square pattern. Each of the patients was stimulated by three waveform patterns relatively to identify similar intensities for tactile perceptual restoration (table 1).
Table 1. TENS characteristics.
| Healthy participants (n = 21) | ||
|---|---|---|
| Mean (SD) | P value | |
| Electric charge (mC) | ||
| Square | 0.219 (0.031) | <0.001 |
| EMG | 0.104 (0.018) | |
| SMU | 0.062 (0.012) |
Note: Square = square waveform pattern; EMG = electromyography pattern; SMU = single motor units pattern.
In the formal study, all participants were asked to undertake a tactile discrimination task (figure 1). During this task, each participant sat in a comfortable chair, facing a screen in front of them. In each trial, the task procedure was shown on the screen to instruct the participants. At the beginning, a fixation point was presented on the center of the screen for 2 s, and then 'Stimulation' was started with another fixation period. Afterwards, the participants were asked to rate 'How real the tactile perception was'. This is a 5-point rating scale to evaluate the realness of the tactile perception by electric stimulation, in which '1' indicated 'barely like a tactile perception', '2' indicated 'a little like a tactile perception', '3' meant 'like a tactile perception', '4' meant 'much more like a tactile perception', and '5' represented 'very much like a tactile perception'. Finally, a 3 s-black screen was shown for resting.
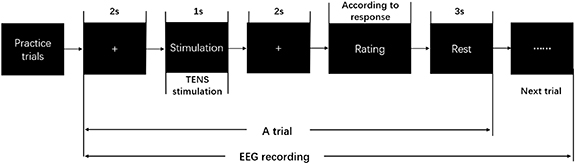
Figure 1. Experimental paradigm of the tactile discrimination task.
Download figure:
Standard image High-resolution imageAccording to the stimulation locations, there were four sessions in this study, including the right index finger (RI), the right little finger (RL), the left index finger (LI) and the left little finger (LL) (figure 2). Each session had three electrical stimuli, which comprised three stimulus patterns including the square, the EMG and the SMU (figure 3). Each session had 96 trials (6 trials as a practice block and 90 trials for the formal experiment block) in total and lasted about 15 min. Each stimulation type contained 30 trials, which were presented randomly and had an equal probability of appearing.

Figure 2. Four stimulated sties in the tactile discrimination task.
Download figure:
Standard image High-resolution image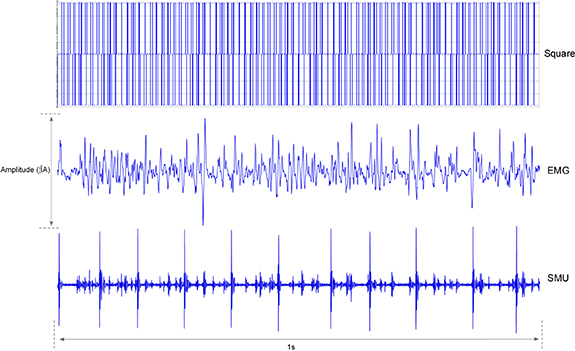
Figure 3. Three stimuli types of tactile discrimination task. Square = square waveform pattern; EMG = electromyography pattern; SMU = single motor units pattern.
Download figure:
Standard image High-resolution image2.3. Experimental setup and data acquisition
The experimental setup included the EEG recording and electrical stimulation systems. EEG was recorded with an NT9200 (Symtop, China) and a quick-cap with 64 Ag/AgCl electrodes. The ground and reference electrodes were placed on the forehead and vertex, respectively. All the electrodes were placed according to the 10–20 system. During the study, each subject was asked to wear the EEG cap with two electrodes placed on the left and right mastoid bones and four electrodes placed on the left and right eyes to obtain vertical and horizontal electrooculograms. There were 56 EEG channels, and the sample rate of the original signal was 2000 Hz. The impedance was kept below 5 kΩ.
The multi-channel electrical stimulation system used a STG4008 (Reutlingen, Germany). Three types of the stimulus pattern, including the square, EMG and SMU types, were designed by using the MC_Stimulus II software. The square waveform contained biphasic, rectangular current pulses. The biphasic single pulse was composed of one negative pulse and one positive, with a pulse width of 1000 µs each. An inter-pulse delay of 10 µs was present between the two pulses. The EMG and SMU signals were downloaded from the EMGLAB database with R10 label (www.emglab.net/) (Pascoe et al 2006). All waveforms were 1 s long and downloaded to three different channels of the stimulator to elicit different tactile perceptions. Two electrode pads were placed and banded with a 3 M tape (skin-friendly, paper adhesive tape, 3 cm, 3 M Co, St. Paul, USA) on a targeted finger pulp in each session. Each electrode pad was 42 mm × 25 mm with an electrode core of 9 mm in diameter, which covered with conductive hydrogel, and connected to the anode/cathode of the stimulator.
To complete synchronization between EEG recording and electrical stimulation, the E-prime (version 1.0) was applied to send multi-stimulation triggers to the EEG recording and electrical stimulation systems, as well as the experimental paradigm presentation. Signal communication between devices were delivered by Transistor-Transistor Logic (TTL) triggers via universal serial bus (USB).
2.4. Data analysis
2.4.1. Behavioral data and TENS/nTENS characteristics
The rating scores of the tactile discrimination task in each subject were recorded by E-prime and extracted from the E-DataAid toolbox. Graczyk and colleagues (Graczyk et al 2016) found that the perceived tactile intensity depended on the total stimulation charge applied per second. Therefore, the intensities of TENS and nTENS were characterized by the total electric charge per epoch as follows:
2.4.2. EEG pre-processing and ERPs analysis
The recorded EEG signals were preprocessed by the EEGLAB toolbox (version 2021.0) (Delorme and Makeig 2004) based on MATLAB (version R2019a). Original EEG data were imported to the toolbox, and the triggers recorded by E-prime were made into an event file, which was also imported. The channel locations were rechecked, and bad channels were deleted. EEG data were re-referenced to bilateral mastoid, and movement artifacts were removed visually. Next, the data were down-sampled to 1000 Hz, and the band pass filtered from 0.1 to 100 Hz. Eye-related and other artifacts were evaluated after independent component analysis (ICA), removing the components based on the AJUST toolbox (version 1.1.1). After dividing EEG data into 1.2 s (baseline −200 ms) epochs, three types with a total of 90 artifact-free epochs for each session were prepared for each subject.
All epochs of 21 subjects were created as a two-way (three types × four sessions) analysis of variance (ANOVA) study design in EEGLAB. Averaged ERPs for the FC3, FC4, C5, C3, C1, C2, C4, C6, CP3, and CP4 channels were extracted and assessed by MATLAB commands (Su et al 2020b). ERPs topography and images were presented by EEGLAB. Averaged ERPs around the left somatosensory regions (FC3, C5, C3, C1 and CP3) and the right somatosensory regions (FC4, C6, C4, C2 and CP4) were assessed by EEGLAB. Averaged P1, N1 and P3 components in the left and right somatosensory regions of each subject were extracted and assessed by MATLAB.
2.4.3. Source localization
The Brainstorm toolbox (http://neuroimage.usc.edu/brainstorm) was used to examine source-level brain activities. The standardized low resolution brain electromagnetic tomography (sLORETA) was applied to estimate the time series of source activities. A three-layer boundary element model from the MNI/Colin 27 anatomy template was used to compute the lead-field matrix. The cortical current density value at 15 002 cortical vertices were calculated at all time points for each epoch. Noise covariance was calculated for each subject to estimate the weight of each sensor in the source reconstruction. To approximate the source locations and time series in a reasonable way, the cortical vertices were down-sampled to 148 nodes based on the Destrieux atlas, which contains 74 cortical regions in each hemisphere (Destrieux et al 2010). The source-level time series in 148 nodes of each epoch were filtered into six frequency bands, including delta (2–4 Hz), theta (5–7 Hz), alpha (8–12 Hz), beta (15–29 Hz), low gamma (30–59 Hz) and high gamma (60–90 Hz).
2.4.4. Connectivity and network analysis
Functional connectivity among the 148 nodes was computed by phase-locking values (PLV) (Lachaux et al 1999). PLV estimates normalized synchronization values of two signals between paired nodes ranging from 0 to 1, and has been generally used in frequency-characterized network analysis. In this study, we chose 1 s epoch (without baseline) to analyze functional connectivity. The source-level networks were visualized with the BrainNet Viewer toolbox (Xia et al 2013, www.nitrc.org/projects/bnv/).
Graph theory was used to analyze weighted connectivity networks using the GRETNA toolbox (Wang et al 2015). We chose four network indexes to represent the global and local features of the functional networks. First, the clustering coefficient indicates the degree to which a node clusters with its neighboring nodes. Second, the path length indicates the sum of lengths between two nodes within a network. Clustering coefficient and path length together constitute the small-world metric, which evaluates both specialized and integrated information processing as well as the efficiency of information transfer. Third, global efficiency measures the efficiency of parallel information transfer in a network. Finally, local efficiency represents how efficient is the communication among the first neighbors of a given node when it is removed. In this study, we calculated the areas under the curves (AUCs) for four network metrics, including the clustering coefficient (aCP), path length (aLP), global efficiency (aEG) and local efficiency (aEL), which avoid the specific threshold selection in a network.
2.5. Statistical analysis
Statistical analysis was performed with the SPSS software (version 27.0, IBM Corp., Armonk, NY, USA). The chi-square test was used for intergroup comparison of categorical variables. All the data was examined normally distribution after Kolgomorov-Smirnov test. As a result, normally distributed data was conducted parametric statistical analysis. Contrarily, nonnormal distributed data and discontinuous variable were compared by nonparametric statistical analysis, including electrical charge data and behavioral data.
Three-way repeated-measures analysis of variance (ANOVA) for three within-subject factors, including stimulus conditions (square, EMG, and SMU), stimulated sites (RI, RL, LI, and LL) and somatosensory regions (left and right), was performed to determine the group effects of amplitude and latency of ERPs components, respectively. In case of significant three-way interaction, a post hoc two-way ANOVA was performed for distinct stimuli patterns, respectively. In case of significant two-way interaction between stimulated sites with somatosensory regions, post hoc one-way ANOVA was performed to compare changes of each SEPs component in each stimulated site among the three stimuli patterns. At each frequency, two-way repeated-measures ANOVA (stimulus conditions: Square, EMG, and SMU; stimulated sites: RI, RL, LI, and LL) was performed for the network metrics. For all tests the significant level was set at p < 0.05, and post-hoc tests were Bonferroni-corrected for multiple comparison.
3. Results
3.1. TENS and behavioral characteristics
Regarding TENS characteristics, there were significant differences among the three waveform patterns after nonparametric statistical analysis. nTENS patterns had statistically lower intensity than square ones; moreover, the SMU pattern had the lowest intensity among all patterns (table 1).
Tactile perception rating score assessment after nonparametric statistical analysis showed that there was no significant difference among the three stimulus patterns when stimulated on RI. There was a significant difference between the SMU and EMG patterns in the RL. The rating score was significantly higher for the SMU pattern compared with the EMG pattern. As for the LI and LL, there were significant differences among the three waveform patterns, which suggested that the rating score in the SMU pattern was significantly higher than those of the square and EMG patterns. There was no statistically significant difference between the square and EMG patterns for all for stimulated sites (figure 4). As a result, evidences indicate that the SMU pattern was considered the most natural and pleasant perception (except for the RI side) with less electrical intensity for participants in imitating tactile sensory during the tactile discrimination task.
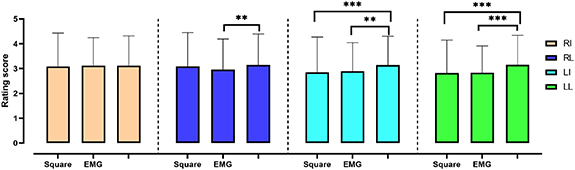
Figure 4. Tactile perception rating scores in the three groups. RI = right index finger, RL = right little finger, LI = left index finger, LL = left little finger, Square = square waveform pattern; EMG = electromyography pattern; SMU = single motor units pattern *p < 0.05; **p < 0.01; ***p < 0.001.
Download figure:
Standard image High-resolution image3.2. ERPs results
Averaged ERPs and topography around the left (FC3, C5, C3, C1 and CP3) and right (FC4, C6, C4, C2 and CP4) somatosensory regions are shown in figure 5. As for ERPs results, there were normally P1, N1, P2, N2 and P3 components in the range of 0–700 ms after the stimulation. The early SEPs components (before 200 ms) were considered to be associated with brain function in tactile perception. P3 is a representative component in ERPs analysis related to cognitive information processing. Therefore, the averaged amplitude and latency of P1, N1 and P3 components were evaluated. Three-way ANOVA showed that there were no significant interactions in each amplitude among the three factors. Meanwhile, latency in the three components showed significant interactions. Moreover, post hoc two-way analysis showed that there was strong evidence of interaction in each SEPs component latency by the square and EMG patterns. For the EMG pattern, significant interactions were found in the latency of the P1 and N1 components (table 2).
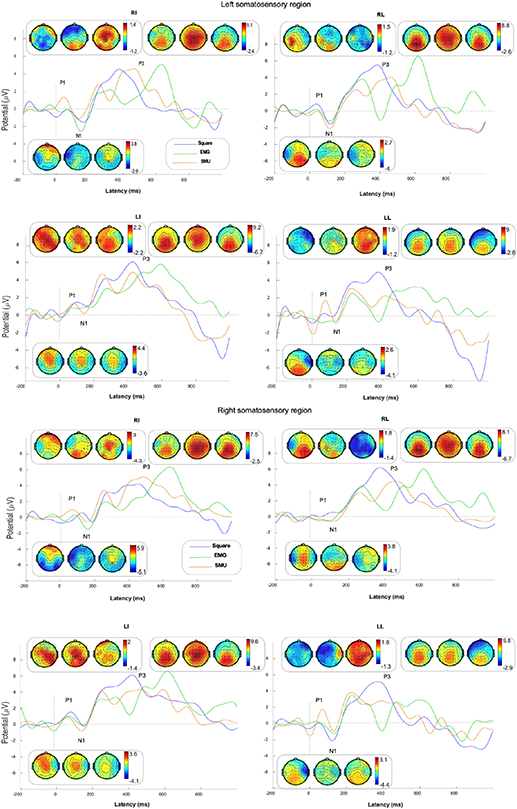
Figure 5. Average ERPs for RI, RL, LI and LL stimulation sites in the left and right somatosensory regions.
Download figure:
Standard image High-resolution imageTable 2. Results of three-way ANOVA with three within factors evaluating ERPs components.
| Three-way ANOVA | P1 amplitude | P1 latency | N1 amplitude | N1 latency | P3 amplitude | P3 latency | |
|---|---|---|---|---|---|---|---|
| Sites | — | *** | — | *** | — | *** | |
| Patterns | — | *** | — | *** | — | *** | |
| Regions | — | *** | — | * | — | * | |
Sites  Patterns Patterns | — | *** | — | *** | — | *** | |
Sites  Regions Regions | — | *** | * | *** | — | — | |
Patterns  Regions Regions | — | *** | — | *** | — | — | |
Sites  Patterns Patterns  Regions Regions | — | *** | — | * | — | * | |
| Post hoc two-way ANOVA | |||||||
| Square pattern | Sites | — | *** | — | *** | — | *** |
| Regions | — | * | — | *** | — | — | |
Sites  Regions Regions | — | *** | — | *** | — | ** | |
| EMG pattern | Sites | — | *** | — | *** | — | *** |
| Regions | — | — | — | *** | — | * | |
Sites  Regions Regions | — | *** | — | *** | — | * | |
| SMU pattern | Sites | — | *** | — | *** | — | * |
| Regions | — | * | — | — | — | — | |
Sites  Regions Regions | — | *** | — | *** | — | — | |
Note: Sites = stimulated sites; Patterns = stimuli patterns; Regions = somatosensory regions. *p < 0.05; **p < 0.01; ***p < 0.001.
The results of post hoc one-way ANOVA are shown in figure 6. In both the left and right somatosensory regions, the latency of the P1 and N1 components was significantly longer in the square pattern compared with the EMG and SMU patterns for most stimulated sites. For the LL stimulated site, there were opposite results. There were no significant differences in amplitude for the P3 component among the three stimulus patterns for each stimulated site. However, for each stimulated site, the nTENS patterns (EMG and SMU patterns) had longer latency compared with the cTENS pattern (square pattern). Additionally, the EMG pattern had the longest latency in the P3 component, while the square pattern had the shortest. In summary, no evidence of significant differences in amplitudes of each SEPs component was found. Meanwhile, nTENS patterns exhibited a shorter latency in the early components of SEPs (P1 and N1), and a longer latency in a more cognitive function related component (P3), suggesting that there is different tactile information processing between nTENS and cTENS patterns.
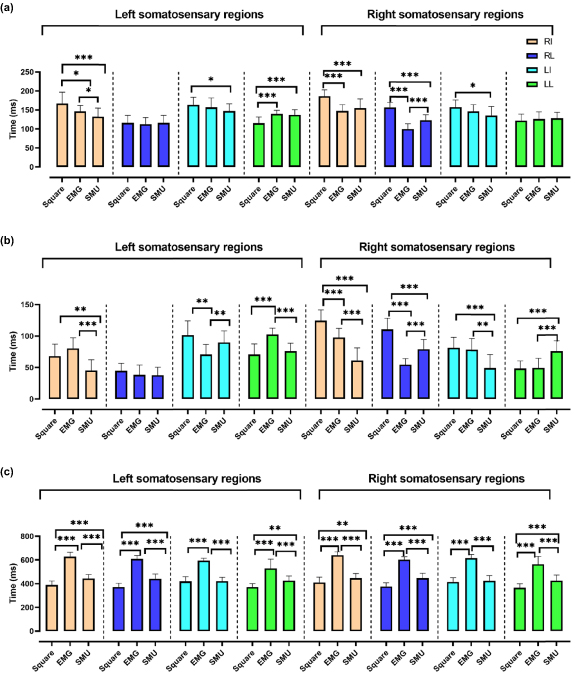
Figure 6. (a) Latency of the N1 component in the three groups. (b) Latency of the P1 component in the three groups. (c) Latency of the P3 component in the three groups. RI = right index finger, RL = right little finger, LI = left index finger, LL = left little finger, Square = square waveform pattern; EMG = electromyography pattern; SMU = single motor units pattern *p < 0.05; **p < 0.01; ***p < 0.00.
Download figure:
Standard image High-resolution image3.3. Network metrics results
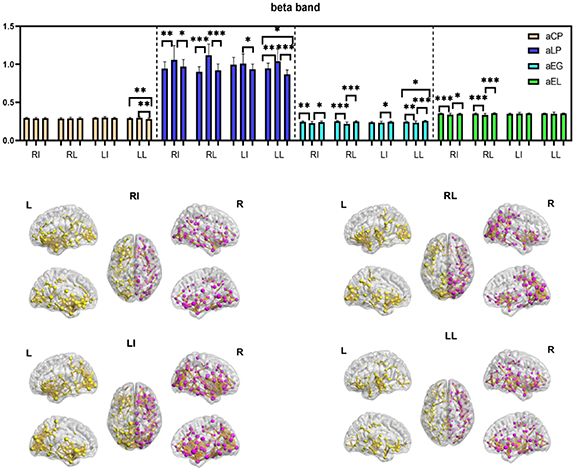
The comparison results of network metrics, including aCP, aLP, aEG, and aEL in six frequency bands among the three patterns are shown in figure 7. In the delta band, there were no significant differences among the three waveform patterns for all stimulated sites. In the theta band, the EMG pattern had significantly longer aLP and lower aEG compared with the other patterns at RL. In the alpha band, significant differences were only found in RL, which showed lower aEG for the EMG pattern. In the other three bands, there were similar results, with the EMG pattern showing the longest aLP and lowest aEG and aEL for most stimulated sites (see supplementary data (available at stacks.iop.org/JNE/19/026017/mmedia)). By contrast, the results suggested that the SMU pattern had the most efficient networks in the beta, low gamma and high gamma bands (shortest aLP and highest aEG and aEL).
Figure 7. Results of cortical networks (a) Cortical brain functional networks and (b) network metrics of SMU pattern in beta band across stimulus sites. L = left somatosensory regions, R = right somatosensory regions, RI = right index finger, RL = right little finger, LI = left index finger, LL = left little finger, Square = square waveform pattern; EMG = electromyography pattern; SMU = single motor units pattern *p < 0.05; **p < 0.01; ***p < 0.001.
Download figure:
Standard image High-resolution image
4. Discussion
In this study, we investigated the EEG features of cTENS and nTENS during the tactile discrimination task in healthy subjects. We creatively developed the EMG and SMU patterns as nTENS patterns for eliciting tactile perception, and evaluated their characteristics in behavioral data and EEG features. The prior concern in this study was that we were trying to find and investigate characteristics of new electrical stimulation patterns in imitating touch. The results showed that the nTENS pattern could use less charge to elicit similar tactile intensity as the cTENS pattern. In addition, the SMU pattern required the lowest charge for a similar tactile intensity. Though there were variations in RI side, the behavioral results in the tactile discrimination task showed that participants rating the highest score in SMU patterns compared with the other patterns. Moreover, the nTENS pattern had shorter latency in early SEPs components and exhibited longer latency of P3 component at each stimulated site compared with the cTENS pattern. As for cortical functional networks, the results showed that the SMU pattern was the most efficient network, with the shortest aLP and highest aEG and aEL in beta, low gamma and high gamma bands. These results suggested that cTENS and nTENS could affect distinct manifestations in both the behavior and brain functional mechanisms.
4.1. Characteristics of the nTENS patterns
TENS is a stimulating device that could deliver electrical current across the intact surface of the skin, during which pulse currents are generated by a portable pulse generator and delivered by using conducting pads or electrodes. cTENS is generally used in clinic for pain relief. Previous studies have investigated the application of TENS in upper limb amputees to release the phantom pain and restore the sense of touch after hand amputation. The phantom hand map phenomenon helped investigators target stimulation on specific stump areas to evoke and possibly produce a natural sensation of touch (Chai et al 2013, 2015, Svensson et al 2017, Li et al 2018). It was also suggested that cTENS could activate similar tactile perceptions in upper limb amputees and able-bodied subjects (Yin et al 2018, Su et al 2020a, 2020b). Some of the studies have also compared difference in real fingertips under cTENS between forearmed amputees and able-bodied subjects. However, the effects on brain functional mechanism in able-bodied subjects with cTENS and nTENS patterns were scarce. In this study, TENS was applied in testing tactile sensory in real fingertips with healthy subjects. Unlike amputees, able-bodied subjects could provide basic and realistic knowledge in manifestations affected by TENS without influence of body injury.
The standard output characteristics of a cTENS mainly include the amplitude, frequency and duration of each pulse (Johnson 2012). Changing these characteristics would selectively elicit different populations of nerve fibers to access noxious sensations such as pain, tingling and rubbing, or innoxious perception, e.g. touch, vibration and pressure. Previous studies have investigated the effects of modulated TENS characteristics in tactile perceptual restoration. Some of them reported that the frequency feature plays a key role in modulating more natural tactile perception in upper limb amputees. A novel stimulation pattern driven by EMG signal was developed, suggesting that neuromorphic electrical stimulation in a closed-loop tactile feedback system is feasible and effective (Osborn et al 2017).
In this study, we applied both cTENS and nTENS to evoke tactile perception in four finger sites in healthy subjects. The original EMG and SMU signal data were adopted as output patterns of nTENS. To our knowledge, there was Osborn and colleagues (Osborn et al 2018) applied nTENS pattern in tactile restoration by transforming real pressure signals into nTENS signals. We were trying to find new neuromorphic approach to restore more pleasant or natural tactile perception. A neuromorphic pattern aims to implement components of a neural system. One reason for utilizing a neuromorphic pattern is to create a biologically relevant representation of tactile information using actual mechanoreceptor characteristics. Tough the EMG and SMU signals were not directly related to real tactile perception, these signals still have biological characteristics. And we were aiming to apply this new electrical stimulation pattern further into a closed-loop control system with prosthesis for forearmed amputees. Considering it, electrical stimulation was much more convenient and flexible with its modifiable parameters than a mechanical stimulation. In this study, a comparison showed that nTENS had a higher frequency compared with cTENS pattern, and used less current intensity to elicit a similar tactile perception. Moreover, manifestation affected by the SMU pattern showed a higher rating score in eliciting tactile perception, with the lowest current intensity among all patterns. This result was consistent with previous findings that frequency feature plays a key role in restoring tactile perception; a higher frequency in the TENS pattern could activate a more natural sense of touch. Furthermore, the current amplitude needed to excite a nerve fiber declines with increasing pulse duration and frequency. These results suggested that nTENS, especially the SMU pattern, could have a promising application in tactile perception rebuilding. Interestingly, there is a trend that participants discriminated more sensitive in the left hand than the right hand during experimental task (figure 4). Considering the recruitment criteria, all the participants were right-handed, which means their right hand were used more frequently than left hand in real life. Former studies suggested that hand-preference was associated with structural connectivity in dominate hemisphere (Amunts et al 1996) and tactile perception of direction was significantly more accurate on the left hand than on the right hand in right-handed subjects (Varney and Benton 1975). Therefore, participants might perform differently between the right and left hand. As a result, the RI side was most used in our daily life relating to touch, and no significant difference in rating score suggested that RI side could perform worst in subjectively distinguishing delicate perceptions. This result indicated that there were variations in distinct fingertips when elicited artificial tactile perception.
4.2. ERPs in tactile perception
SEPs are one type of ERPs, which could be generated by the stimulation of afferent peripheral nerve fibers elicited by electrical, tactile or other stimulation. SEPs could be recorded over the brain, while stimulating various dermatomal areas of the skin (Kraft et al 1998). Previous study from Genna and colleagues (Genna et al 2017) has already addressed the results that mechanical stimulation on the fingertips in able-bodied subjects could affect temporal (SEPs) and frequency (power of theta and alpha bands) features bilaterally across the cortex. Compared with this, electrical stimulation in our study also elicited SEPs in central regions of the brain, suggesting that the somatosensory regions of brain could also be activated under electrical stimulation. This was consistent with previous studies which have also recorded SEPs at the center of somatosensory regions around the C3 and C4 electrodes in tactile perception restoration by cTENS patterns (D'Anna et al 2017, Peng et al 2019, Su et al 2020a, 2020b). In this study, the nTENS pattern was showed shorter latency in SEPs than cTENS pattern in most stimulate sides. Short-latency SEPs have been mostly investigated and confirmed to be associated with stimulation characteristics and somatosensory activities. The latency of early SEPs such as P50 and N150 are considered to correlate with stimulus detection at different intensities. Latency of shorter SEPs indicated the propagation speed in nerves of sensory information. Longer latency of N1 and P1 represent a lower speed of sensory propagation (Kulics 1982, Cole and Katifi 1991). Previous studies interpreted the involvement of P50 amplitude in predicting stimulus intensity after stimulus presentation (Forschack et al 2020). Other reports found the most significant effect of perceptual awareness occurring as a negative potential over contralateral somatosensory areas roughly peaking at 140 ms after stimulus presentation (Palva et al 2005, Auksztulewicz et al 2012, Auksztulewicz and Blankenburg 2013, Godfrey et al 2016). Results indicated that the neuromorphic characteristics in nTENS patterns affected the tactile information propagation distinctly with cTENS pattern. Interestingly, opposite results exhibited in N1 and P1 components at LL side that cTENS pattern had a shorter SEPs latency than nTENS pattern. Combing the behavioral variation in RI side suggested that the tactile information processing and distinguishing was various between hands and some fingertips. The distinct usage frequency of fingertips could perform differently under electrical stimulation.
It is generally believed that the amplitude and latency of the P3 component in SEPs are affected by the probability of stimulation (Pritchard 1981). The latency of the P3 component was associated with stimulus characteristics (Tang et al 2019). The P3 peak latency is usually interpreted as the speed of stimulus classification resulting from the discrimination of one event from another. Additionally, it could reflect the timing of stimulus evaluation and personal cognitive capability (Barceló and Cooper 2018). Tang et al revealed that stimuli with larger grating width induce a shorter P3 latency, corroborating our results. In this study, the cTENS pattern induced a shorter P3 latency compared with nTENS patterns, and the SMU pattern induced the lowest P3 amplitude in most stimulated sites, indicating that tactile recognition in nTENS patterns is a complex information processing. The SMU pattern provided a more pleasant tactile perception compared with other stimuli patterns.
4.3. Cortical functional network in tactile perception
Several studies have investigated the brain cortical function of tactile perception by brain imaging technologies. They are in agreement with the neurophysiological theory that the somatosensory cortex dominates the tactile perception. Previous functional magnetic resonance imaging (fMRI) studies interpreted the ipsilateral and contralateral secondary somatosensory cortices as the most promising regions for conscious tactile perception (Moore et al 2013, Schröder et al 2019). The interaction between the primary and the secondary somatosensory area plays an important role in tactile detection (Auksztulewicz et al 2012). Furthermore, the precuneus, the insula gyrus, and the inferior frontal gyrus are involved in the domain-general brain areas of detecting tactile consciousness and stimulation intensity (Dehaene et al 2006, Schröder et al 2019, Grund et al 2021).
Graph theoretical techniques, in common with brain imaging, provide a well-suited tool for characterizing the whole-brain patterns of communication (Godwin et al 2015). A network is defined in graph theory as a set of nodes or vertices and the edges or lines between them, and graph theory can be quantitatively represented by network metrics, especially the clustering coefficient, short path and network efficiency (Bullmore and Sporns 2009). Random networks have low average clustering, whereas complex networks have high clustering, which is associated with high local efficiency of information transfer and robustness. In addition, random and complex networks have short mean path lengths (high global efficiency of parallel information transfer), whereas regular lattices have long mean path lengths. In this study, brain network affected by SMU was showing the shortest path length with higher efficiency, which suggested a more efficient complex network with higher energy conservation during the tactile restoration by SMU pattern.
Assessment of frequency-dependent functional connectivity between EEG sensors has revealed that many topological and dynamic properties of brain functional networks are conserved across frequencies (Bullmore and Sporns 2009). Source-level brain functional networks across frequencies among brain structural regions have been assessed, showing the ability to estimate the cognitive process and psychiatric disorders (Kim et al 2020a, 2020b). Moreover, previous study indicated that beta and gamma bands oscillatory networks correlated with activity between cortical areas mediating sensory and cognitive processing in evoking tactile perception (Adhikari et al 2014). Oddo and colleagues (Oddo et al 2016) also confirmed that clustering modulation reduced across all frequencies in the hemisphere contralateral to the electric stimulation. Our results were consistent with previous studies, suggesting that efficiency performed distinct across all frequencies and changes of network features in beta and gamma bands provide important insights into neural mechanism in tactile perceptual restoration.
4.4. Limitations
The present study had several limitations. First, we only investigated healthy subjects. To the best of our knowledge, this is the first study investigating the effects in cortical functional networks of tactile perception elicited by cTENS and nTENS. Healthy subjects could provide more reliable perception of natural sense of touch in the first place. Further studies should examine the different brain functional mechanisms activated by the nTENS pattern between upper limb amputees and healthy subjects. Secondly, results suggested that the SMU pattern is a promising pattern in tactile perception restoration. Further studies should take the SMU pattern into consideration in the application of tactile feedback system in prosthetics or tactile disorder rehabilitation. Moreover, previous studies found that the changes in alpha band activity might be an index for evaluating tactile acuity and current intensity in TENS (Yıldırım et al 2020, Su et al 2020a). Nierula et al (2013) suggested that sensorimotor alpha-oscillation could not represent differential finger stimulation. The present study found that the metrics of cortical functional networks in beta and gamma bands could be objective features in evaluating TENS patterns. Further research should investigate changes in extensive frequency bands of EEG recording. Finally, EMG and SMU were essentially motor control signals that have no distinct relevance to a real tactile perception, and lack of distinct modulation types for cTENS and nTENS patterns limited this work to a simple comparison. Further studies should adopt the square pattern with distinct characteristics and investigate other nTENS waveforms with relevance to biological features of real tactile sensation.
5. Conclusion
In conclusion, the present findings suggested that distinct electric stimulation patterns could affect different brain functional and pathological mechanisms in tactile restoration. SEPs and cortical functional network metrics could be effective indexes for evaluating brain mechanisms in distinct TENS patterns. The characteristics of nTENS patterns, especially the SMU pattern, provide insights in tactile perception restoration and rehabilitation in upper limb amputees.
Acknowledgments
The authors are grateful to all participants, investigators and the staff for this work.
Data availability statement
The data generated and/or analysed during the current study are not publicly available for legal/ethical reasons but are available from the corresponding author on reasonable request.
Funding
This work was supported by the National Key R&D Program of China (Grant No. 2018YFB1307301) and the National Natural Science Foundation of China (Grant Nos. 91648207 and 61673068).