
Abstract
Objective. Brain–computer-interfaces (BCIs) have been proposed not only as assistive technologies but also as rehabilitation tools for lost functions. However, due to the stochastic nature, poor spatial resolution and signal to noise ratio from electroencephalography (EEG), multidimensional decoding has been the main obstacle to implement non-invasive BCIs in real-live rehabilitation scenarios. This study explores the classification of several functional reaching movements from the same limb using EEG oscillations in order to create a more versatile BCI for rehabilitation. Approach. Nine healthy participants performed four 3D center-out reaching tasks in four different sessions while wearing a passive robotic exoskeleton at their right upper limb. Kinematics data were acquired from the robotic exoskeleton. Multiclass extensions of Filter Bank Common Spatial Patterns (FBCSP) and a linear discriminant analysis (LDA) classifier were used to classify the EEG activity into four forward reaching movements (from a starting position towards four target positions), a backward movement (from any of the targets to the starting position and rest). Recalibrating the classifier using data from previous or the same session was also investigated and compared. Main results. Average EEG decoding accuracy were significantly above chance with 67%, 62.75%, and 50.3% when decoding three, four and six tasks from the same limb, respectively. Furthermore, classification accuracy could be increased when using data from the beginning of each session as training data to recalibrate the classifier. Significance. Our results demonstrate that classification from several functional movements performed by the same limb is possible with acceptable accuracy using EEG oscillations, especially if data from the same session are used to recalibrate the classifier. Therefore, an ecologically valid decoding could be used to control assistive or rehabilitation mutli-degrees of freedom (DoF) robotic devices using EEG data. These results have important implications towards assistive and rehabilitative neuroprostheses control in paralyzed patients.
Export citation and abstract BibTeX RIS

Original content from this work may be used under the terms of the Creative Commons Attribution 3.0 licence. Any further distribution of this work must maintain attribution to the author(s) and the title of the work, journal citation and DOI.
Introduction
Brain–computer interface (BCI) systems can be used to decode brain activity into commands to control external devices [1, 2]. A recent double-blind controlled study has demonstrated for the first time that BCI control of a rehabilitation robot can promote motor recovery of severely paralyzed chronic stroke patients [3], being these results reproduced and confirmed [4–6]. BCIs can also function as an assistive device to restore a lost function, such as motor control. It's obvious that the number of DoFs that can be volitionally controlled is very relevant for assistive technologies and prosthetics. This has also been suggested to be of paramount importance in rehabilitation robotic therapies [7, 8]. Initial EEG-based BCI studies controlling several DoFs were achieved using motor imagery paradigms involving different limbs (e.g. 3D cursor control using hand versus feet versus tongue motor imagery) [9, 10]. This control strategy, albeit successful, is not based on 'natural' or ecologically valid environments (i.e. based on EEG oscillations produced rapidly and without conscious effort when performing the task) and an extensive learning process is necessary to achieve acceptable control performance. Recently, new strategies have been used to control multi-DoF robots based on EEG error potentials [11], steady state visual evoked potentials (SSVEPs) [12] and P300 potentials, even in ALS patients [13–15]. These strategies require attention but ignore motor descending corticospinal volleys, which seems to be key aspect in motor rehabilitation BCIs aiming at restoring natural corticomuscular connections [3]. Involvement on descending motor commands was suggested as key mechanism in motor rehabilitation because motor execution/attempt brain activity only was correlated with significant motor improvement compared to motor imagery related brain activity during a proprioceptive BCI rehabilitative intervention [3]. Other strategies like trajectory decoding [16] might offer a promising solution, albeit methodological challenges [17].
Neuronal population signals have been used to decode, with acceptable decoding performance, directional movement executions using non-invasive magnetoencephalographic (MEG) [18] and intracranial activity [19] from the motor cortex. Furthermore, intracortical activity has been succesfully used to control several degrees of freedom of robotic devices in primates [20, 21] and in humans [22, 23] decoding and/or encoding neural signals. Recently, control over functional electrical stimulation (FES) [24] in humans has been also achieved. Furthermore, intracranial EEG has also been used to continuously decode two-dimensional (2D) hand position [25], wrist movement trajectory [26] and seven different hand movement intentions in severely paralyzed chronic stroke patients [27]. However, invasive and MEG (nowadays too bulky and expensive to be considered as a practical option) data decoding are out of the scope of this paper.
Upper limb and especially hand movement decoding from electroencephalography (EEG) signals is still challenging mainly due to poor signal to noise ratio and spatial resolution [28]. Existing motor rehabilitation oriented BCI systems (i.e. decoding 'natural' movement related EEG oscillations) decode two classes only using simple binary classification between rest and movement [3, 4, 29–32]. These BCI systems only allow a user to control 1 DoF (e.g. orthosis for opening or closing the hand, a predefined functional electrical stimulation (FES) or visual feedback).
Recent studies have achieved classification of the same limb with acceptable performance using EEG data although many of these studies classify only two movements [18, 28, 33, 34]. Liao et al investigated the binary classification of ten different pairs of executed finger movements using 128-channel EEG signals achieving a promising average decoding performance of 77.1% [35]. In another study, six different wrist movement pairs (e.g. flexion versus extension or pronation versus supination) were decoded with average accuracy ranging from 60 to 80% [36]. A few other groups have reported some preliminary work on multi-class decoding using motor imagery and execution of movements from the same upper limb [33, 37, 38]. Yong et al have shown a 3-class BCI system that discriminates EEG signals corresponding to rest, imaginary grasp, and elbow movement [33]. Furthermore, classification of hand movement directions from the same limb using EEG has not been sufficiently explored in the literature. Our previous work reported five class EEG decoding reported during multiclass classification of four movements directions and rest from the same limb [34].
We believe, discriminating different movements within the same limb would allow more intuitive control of neuroprostheses (e.g. brain controlled exoskeleton) without considering any artificial association between actual movement and neuroprosthetic movement. Therefore, in the here presented work, we aimed at discriminating 6 different functional movements from the same limb with acceptable accuracy levels using EEG data towards a more intuitive and natural control of rehabilitative devices like robotic exoskeletons and FES. Furthermore, we evaluated the impact of different recalibration strategies on the decoding to optimize system stability.
We hypothesize decoding accuracy levels allowing robotic control of rehabilitative devices of up to 6 functional movements from the same limb, could be achieved using EEG activity only.
Materials and methods
Participants
Study participants included nine healthy right-handed subjects (6 male, age: 24 ± 4 years) with no history of neurologic disease. Participants underwent four recording sessions (4 non-consecutive days) within eight days (average time between each session was 2 d). The experimental procedure was explained to the subjects and they were asked to sign a written consent form. Ethically permission was given by the ethical committee of the Faculty of Medicine, University of Tübingen, Germany.
Experimental setup
Participants were seated in a comfortable chair in front of a desk (see figure 1(A)) especially designed for the experiment. Participants were asked to perform 4 different center-out functional reaching movements and move back to the initial starting position (see figure 1(A)) with their right upper limb attached to an IS-MORE 7-DoF robotic exoskeleton (Tecnalia, San Sebastian, Spain) upon imperative auditory cues (see figure 1(A)). All the participants were instructed to perform the outreaching movements in the same way, and rhythmic auditory cues were used to facilitate movements' timing. The directional colored targets were named as Blue, Red, Green, and Brown. Participants were asked to reach a colored target and return to the rest position at a comfortable pace.
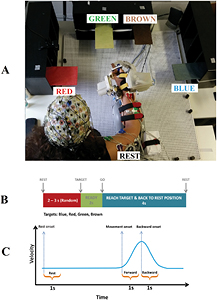
Figure 1. (A) Experimental situation: participant performing a reaching movement from the starting rest position towards the green target. Reaching movements were executed towards the four different targets represented by rectangles coloured in blue, red, green and brown. (B) Timing: to begin, an auditory 'Rest' cue was presented indicating a random resting period between 2 to 3 s. immediately after this period an instructional auditory cue indicated to which target the participant was asked to move (blue, red, green, brown). Two seconds afterwards a 'GO' cue indicated the moment to start the active movement towards the targets at a comfortable pace, having a 4 s time out to perform the reaching movement and come back to the starting position. (C) Movement onsets were identified for forward and backward movements into 1 s epoch for each trial by kinematics data. Rest class was also segmented into 1 s epoch from the beginning of each rest interval.
Download figure:
Standard image High-resolution imageIS-MORE robotic exoskeleton
We decided to use an exoskeleton to record the kinematic data to simulate a realistic scenario condition in which a patient could brain-control the exoskeleton to produce functional movements like reach and grasp. For an optimal stroke rehabilitation paradigm, a realistic environment with different functional movements trained at the same time is very important. Training of reaching movements is key in stroke recovery, as it involves elbow-shoulder coordination [39]. The Exoskeleton was friction-free and motors were disengaged, although produced some mechanical restrictions (e.g. no vertical, or writs movement). Furthermore, the haptics related to the use of the exoskeleton will be present during the real scenario and could also produce some brain activity from afferent origin, which could influence brain oscillatory signature of each motor task.
The exoskeleton can be moved in 7 DoFs including displacement and rotation of the forearm in a 2D horizontal plane (3 proximal DoFs: position in X, position in Y, and forearm orientation angle), pronation and supination of the wrist (1 distal DoF: wrist angle), flexion and extension of the thumb, index and the group of middle, ring and pinky fingers (3 distal DoFs: thumb angle; index angle; three fingers angle).
Kinematic data (position in X, position in Y, and forearm orientation angle) of the midpoint of the fore-arm was calculated and recorded via a camera attached to the bottom of the base of the device. The exoskeleton rolls on top of a map with micro optical symbols printed on it, which are used to calculate the instantaneous position (more details can be found in [37, 40]). The rest of the DoFs were recorded using motor encoders and potentiometers. Kinematic data was recorded at 18 Hz. Participants also performed 4 hand grasping movements (pinch grip, key and cylindrical grasp and pointing with the index finger) and reach-and-grasp movements to the 4 targets described in the manuscript combining the different grasping movements using especially designed objects for that purpose. Although we have analyzed the data, we have not included neither the experimental procedure nor the classification results in this manuscript because we did not obtain 'above chance level' classification results for the grasping movements.
Experimental paradigm
Each experimental session was divided in 5 runs, each consisting of 40 trials (10 trials for each target). The experimental timing diagram for each trial is shown in figure 1(B). Each trial consisted of three phases separated by auditory cues: (1) resting interval (random length between 2–3 s); (2) an instructional cue regarding the target to be reached (2 s); (3) 'Go' cue to initiate reaching movements towards the indicated targets and come back to the starting position at a comfortable pace but always executed in less than 4 s. In order to reduce artifacts, we asked subjects to keep the jaw and face muscles relaxed avoiding eye blinks or swallowing during data recording. Therefore, to increase participants' awareness regarding artifacts, we performed a brief instruction task before the first session instructing subjects to perform face, neck, contralateral arm and eye movements, while raw data was shown to them.
Data acquisition
EEG was recorded according to the international 10–20 system from 32 active electrodes as FP1, FP2, F7, F3, Fz, F4, F8, FC5, FC1, FC2, FC6, T7, C3, Cz, C4, T8, TP9, CP5, CP1, CP2, CP6, TP10, P7, P3, Pz, P4, P8, PO9, O1, Oz, O2, and PO10 (ActiCap, Brain Products GmbH, Germany) and the cap was fixed by a chinstrap to avoid electrode shifts. EOG was recorded with passive electrodes. AFz and FCz were used as the ground and reference electrodes, respectively. The impedance of electrodes was kept below 5 kΩ. EEG data were sampled (BrainAmp, Brain Products GmbH, Germany) at a frequency of 2500 Hz. BCI2000 software was used to record EEG data from the acquisition system and to present the auditory cues [41].
Data analysis
Preprocessing.
After offline visual inspection peripheral channels (Fp1, Fp2, T7, T8, TP9, TP10, P7, P8, O1, Oz, O2, PO9, and PO10) were removed from prospective data analysis due to excessive noise and/or artefacts. Blind Source Separation (BSS) algorithm [42] from the automatic artifact removal (AAR) toolbox as an EEGLAB plug-in [43] was used to remove artifacts caused by eye-blinks and eye movements, and muscle activity from face, neck and shoulder movements. Live video streaming with a frontal view from the participants allowed the experimenter to control for systematic or random artifacts, which were reported to the participant if persistent and the correspondent experimental run was disregarded from the analysis. Data was downsampled to 250 Hz, band-pass filtered (0.1–70 Hz), and the power line noise was removed using a 50 Hz notch filter. An open-source MATLAB toolbox, BCILAB, was used to process the EEG data [44].
Time-frequency analysis.
Time-frequency analysis for the investigation of spectral changes at distinct time points was performed using wavelet transforms even at the lowest frequency (1 Hz corresponding to 3 cycles during 1 s) as event-related spectral perturbations (ERSPs) [10]. The time window analyzed included 3 s before and 7 s after the auditory 'Go' cue and the time course was obtained by averaging the power change of the frequency bands across all trials during the movement. The time window from −3 to −2 s before the 'Go' cue was used as baseline (see figure 2(B)).

Figure 2. Filter bank common spatial pattern (FBCSP) and time-frequency analysis: EEG data from a representative participant transformed into spatio-frequency topographical maps and into one selected channel time-frequency domain. (A) Highest-ranking common spatial patterns for each pair of movements within the specific frequency band (black dots represent the 19 channels used for classification). BLUE and RED stand for reaching movement towards the blue and red target respectively. (B) Channel C3 time-frequency event-related spectral perturbation (ERSP) during reaching towards the blue target. The vertical dashed line shows the time when the Go cue was presented to the participant.
Download figure:
Standard image High-resolution imageFeature extraction and classification.
The kinematics data (position in X, position in Y, and forearm orientation angle) of the base of the IS-MORE exoskeleton were only analyzed (up-sampled to 250 Hz and synchronized with EEG data), and used to identify sub-movements within a task (forward and backward phases during reaching movements) and hence, to label EEG data. Every EEG trial for movements phase was segmented into two 1 s epochs (figure 1(C)): (a) starting from movement onset identified by kinematics data to forward movement towards the target); and (b) starting movement after target was reached (backward movement towards the starting position). Rest class was also segmented into 1 s epochs from the beginning of each rest interval. Data from all trials for each class were appended and used to extract spatio-frequency features using filter-bank common spatial patterns (FBCSP) [45], which is an extension of the standard common spatial pattern (CSP) algorithm [46]. We applied FBCSP as feature extraction method because it uses frequency filtering into multiple frequency bands, which could benefit the decoding of different motor tasks as demonstrated previously [33]. Furthermore, CSP algorithm has been proven its efficacy calculating optimal spatial filters for motor related BCIs [25, 33, 35]. Spatial filters were created for three frequency windows: 7–15 Hz, 15–25 Hz, and 25–30 Hz. The log-variance of the filtered signal was used as feature for classification.
We set three as the number of spatial filters to use for the CSP algorithm in accordance to prior studies with CSP [33, 45] resulting in 6 features per frequency band and 18 features per channel. The spatial patterns used in feature extraction representing the areas involved in each movement EEG activity were obtained with the help of FCSP patterns (figure 2(A)). We obtained the topographical distribution of the difference in EEG activity during 2 different movement conditions (e.g. reaching towards Blue versus Rest) in specific frequency bands. As depicted with data from a representative participant in figure 2(A), the EEG activity difference is prominent when comparing each movement direction and Rest. However, the difference is not obvious when comparing EEG activity produced during reaching movements towards 2 different targets (e.g. Blue versus Red). Therefore, FCSP patterns of ERD of the mu and beta rhythms were needed to extract distinct features for the different execution movements.
The resulting feature vector was then fed to the Linear Discriminant Analysis (LDA) classifier as multi class classifier. Taking into account the similar performance of LDA and SVM for multiclass classification [33], we chose LDA as our preferred method. It is basically a two-class classifier extended to more classes by one-versus-one voting. For the one-versus-one voting scheme, the classifier was trained for a K(K − 1)/2 binary classifiers in a K-way multiclass problem [47]. Validation performance was estimated using five-fold blockwise cross-validation with 5 trials safety margin. Thus, each session was split up into five folds, with each fold being used for testing and used the remaining four folds to train the classifier. Decoding accuracy was estimated according to the average over all folds for each session.
To evaluate the statistical significance thresholds for decoding accuracy, we used the chance levels (p < 0.05) for an infinite number of trials and classes using the binomial cumulative distribution [48]. From now on, we will refer to wthis significance level when reporting classification accuracy results.
The collected EEG data contained nine different states: REST, and eight actual directional movements: four forward (F) (towards BLUE, RED, GREEN, and BROWN targets) and four backward (B) (coming back from each target to the starting position) that we combined in one movement only (coming back to the starting position from any target (BACKWARD)) to reduce the number of classes. In this manuscript, we described the classification of three different complexity cases, decoding 3, 4 and 6 movement classes:
- 3 class (RED, BLUE, REST)
- 4 class (RED, BLUE, BACKWARD, REST)
- 6 class (RED, BLUE, GREEN, BROWN, BACKWARD, REST)
Recalibration.
In order to investigate how the recalibration could affect the classification results, we first divided each session in five data blocks that were used later as folds for the cross-validation of the classification and tested three decoding schemes using data from the different four sessions (see table 1):
- Scheme 1 (within session): We used each session for both training and testing with five-fold cross-validation. The within session decoding accuracy was averaged over all folds.
- Scheme 2 (recalibrated between-sessions): Previous and current session data (four folds) were used for training, and only one fold of current session (S2* or S3* or S4*) was used for testing. The recalibrated between sessions decoding accuracy was averaged over all folds.
- Scheme 3 (between sessions): All previous session data were used for training and current session was used for testing in between sessions.
Statistical analysis.
We performed two separate statistical analyses to evaluate: (i) changes in performance over sessions, and (ii), if any factor (scheme, class, and session) had a significant effect in performance.
- To check for learning effects over sessions, we compared classification accuracy differences between the different sessions using a repeated measures ANOVA separately for the 3-class, 4-class, and 6-class problems. The time (four sessions for scheme 1, and three sessions for schemes 2 and 3; see table 1) was considered the independent variable and the classification accuracy the dependent variable.
- A three-way ANOVA was performed to study the influence of the three factors (Scheme, Class, Session) in classification accuracy (dependent variable). Factor scheme consisted of 3 levels (Scheme 1, Scheme 2, Scheme 3); factor classification problem included 3 levels (3-, 4-, and 6-classes); and factor session had also 3 levels (S2, S3, S4). Notice that session S1 was removed from this analysis to facilitate comparisons, as it was only tested in scheme 1 (within session). When these factors or their interactions reached significance (p < 0.05), subsequent post-hoc t-tests were performed, applying a Bonferroni correction for multiple comparisons. These post-hoc comparisons were considered significant if the p-value was below 0.05 after correction.
Table 1. Decoding schemes: different sessions were used for training and testing to investigate re-calibration effects on classification performance. If the same session was used for training and testing (in schemes 1 and 2 indicated by *), it was evaluated using a 5-fold cross-validation to ensure that training and test set do not overlap. Scheme 3 trained with previous 'calibration' sessions and tested on current session.
| Scheme 1 (within session) | Scheme 2 (recalibrated between-sessions) | Scheme 3 (between sessions) | |||
|---|---|---|---|---|---|
| Training | Testing | Training | Testing | Training | Testing |
| S1 | S1* | ||||
| S2 | S2* | S1-S2 | S2* | S1 | S2 |
| S3 | S3* | S1-S2-S3 | S3* | S1-S2 | S3 |
| S4 | S4* | S1-S2-S3-S4 | S4* | S1-S2-S3 | S4 |
Results
Regardless of the number of movements to be classified and the calibration strategy, the classification results were above significance level in all participants. For clarity, the results section was categorized into three sections according to different decoding schemes (calibration strategy) and complexity of the classification (number of movements to be classified).
Scheme 1 (within session classification): Each session was used for training and testing with five-fold cross-validation.
3-movements classification
We obtained an average accuracy of 67 ± 7.33 % (significance level 40%) for classifying 3-classes (Blue versus Red versus Rest) as can be seen in detail from table 2. The maximum classification accuracy over all sessions was observed in Participant1 (75.25 ± 10) and the minimum for Participant 6 (53.25 ± 3). The maximum and minimum classification accuracy for one session was observed in Participant1 (Session 2; 86%) and Participant6 (Session 3; 49%) respectively. The mean average accuracy across participants increased from the first session (64%) to the fourth session (69%) being this difference non-significant (p = 0.61). The confusion matrix demonstrated that the 3 classes were similarly classified with no clear confusion between classes.
Table 2. Within session classification results for 3-class (left), 4-class (middle), and 6-class (right) classification accuracy for all participants and sessions. For each participant, average and SD is shown in the last column of the table. In the lower cell of the table significance level of the decoding is shown. Five-fold cross-validation was used to estimate the accuracy. 'P' indicates participant and 'S' for the session.
| 3-class | 4-class | 6-class | |||||||||||||
|---|---|---|---|---|---|---|---|---|---|---|---|---|---|---|---|
| S1 (%) | S2 (%) | S3 (%) | S4 (%) | Average (%) | S1 (%) | S2 (%) | S3 (%) | S4 (%) | Average (%) | S1 (%) | S2 (%) | S3 (%) | S4 (%) | Average (%) | |
| P1 | 70 | 86 | 81 | 64 | 75.25 ± 10 | 59 | 64 | 69 | 59 | 62.75 ± 4.7 | 47 | 54 | 67 | 49 | 54.25 ± 8.9 |
| P2 | 69 | 72 | 78 | 80 | 74.75 ± 5.1 | 72 | 71 | 77 | 75 | 73.75 ± 2.7 | 64 | 53 | 70 | 69 | 64 ± 7.7 |
| P3 | 65 | 62 | 62 | 73 | 65.5 ± 5.1 | 59 | 62 | 60 | 70 | 62.75 ± 4.9 | 54 | 63 | 49 | 55 | 55.25 ± 5.8 |
| P4 | 64 | 72 | 62 | 65 | 65.75 ± 4.3 | 59 | 60 | 65 | 58 | 60.5 ± 3.1 | 43 | 51 | 53 | 41 | 47 ± 5.8 |
| P5 | 52 | 60 | 58 | 65 | 58.75 ± 5.3 | 58 | 59 | 55 | 69 | 60.25 ± 6 | 44 | 41 | 40 | 42 | 41.75 ± 1.7 |
| P6 | 56 | 53 | 49 | 55 | 53.25 ± 3 | 47 | 51 | 46 | 48 | 48 ± 2.1 | 38 | 36 | 28 | 32 | 33.5 ± 4.4 |
| P7 | 71 | 61 | 78 | 78 | 72 ± 8 | 66 | 62 | 65 | 68 | 65.25 ± 2.5 | 50 | 55 | 58 | 52 | 53.75 ± 3.5 |
| P8 | 64 | 63 | 82 | 75 | 71 ± 9.1 | 65 | 67 | 74 | 64 | 67.5 ± 4.5 | 49 | 52 | 54 | 47 | 50.5 ± 3.1 |
| P9 | 66 | 65 | 69 | 67 | 66.75 ± 1.7 | 61 | 66 | 67 | 62 | 64 ± 2.9 | 53 | 52 | 58 | 50 | 53.25 ± 3.4 |
| Average | 64.1 ± 6.3 | 66 ± 9.5 | 68.7 ± 11.6 | 69.1 ± 7.9 | 67 ± 7.33 | 60.6 ± 6.8 | 62.4 ± 5.6 | 64.2 ± 9.5 | 63.6 ± 8 | 62.75 ± 6.8 | 49.1 ± 7.5 | 50.7 ± 7.9 | 53 ± 12.9 | 48.5 ± 10.3 | 50.3 ± 8.76 |
| Significance level | 40% | 30% | 20.33% | ||||||||||||
4-movements classification
Table 2 (in the middle) shows a mean classification accuracy of 62.75 ± 6.89% (significance level 30%) for all participants when classifying 4-classes (Blue, Red, Backward, and Rest). Maximum classification accuracy over all sessions was observed in Participant2 (73.75 ± 2.7) and the minimum in Participant6 (48 ± 2.1). Same as for the 3-class classification, the maximum and minimum classification in one session was achieved by Participant1 (Session 3; 77%) and Participant6 (Session 3; 46%) respectively. The Average accuracy increased from the first session for 60.6% compared to the fourth-session for 63.6% (see table 2 in the middle), being this difference non-significant (p = 0.76).
6-movements classification
Table 2 (in the right) shows an average accuracy of 50.3 ± 8.76% (significance level 20.33%) for all participants when classifying 5 movements towards different targets (Blue, Red, Green, Brown, and Backward) and Rest. Maximum classification accuracy over all sessions was observed in Participant2 (64 ± 7.7) and the minimum in Participant6 (33.5 ± 4.4). The maximum and minimum classification in one session was observed in Participant2 (Session 3; 70%) and Participant6 (Session 3; 28%) respectively. In the Confusion matrix (figure 3 in the right) can be seen that in contrast to the targets more separated from each other (Blue and Red), neighbor targets are confused by the classifier. Average accuracy did not change significantly between sessions (p = 0.77).
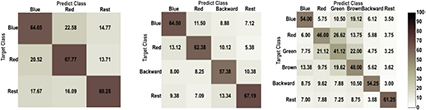
Figure 3. Within session classification results. Confusion matrices showing the mean classification accuracy (%) of all participants for different combination of movements (blue, red, green, brown, backward, and rest).
Download figure:
Standard image High-resolution imageScheme 2 (recalibrated between-sessions classification): In this scheme, previous and current sessions were used for training and only the current session was used for testing with five-fold cross-validation.
Table 3 shows the mean decoding performance of multiclass combinations of 3-class, 4-class, and 6-class during 3 different recalibration using different combinations of sessions: a) two sessions were used for training (S1, S2) and tested on unseen data of S2; b) three sessions were used for training (S1, S2, S3) and tested on unseen data of S3; and c) four sessions (S1, S2, S3, S4) were used for training and tested on unseen data of S4. In each recalibration of sessions (table 3) the previous and the current session were used as the training sets, and the current session was used as the testing set.
Table 3. Mean classification accuracy (%) for the offline analysis of multiclass combination during different session calibration and current session with testing on current session. If the same session was used for training and testing (in scheme 1 and 2 indicated by *, it was evaluated using a 5-fold cross-validation to ensure that training and test set do not overlap. First recalibration: two sessions were used for training (S1, S2) and tested on unseen data of S2*. Second recalibration: three sessions were used for training (S1, S2, S3) and tested on unseen data of S3*. Third recalibration: four sessions (S1, S2, S3, S4) were used for training and tested on unseen data of S4*. 'P' indicates participant.
| 3-class | 4-class | 6-class | |||||||
|---|---|---|---|---|---|---|---|---|---|
| S1-S2* (%) | S1-S2-S3* (%) | S1-S2-S3-S4* (%) | S1-S2* (%) | S1-S2-S3* (%) | S1-S2-S3-S4* (%) | S1-S2* (%) | S1-S2-S3* (%) | S1-S2-S3-S4* (%) | |
| P1 | 79 | 73.7 | 48.1 | 73.6 | 60.4 | 33.6 | 57.2 | 52.6 | 44.8 |
| P2 | 79.6 | 84.9 | 84.8 | 73.7 | 86.1 | 82.2 | 65.2 | 58.5 | 67.1 |
| P3 | 55.3 | 60.5 | 62 | 51.3 | 48 | 48.8 | 38.1 | 37.5 | 36.2 |
| P4 | 66.5 | 63.2 | 59.9 | 68.4 | 65 | 54.6 | 53.8 | 46 | 38.2 |
| P5 | 59 | 64.2 | 60.5 | 62 | 61.5 | 64.5 | 52.5 | 55.4 | 56.5 |
| P6 | 49.3 | 48.6 | 45.4 | 35.6 | 42.7 | 34.2 | 27 | 28.7 | 25.7 |
| P7 | 63.2 | 67.6 | 76.4 | 62.7 | 49.3 | 69.8 | 42.8 | 36.2 | 49.4 |
| P8 | 73.7 | 72.9 | 76.5 | 52.6 | 66.5 | 63.1 | 40.2 | 46.4 | 42.1 |
| P9 | 80 | 87.5 | 91 | 74.4 | 85 | 87 | 50.6 | 63.1 | 62 |
| Average | 67.2 ± 11.4 | 69.2 ± 12.13 | 67.1 ± 15.86 | 61.5 ± 13 | 62.7 ± 15.27 | 59.7 ± 18.9 | 47.5 ± 11.54 | 47.15 ± 11.38 | 46.8 ± 13.23 |
| Significance level | 38 | 37.11 | 36.5 | 28.5 | 28 | 27.5 | 19.16 | 18.77 | 18.41 |
As shown in table 3, mean classification accuracies for the first recalibration of sessions (S1 and S2 for training; S2* for testing) were 67.2 ± 11.4%, 61.5 ± 13%, and 47.5 ± 11.54% for 3-class, 4-class, and 6-class respectively. The maximum classification accuracy in the 3-, 4- and 6-class paradigm was 80% (Participant9), 74.4% (Participant9) and 65.2% (Participant2) respectively. The minimum classification accuracy in the 3-, 4- and 6-class paradigm was obtained always for Participant6 and was 49.3%, 35.6%, and 27%, respectively.
During the second recalibration of sessions in table 3, mean classification accuracies (S1, S2, S3 for training; S3* for testing) were 69.2 ± 12.13%, 62.7 ± 15.27%, and 47.15 ± 11.38%. The maximum average accuracy in the 3-, 4- and 6-class paradigm was 87.5% (Participant9), 86.1% (Participant2) and 63.1% (Participant9), respectively. The minimum classification accuracy in the 3-, 4- and 6-class paradigm was obtained for Participant6 and was 48.6%, 42.7%, and 28.7%, respectively.
During the third recalibration of sessions, mean classification accuracies (S1, S2, S3, S4 for training; S4* for testing) were 67.1 ± 15.86, 59.7 ± 18.9, and 46.8 ± 13.23. The maximum classification accuracy was also observed for 3-, 4- and 6-class 91% (Participant9), 87% (Participant9), and 67.1% (Participant2), respectively. The minimum classification accuracy for 3-, 4- and 6-class was obtained for 45.4% (Participant6), 33.6% (Participant 1), and 25.7% (Participant6), respectively. For all combinations the significance level is shown in table 3. Furthermore, we also analyzed the difference in performance for scheme 2 depending on how many sessions' data were included in the recalibration of the classifier (see table 3). Although there was an overall increase in classification accuracy, our ANOVA analysis resulted in not significant results, (3-class p-value = 0.93; 4-class p-value = 0.92; 6-class p-value = 0.98).
Scheme 3 (between-sessions classification): In this scheme, previous sessions were used for training and only current session was used for testing.
Table 4 shows the mean classification accuracy of multiclass combination for 3-class, 4-class, and 6-class for three different combinations (see table 1). We analyzed 3 different recalibration of sessions using the previous session as training set and the current session as test set. a) one session was used for training (S1) and tested on session S2; b) two sessions were used for training (S1, S2) and tested on session S3; c) three sessions (S1, S2, S3) were used for training and tested on session S4.
Table 4. Mean classification accuracy (%) of the offline analysis of multiclass combination during session calibration and testing on current session. First recalibration: one session was used for training (S1) and tested on session S2. Second recalibration: two sessions were used for training (S1, S2) and tested on session S3. Third recalibration: three sessions (S1, S2, S3) were used for training and tested on session S4. 'P' indicates participant.
| 3-class | 4-class | 6-class | |||||||
|---|---|---|---|---|---|---|---|---|---|
| S1-S2 (%) | S1-S2-S3 (%) | S1-S2-S3-S4 (%) | S1-S (%) | S1-S2-S3 (%) | S1-S2-S3-S4 (%) | S1-S2 (%) | S1-S2-S3 (%) | S1-S2-S3-S4 (%) | |
| P1 | 42.8 | 62.5 | 41.4 | 55.3 | 58.6 | 32.2 | 48.7 | 55.3 | 37.1 |
| P2 | 49.3 | 69.7 | 71.1 | 72.4 | 71.1 | 74.3 | 55.9 | 50 | 68.4 |
| P3 | 46.1 | 51.3 | 53.9 | 46.7 | 41.4 | 46.1 | 34.9 | 39.5 | 33.6 |
| P4 | 54.6 | 46.7 | 53.9 | 61.2 | 58.6 | 48 | 50 | 38.2 | 32.2 |
| P5 | 57.2 | 62.3 | 65.4 | 53.5 | 57.5 | 60.5 | 50.2 | 53.5 | 52 |
| P6 | 41.4 | 42.8 | 42.8 | 37.5 | 40.8 | 35.5 | 34 | 27 | 25.7 |
| P7 | 55.3 | 38.8 | 71.7 | 55.3 | 44.7 | 67.8 | 48 | 32.2 | 46.7 |
| P8 | 54 | 77 | 73 | 46.1 | 65.8 | 61.2 | 32.2 | 40.8 | 46.1 |
| P9 | 68.4 | 73.7 | 53.9 | 58 | 81.6 | 75.7 | 29 | 63.2 | 56.6 |
| Average | 52.1 ± 8.34 | 58.3 ± 13.93 | 58.5 ± 12.2 | 54 ± 9.98 | 57.7 ± 13.86 | 55.7 ± 16.03 | 42.5 ± 9.88 | 44.4 ± 11.79 | 44.2 ± 13.5 |
| Significancelevel | 40 | 38 | 37.11 | 300 | 28.5 | 28 | 20.33 | 19.6 | 18.77 |
For the first recalibration in table 4, the mean classification accuracies (S1 for training; S2 for testing) were 52.1 ± 8.34%, 54 ± 9.98%, and 42.5 ± 9.88% for 3-class, 4-class, and 6-class, respectively (table 4). The maximum classification accuracy was observed for 3-, 4-, and 6-class 68.4% (Participant9), 72.4% (Participant2), and 55.9% (Participant2). The minimum classification accuracy in 3-, 4- and 6-class paradigm was obtained 41.4% (Participant6), 37.5% (Participant6), and 29% (Participant9), respectively.
In the second recalibration in table 4, mean classification accuracies (S1 and S2 for training; S3 for testing) were 58.3 ± 13.93%, 57.7 ± 13.86%, and 44.4 ± 11.79%. The maximum average accuracy was observed for 3-, 4-, and 6-class 77% (Participant8), 81.6% (Participant9), and 63.2% (Participant9), respectively. The minimum classification accuracy in the 3-, 4- and 6-class was obtained for 38.8% (Participant7), 41.4% (Participant3), and 27% (Participant6), respectively.
In the third recalibration in table 4, mean classification accuracies (S1, S2, S3 for training; S4 for testing) were 58.5 ± 12.2, 55.7 ± 16.03, and 44.2 ± 13.5, respectively. The maximum classification accuracy was observed for 3-, 4- and 6-class 71.7% (Participant7), 75.7% (Participant9), and 68.4% (Participant2). The minimum classification accuracy in the 3-, 4- and 6-class was obtained for 41.4% (Participant1), 32.2% (Participant1), and 25.7% (Participant6). ANOVA analysis to test session effect resulted in not significant results for scheme 3 (see table 4) in the recalibration of the classifier (3-class p-value = 0.43; 4-class p-value = 0.83; 6-class p-value = 0.93).
Comparison of recalibration schemes.
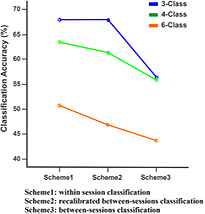
A 3-way ANOVA was used to assess the influence of the three calibration schemes (within session, recalibrated between sessions, and between sessions), classification problems (3-, 4-, and 6-classes), testing sessions, and the interaction between factors (see table 5). As can be seen in table 5, the factors scheme and class had a significant effect on the classification accuracy (Scheme, F = 11.71; p < 0.0001 and class, F = 43.71; p < 0.0001). The factor sessions, as well as all the interactions between factors were not significant. All the post-hoc comparisons can be seen in table 6. For the factor scheme, significant differences were found between Schemes 1 and 3 (i.e. calibration within session versus between sessions, p < 0.0001), and between Schemes 2 and 3 (i.e. recalibrated between sessions versus between sessions, p = 0.001). For the factor classification problem, significant differences were found between the 3-class and 6-class problems (p < 0.0001), and between the 4-class and 6-class problems (p < 0.0001). Figure 4 shows the interaction plot between the two significant factors and the dependent variable (classification accuracy).
Table 5. Results of 3-way ANOVA between the three recalibration schemes. Significant difference was tested for the main factors with recalibration scheme (3 levels: scheme 1, scheme 2, scheme 3), classification problem (3 levels: 3-, 4- and 6-classes), test sessions (3 levels: S2, S3, S4) and interaction factor.
| 3-way ANOVA scheme × class × session | p-value | ||
|---|---|---|---|
| df | F-value | ||
| Class | 2 | 43.71 | p < 0.0001 |
| Scheme | 2 | 11.71 | p < 0.0001 |
| Session | 2 | 0.72 | 0.484 |
| Scheme × class | 4 | 0.88 | 0.475 |
| Scheme × session | 4 | 0.22 | 0.923 |
| Class × session | 4 | 0.17 | 0.951 |
| Scheme × class × session | 8 | 0.08 | 0.999 |
| Error | 216 | ||
Table 6. Results of the multiple comparisons for scheme and class. Significant difference was tested for the calibration schemes pair-wise (scheme 1 versus scheme 2, scheme 1 versus scheme 3, and scheme 2 versus scheme 3) and classification problem pair-wise (3-class versus 4-class, 3-class versus 6-class, 4-class versus 6-classes).
| Scheme | Sch1 Sch2 | Sch1 Sch3 | Sch2 Sch3 |
| p-value | 0.876 | p < 0.0001 |
0.001 |
| Class | 3-class 4-class | 3-class 6-class | 4-class 6-class |
| p-value | 0.130 | p < 0.0001 |
p < 0.0001 |
Figure 4. Classification accuracy of three class combination between three schemes. The graph shows the mean classification accuracy for three classification problem (3-, 4- and 6-classes) between three recalibration schemes (scheme 1: within session classification, scheme 2: recalibrated between sessions, and scheme 3: between-sessions classification).
Download figure:
Standard image High-resolution image
Discussion
In this study, we demonstrated multiclass decoding accuracy above significance level of different reaching movements from the same limb using EEG data. Different number of movements (classes) and recalibration strategies were investigated. We consider a performance level to be acceptable if significant above chance level accuracy and the presented results could serve as a starting point in the context of a neurofeedback-based learning process, in which users learn to adapt their brain activity to control a rehabilitative device.
Firstly, we achieved 3-class classification for two targets (Blue and Red) and rest with an overall accuracy above 69% reaching even 91% in one participant (significance level = 36.5%). Then, we explored the possibility of extending the 3-class to a 4-class (including backward movement to starting position) achieving an overall accuracy above 62% reaching even 86% in one participant (significance level = 28%). After that, we extended the classification problem to a 6-class BCI to discriminate four different movements towards 4 targets (Blue, Red, Green, and Brown), rest, and backwards to the starting position achieving an overall accuracy above 50% reaching even 68% in one participant (significance level = 18.77%). With these results we demonstrate that acceptable decoding can be achieved for even 6 movement classes from the same limb using EEG only. We consider these performances to be acceptable as a starting point in the context of a rehabilitative environment, in which subjects perform a learning process and adapt their brain activity to control a rehabilitative device. The link between oscillatory neuroelectric activity and the movement (proprioceptive feedback) will allow the users to learn to control system improving their performance [2]. Furthermore, there is no need of excellent performance level to induce motor learning and recovery using proprioceptive BMIs as rehabilitation tool in chronic severely paralyzed stroke patients [3], which indeed are the patient population benefiting of the here presented developments.
Finally, we demonstrated that for a real scenario application in which previous data is used to classify different functional movements from the same upper limb, classification accuracy can be maintained if the classifier is trained with previous sessions data and can be significantly enhanced when data from the beginning of each session is added to data from previous sessions to recalibrate/retrain the classifier confirming previous results [49]. These results demonstrate the potential online use of the here proposed classification algorithm to decode up to 6 different movements from the same limb to control a multi degree of freedom rehabilitative devices (i.e. provide ecologically valid neurofeedback).
The brain oscillatory signature of different movements from the same limb can be adequately isolated using FBCSP and the commonly known 'session-to-session-transfer' issue in EEG does not affect the classification accuracy results significantly. However, consistent with other studies [50, 51], our results did not show any significant impact of the amount of previous sessions data used for recallibration or re-training of the classifier on the decoding accuracy.
In this study we used the filter bank common spatial pattern (FBCSP) for feature extraction because it uses frequency filtering with multiple frequency bands, which may help isolating oscillatory activity related to different motor tasks as previously proposed [52]. Decoding accuracy was higher using FBCSP compared to previous work using CSP only [34, 53].
Our results argue in favor of using adaptive methods that constantly adapt the decoder with the current session's data. We successfully applied a recalibration of sessions to specifically address the problem of non-stationarities and the session-transfer problem [54].
Although our results are promising and we achieved overall participants and sessions accuracies in the range of 69%, 62%, and 50% for 3-class, 4-class, and 6-class, respectively improving reported work [18], the control of rehabilitative devices (e.g. robotic orthosis, FES, etc) need higher classification accuracies. However the continuous use of the system might produce some learning effects and accuracies could improve significantly.
Motor execution of reaching movements of the same limb activating muscles at different joints activates regions with very close representation on the motor cortex [28]. This spatial proximity, EEG volume conducting effects, spectral limitations and signal to noise ratio and electrical and neurophysiological artefacts makes classification of such movements more difficult. Furthermore, when attempting to classify very similar movements (reaching neighbor targets green and brown) this problem becomes very challenging, as demonstrated in the confusion matrix of scheme 1 for 6-class being confused for decoding of close targets in the setup.
In the here presented work we report the performance of a BCI using 1 s time windows and 19 EEG electrodes and it has been already shown that the accuracy of classifier increases using longer time window after onset [38] and denser EEG electrodes around the motor cortex [33]. Adding more features such as movement related cortical potential (MRCP) to the proposed system may further improve the performance [30, 32]. Further experimental work is needed to investigate the use of longer time windows, more EEG channels and other new features.
In general, healthy subjects show strong brain activation in the regions contralateral to the moving hand but other areas are being also significantly activated depending on the phase of the movement (planning, onset, execution, cessation) [52]. These cortical activations captured by EEG are affected after any neural lesion (e.g. stroke) and maintaining the classification performance we obtained in healthy participants will be more challenging. Chronic stroke patients show often a more bilateral brain activation when they move their affected hand [3, 55]. These results together with the here presented results in healthy participants suggest the use of bihemispheric EEG activity and FBCSP in order to provide stroke patients with a multi degree of freedom control of rehabilitation or assistive devices.
Further experiments to test the feasibility and efficacy of our approach need to be performed. However, we believe that the here presented results in healthy participants constitute a baseline population, which can be afterwards compared to and used as control group (not age-matched though) for different typologies of patients with different brain alterations, such as stroke and spinal cord injury. From our previous study [2] we know that the link between oscillatory neuroelectric activity and the movement (proprioceptive feedback) allows severely paralyzed stroke patients to learn to control the system improving their performance and inducing motor recovery [3].
In summary, the here presented promising results, constitute the first step towards a multi-directional rehabilitation exoskeleton online control system for severely paralyzed stroke patients
Conclusion
We demonstrated the feasibility of classifying up to 6 functional movements from the same upper limb using EEG data with acceptable levels of accuracy and demonstrated how a classifier trained on previous sessions' data can maintain the classification accuracy demonstrating robustness against session-to-session transfer issues. Furthermore, we demonstrated how retraining the classifier with some data of the current session could significantly increase the classification accuracy.
We demonstrated how FBCSP could help isolate brain oscillatory signatures of different movements of the same limb using their spatiotemporal filters at multiple frequencies and therefore create good features to allow acceptable classification rates to link several DoFs of robotic rehabilitation exoskeletons with brain neuroelectric oscillatory activity.
Acknowledgments
This study was funded by the Baden-Württemberg Stiftung (GRUENS), the Deutsche Forschungsgemeinschaft (DFG, Koselleck and SP-1533/2-1), Bundes Ministerium für Bildung und Forschung BMBF MOTORBIC (FKZ 13GW0053), the fortune-Program of the University of Tübingen (2422-0-0), and AMORSA (FKZ 16SV7754). A Sarasola-Sanz's work is supported by the La Caixa-DAAD scholarship, and N Irastorza-Landa's work by the Basque Government and IKERBASQUE, Basque Foundation for Science.