
Abstract
Objective. Translational studies on motor control and neurological disorders require detailed monitoring of sensorimotor components of natural limb movements in relevant animal models. However, available experimental tools do not provide a sufficiently rich repertoire of behavioral signals. Here, we developed a robotic platform that enables the monitoring of kinematics, interaction forces, and neurophysiological signals during user-defined upper limb tasks for monkeys. Approach. We configured the platform to position instrumented objects in a three-dimensional workspace and provide an interactive dynamic force-field. Main results. We show the relevance of our platform for fundamental and translational studies with three example applications. First, we study the kinematics of natural grasp in response to variable interaction forces. We then show simultaneous and independent encoding of kinematic and forces in single unit intra-cortical recordings from sensorimotor cortical areas. Lastly, we demonstrate the relevance of our platform to develop clinically relevant brain computer interfaces in a kinematically unconstrained motor task. Significance. Our versatile control structure does not depend on the specific robotic arm used and allows for the design and implementation of a variety of tasks that can support both fundamental and translational studies of motor control.
Export citation and abstract BibTeX RIS

Original content from this work may be used under the terms of the Creative Commons Attribution 3.0 licence. Any further distribution of this work must maintain attribution to the author(s) and the title of the work, journal citation and DOI.
1. Introduction
Modern approaches to system neuroscience as well as the study of motor recovery in clinical applications require detailed characterization of sensorimotor neural activity underlying natural, three-dimensional movements rather than artificially constrained behaviours. In this context, an ideal experimental set-up should provide (1) flexible and instrumented workspaces to allow natural, but reproducible motor behaviours and (2) the integration of multimodal electrophysiology recordings and behavioural signals.
However, to date, no experimental set-up allows the integration of electrophysiological recordings with extrinsic signals quantifying natural interactions with the environment.
Indeed, several groups developed sophisticated experimental platforms capable of characterizing unconstrained kinematics but did not provide information on interaction forces (Schwartz et al 1988, Vargas-Irwin et al 2010, Churchland et al 2012, Schaffelhofer and Scherberger 2016, Hu et al 2018, Umeda et al 2019). Conversely, the study of active force control historically focused on constrained tasks in restricted experimental settings, often employing only 1-degree of freedom movements (Cheney and Fetz 1980, Seki et al 2003, Moritz et al 2007, Herter et al 2009, Ethier et al 2012, Nishimura et al 2013). These limitations arise from the difficulty of pairing unconstrained natural movements (Schwartz et al 1988) with instrumented workspaces that allow the execution of active motor tasks (Cheney and Fetz 1980) while measuring force interactions with the surrounding environment.
We believe that functionalized workspaces that promote natural movements could be designed by extending the concept of classical planar robotic tasks (London and Miller 2013, Omrani et al 2016, de Haan et al 2018) to three-dimensional workspaces. Such setup could provide detailed measurement of kinematics and interaction forces throughout actions involving reaching, grasping and manipulation of objects. At the same time, it would enable complete freedom in defining the spatial constraints, force fields and perturbations of tasks that resembles natural, three-dimensional movements.
Here, we present a versatile robotic platform that combines neurophysiological, mechanical, and kinematic measurements within a customizable three-dimensional experimental environment. This platform consists of (1) a seven degrees-of-freedom compliant robotic arm (LBR iiwa, KUKA, Augsburg, Germany) (2) a custom software control package (3) force and grip pressure sensors integrated in the robot and (4) modules for data synchronisation.
To demonstrate the potential of our platform for both basic and translational studies in motor control, we programmed the robotic arm to present instrumented objects to trained monkeys in a three-dimensional workspace and oppose elastic resistance to displacements of the end effector. By pairing this system with intra-cortical neural recordings of sensorimotor areas, we created an instrumented platform that provides a rich portfolio of signals for the investigation of natural motor behaviour.
We trained three monkeys to reach for the robot and pull the end effector to receive a food reward. We first demonstrate the performance and safety of our platform. We then use the platform to study the kinematic and dynamic components of movement and how these vary when applying different strength of dynamic elastic resistance to the target object movement. Third, we show that activity of neurons in both the motor and somatosensory areas encode specific components of the task such as force, kinematics or object contact. Fourth, we argue that our framework can be instrumental to neural engineering studies seeking to decode movement information from motor and sensory areas during natural behaviour.
Our versatile control structure does not depend on the specific robotic arm used and allows for the design and implementation of a variety of tasks that can support both fundamental and translational studies of motor control.
2. Methods
2.1. Robotic platform
Our platform (figure 1) consists of (1) a seven-degrees-of-freedom robotic arm (Intelligent Industrial Work Assistant, IIWA-KUKA, Augsburg, Germany), (2) a custom built software package that enables closed-loop control of the robot arm, (3) a synchronized interaction force recording system, (4) a strain-gauge grip pressure sensor, (5) an infrared video tracking system to measure three-dimensional joint kinematics (Vicon, Oxford, UK) and an (6) electrophysiology system (Blackrock Microsystems, Salt Lake City, USA). We assessed the versatility and efficacy of our framework by programming a robotic task for monkeys. We configured the robot to position objects in a three-dimensional workspace and trained monkeys to reach and pull on the objects while kinetic, kinematic and neural signals were simultaneously recorded.
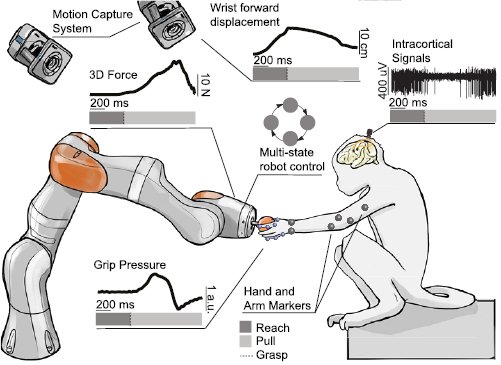
Figure 1. Robotic framework for the study of reaching and grasping. A monkey is implanted with microelectrode arrays in the arm and hand sensorimotor areas. The arrays are connected to a high-resolution electrophysiology system that records wideband extracellular potentials. A robotic arm presents the target objects to the monkey at different positions within a spherical 3D space (figure S1(C)). The animal can interact with the robotic arm by reaching for, grasping and pulling the target objects. A robot control software allows implementation of tasks that proceed through different phases. Each phase can contain different robot behavior. The 3D force applied by the monkey on the robotic joints is measured in real time. The target objects are instrumented with a sensor that measures the applied grip pressure. A motion capture system is used to track the full kinematics of monkey's arm and fingers using reflective markers.
Download figure:
Standard image High-resolution image2.1.1. Closed-loop control infrastructure
The IIWA robotic arm features a large workspace (figure S1) allowing ranges of motion that are compatible with both human and monkey reaches. Additionally, the robotic arm is able to actively lift up to 7 Kg of weight, which makes it robust to manipulation by monkeys.
We developed a software package that implements a real-time closed-loop control (figure 2(A), https://doi.org/10.5281/zenodo.3234138) configured as a finite state machine. This allows fast configuration of tasks that proceed through several phases, where each phase requires a different behaviour of the robot.

Figure 2. The scheme of the robotic arm control protocol and the design of the grip pressure sensor. (A) Finite state machine of the robotic control protocol during the behavioural task. When a trial starts, the robot moves the end effector to a pre-determined position in space using standard impedance joint control strategy. When the position is reached, the finite state machine switches to a custom impedance control mode to allow interaction with the subject (right panel). In this modality, the end effector behaves like a mass-spring-damper system whose parameters are entirely user-defined and can be easily modified.  , = measured position and velocity of the end effector in Cartesian coordinates;
  = derived position and acceleration of the end effector in Cartesian coordinates;
  = derived damping acceleration in Cartesian coordinates;
  = target position, velocity and acceleration in Cartesian coordinates; qt, qt = target position and velocity in the joint space. (B) Top: pressure sensor electronic circuit design describing the electronic components, the communication protocols and the voltage input values. Bottom: schematic of the pressure sensor assembly fixed at the end effector of the robot with spherical, cylindrical and pinch-like objects shown. DAC: digital-to-analog converter—FEA: front-end amplifier—LED: light-emitting diode—SPI: serial peripheral interface.
Download figure:
Standard image High-resolution imageIn our specific example application, at the beginning of an experimental session the robot lies in home position (figure 2(A), FS1), in which all joint coordinates are equal to 0°, resulting in a straight and vertical robotic arm configuration (supplementary figure S1(C) (stacks.iop.org/JNE/17/016004/mmedia)). The robotic arm maintains its position until the user triggers the start of a new trial by pressing a remote button. This brings the robot in a position control phase (figure 2(A), FS2) during which it moves the end effector to a determined position in space.
Once the sum of the errors in the positioning of all the joints decreases to a value of 0.01 radians, the robot is considered in target position and the control mode switches to impedance mode (figure 2(A), FS3). In this state the robot behaves as a mass-spring-damper system, trying to keep the target position while opposing a dynamic resistance to applied forces. In our specific examples we facilitated smooth movements of the end effector along the x-axis (towards the monkey), by imposing higher stiffnesses and damping parameters along the other orthogonal directions.
To interact with our platform we trained three monkeys to grasp a flexible instrumented object connected to the end effector, and pull it until a user-defined-position along the x-axis is crossed. Upon success, the robot quickly updates the next desired target position and moves towards it (figure 2(A), FS4, FS5). If the animal fails to pull the object across the threshold or the trial timeouts, the robot returns to target position. After three failed trials the robot switches to another target.
2.1.2. Omnidirectional measurement of grip strength
We designed an air-pressure-based gauge sensor that can measure the applied grip force independently from an object shape in the interval −0.7 kPa– 40 kPa. We 3D-printed hollow objects of different shape and size (figure 2(B)) and connected to a steel enclosure hosting the sensor. In this configuration the grip strength is proportional to the air flux produced by compression of the object. We designed a programmable electronic circuit (figure 2(B)) that digitizes pressure measurements while power and data transfer are provided through connection ports located at the robot end effector thereby limiting external wires at the subject-robot interface.
The pressure sensor circuit converted air pressure into a voltage measurement using strain-gages (1620 measurement SPECIALTIES™) directly connected to a front-end amplifier (FEA—LMP90100) of a full-Wheatstone bridge circuit. The footprint of the electronic circuit was maximally reduced in order to integrate it to the robot (diameter 3.2 cm). The embedded circuit converts the strain-gages signal into an analog output signal bounded between 0 and 4.1 V. The electronic assembly comprises a microcontroller (pic24FV08KM101) for the control of the FEA and the digital-to-analog converter (DAC8551) via a serial peripheral interface (SPI) protocol. Signals were amplified, digitized at 16 bits, and converted in analog signals after noise reduction. A 5 V regulator (EG113NA-5) adjusted the input power supply from 6 V to 9 V and a second regulator (LM4140ACM-4.1) outputted a precise reference voltage of 4.1 V used for signal conversions. Three LEDs indicated the state of the system and three input switches were used to impose gains ranging from 1 to 64. The in-circuit serial programming (ISCP) connector served to re-program the microcontroller. The system was also equipped from an ON/OFF button, a reset button and a power supply connector. The assembly was mechanically and electrically coupled to the flange of the robotic arm.
The objects were printed in a thermoplastic elastomer and were covered with two layers of silicon (DOWSIL™ and Sil-Poxy®) to ensure sealing. All the sensitive elements were characterized using a computer-controlled compression system (Zwick/Roell 1KN D0728165) to derive the internal pressure of each object as a function of the applied force.
2.2. Animals involved in this study
Three adult female Macaca fascicularis monkeys were trained in this study (Mk-Jo 10 years old, 3.6 kg, Mk-Cs 9 years old 4.0 kg, and Mk-Ol 3 years old 3.0 kg). All procedures were carried out in accordance to the Guide for Care and Use of Laboratory Animals (ISBN 0-309-05377-3; 1996) and the principle of the 3 Rs. Protocols were approved by local veterinary authorities (Canton of Fribourg, Switzerland authorizations No 2017_03_FR and 2017_04E_FR) including the ethical assessment by the local (cantonal) Survey Committee on Animal Experimentation and acceptance by the Federal Veterinary Office (BVET, Bern, Switzerland).
2.2.1. Surgical procedures
All the surgical procedures were performed under full anaesthesia induced with midazolam (0.1 mg kg−1) and ketamine (10 mg kg−1, intramuscular injection) and maintained under continuous intravenous infusion of propofol (5 ml/kg/h) and fentanyl (0.2–1.7 ml/kg/h) using standard aseptic techniques. A certified neurosurgeon (Dr Jocelyne Bloch, CHUV, Lausanne, Switzerland) supervised all the surgical procedures. We implanted two 64-channel microelectrode arrays in Mk-Jo and Mk-Cs and two 48-channel microelectrode arrays in Mk-Ol (Blackrock Microsystems, 400 µm pitch and electrodes tip lengths 1.5 mm and 1 mm for M1 and S1, respectively). Mk-Cs was implanted in M1 and S1 area of the arm, and Mk-Jo and Mk-Ol were implanted in M1 and S1 area of the hand. Functional areas were identified with electrical stimulation delivered as biphasic pulses on the cortex surface at 3 mA and 300 Hz. A 20 mm diameter craniotomy was performed in order to span the brain areas of interest and the dura was incised. Implantation of the arrays was achieved using a pneumatic compressor system (Impactor System, Blackrock Microsystems). The pedestal was fixated to a compliant titanium mesh modelled to fit the skull shape for Mk-Jo and Mk-Cs. The pedestal was fixed directly to the skull in Mk-Ol. Surgical and post-operative care procedure are developed in details in Capogrosso et al (2018). Data presented in this paper were collected 3, 8 and 9 weeks post-implantation for Mk-Jo, Mk-Ol and Mk-Cs, respectively.
2.2.2. Behavioural tasks
We built a custom primate chair (supplementary figure S1) in which only the neck of the animal was fixed with a metallic collar allowing wide range of voluntary arm and hand movements in the three-dimensional space. Two Plexiglas plates were used to restrain the access to the head and a third plate placed around the stomach of the animal served for placing a resting bar and elastic bands to immobilize the right hand. Monkeys were trained to maintain a resting position between trials and place the left hand on the resting bar a few centimetres in the front, at chest level. A trial started when the robot presented a graspable target in front of the animal, at a distance of approximatively 20 cm. As soon as the 'go' cue was played (1 s duration sound), monkeys reached for the target, grasped it, and pulled it towards themselves (x-direction). Once the robot end effector crossed a pre-set virtual spatial threshold (8 cm), a clicker sound played by the experimenter indicated the success of the trial encouraging the animal to release the grip, return to the resting bar and get a food reward. The reward was delivered manually by the experimenter for Mk-Jo and Mk-Cs and automatically for Mk-Ol. The robot returned to its vertical home position at the end of each trial. For Mk-Cs and Mk-Jo, cueing signals during the task were implemented as follow: a go cue was implemented as a high pitch sound coupled to a green light that was played when the robot was in position and reached the impedance control mode; a success cue consisted in a low pitch sound when the monkey crossed the spatial threshold by pulling on the robot. Sounds were played from the application controlling the robot while the light cue was triggered through a synchronisation module (Arduino Due, Arduino, Italy). For Mk-Ol, the visual cues were delivered on a computer screen. A start cue was displayed as a rectangular box on top of the screen. After 500 ms, the start box disappeared and a cursor was displayed on top of the screen with a rectangular target at the bottom. The cursor moved down vertically towards the target, proportionally to the displacement of the robot end effector towards the pre-set spatial threshold. Auditory cues were delivered automatically and consisted in a high pitch start cue, a medium pitch success cue and a low pitch reward cue. Liquid food was delivered together with the reward sound using a pump (masterflex consoledrive) triggered externally via the control software. The screen and the reward system were controlled using an in-house application (Matlab Mathworks®) coupled to a synchronization board (National Instruments, US). All cues were identically delivered during training and experimental sessions.
In Task 1, Mk-Jo reached for, grasp and pull objects of different sizes and shapes all presented at the same location. A cylinder (length 8 cm; diameter 1.5 cm), a small sphere (diameter 1.5 cm) and a large sphere (diameter 3 cm) were used to induce cylindrical, small and wide spherical grips, respectively. CAD design of these objects are available at (https://doi.org/ 10.5281/zenodo.3234138).
Each of these targets were presented with various levels of resistance applied by the robot impedance controller (joint stiffness 200, 400 and 600 N m−1 corresponding to 'low', 'medium' and 'high' stiffness levels). In addition, a small triangular pinch-like object (base 2 cm; height 1.5 cm) was used to prompt a lateral precision grip and was presented with the lowest level of resistance. Each session consisted in 12 to 20 trials per object per level of resistance. Two to four objects were presented during a single session.
In Task 2, Mk-Cs performed 3D centered-out task where the small spherical object was alternatively and randomly presented in three horizontal positions in the sagittal plane, center, left and right. The object was placed at −40, 0 and 60 mm along the y -axis for the left, center and right position, respectively. The z distance was fixed for all conditions at approximately 180 mm above the animal seating height. Each session consisted in approximately 25 trials per position. Mk-Ol performed both Task 1 and Task 2. In Task 2, the left and right targets were placed approximately 3 cm higher than the central target along the z-coordinate. Each session consisted in at least 80 or 70 trials per condition, for position or object, respectively.
2.3. Multimodal recordings
2.3.1. Kinematic recordings
Three-dimensional spatial coordinates of arm and hand joints during upper limb movements were acquired using a 14-camera motion tracking system (figure 1, Vicon Motion Systems, Oxford, UK) at a 100 Hz-frame rate. The video system tracked the Cartesian position of up to 15 infrared reflective markers (6–9 mm in diameter each, Vicon Motion Systems, Oxford, UK). For each monkey, one marker was placed directly below the shoulder, three on the elbow (proximal, medial and distal) and two were placed on the wrist (lateral and medial) using elastic bands. For Mk-Jo and Mk-Ol, nine additional markers were positioned on the back of a customized viscose glove, on the metacarpal (MCP), proximal (PIP) and distal phalanxes (DIP) joints of the thumb, index and little finger (supplementary figure S2(A)). A model of each subject's marker placement was calibrated in Vicon's Nexus software.
2.3.2. Pulling force recordings
The interaction force, measured as the force applied at the robotic joints, was sampled at 500 Hz and synchronized with triggers marking the beginning (go cue) and the end (spatial threshold crossing) of each trial together with the spatial position of the end effector. Values were also streamed in the BlackRock system using the single-board microcontroller. The pressure sensor signal was sampled at 1000 Hz with the VICON and Blackrock systems.
2.3.3. Electrophysiology recordings
Neural signals were acquired with a Neural Signal Processor (Blackrock Microsystems, USA) using the Cereplex-E headstage with a sampling frequency of 30 kHz.
2.4. Data analysis
2.4.1. System performances characterization
We evaluated the safety and usability of the robotic platform accuracy of positioning, stability of position over time and repeatability of behaviour across sessions (see section results).
We continuously recorded the three-dimensional position of the robot arm end effector, together with the three-dimensional force exerted on the object. We computed a positioning error, a time for the robot arm to converge on the target position (target positioning time) and a drop error (figure 3(A)). The precision error was computed as the distance between the targeted end effector position and the reached endpoint position, therefore illustrating the reproducibility of the robotic arm across trials. Since joint stiffness values influence the speed of the motion and the speed of convergence toward the commanded position we evaluated the variation of position error for several joint stiffness values ranging from 200 to 800 N m−1. In addition, we enclosed the variation of the time needed for convergence toward the commanded position (time for target positioning). The drop error was computed as the three-dimensional drift of the end effector from the target position during the first 500 ms after placement, illustrating the stability of the robotic arm in holding the object in the target position. Subsequently, we verified the compliance of the robot movement upon interaction with a monkey previously trained to perform Task 2. We recorded three-dimensional coordinates of the joints and then computed a trajectory smoothness index (Hans-Leo Teulings et al 1997) computed as:
where p is the end effector position, N is the number of samples considered for the measure, t is the time, T and L represents the total duration of the trajectory in seconds and the length of the trajectory in m, respectively. We computed a separated smoothness index over the reach and the pull.

Figure 3. Evaluation of the system performances: (A) graphical representation of the measures of reproducibility of the three-dimensional positioning. The positioning error is the distance between the set and measured robot end effector position; the drop error is the distance between the measured robot end effector position at the cue-time and the measured robot endpoint position 0.5 s after the cue-time. (B) Left: accepted positioning tolerance for different values of joint stiffness. Center: time of convergence toward target for different values of joint stiffness (* p < 0.01). Right: standard deviation of positioning error on the x, y and z dimension for different values of joint stiffness. (C) Positioning error values as a function of the distance from the center of the robot workspace. Linear regression α = −0.009, RMSE = 0.05. (D) Drop error on the x, y and z dimension. (E) Maximal force exerted on the robot end effector on the x, y and z axis. Comparison across 2 different sessions. (F) Comparison of trajectory smoothness values during the reach (robot not interacting with the subject) and pull (robot is interacting with the subject). Data presented here were collected over 2 sessions of n = 100 trials each. (G) Left: example of Mk-Jo wrist cartesian position and velocity along the x axis for three different levels of robotic joint resistance. Right: maximal wrist speed during the reach and pull phases of the movement for three levels of joint resistances (n = 10 measurements per condition). For each joint resistance, the peak reaching speed was significantly higher than the peak pulling speed. Wilcoxon rank-sum test, p 200 = p 400 = p 600 = 1.8 × 10⁻⁴. The pulling peak speed was also significantly larger at 200 N m−1 resistance than at 600 N m−1 resistance (Kruskal–Wallis test,  = 10.72, p = 0.005). (H) Left: example of force-deformation relationship for each object during five calibration rounds at 5 N. Right: calibration curves describing the voltage to pressure relationship for each object geometry before and after 1000 squeeze movements (n = 3 measurements per point). The horizontal standard deviations represent the error on the voltage measurement for forces ranging from 1 to 10 N.
Download figure:
Standard image High-resolution imageWe analyzed the movement velocity by computing the maximum wrist speed during the reaching and pulling phase separately. We derived the wrist speed from the wrist kinematics of Mk-Jo using the cylinder for three levels of robotic joint resistances (200 N m−1, 400 N m−1 and 600 N m−1).
All the grip pressure sensor-coupled objects were characterized using a computer-controlled compression system (Zwick/Roell 1KN D0728165) to derive the internal pressure of each object as a function of the applied force in Netwon. Calibration curves were acquired by applying dynamically load ranging from 0 to 10 N on each object.
2.4.2. Analysis of arm and hand dynamics
Post processing of motion capture data was performed to ensure that all joint markers were labelled correctly. We converted the three-dimensional marker position data to rotational degrees of freedom. For Mk-Jo and Mk-Ol, we computed 12 joint angles (see figure S2): index finger PIP flexion/extension, pinkie finger PIP flexion/extension, thumb finger PIP flexion/extension, index finger MCP flexion/extension, pinkie finger MCP flexion/extension, thumb finger MCP flexion/extension, index finger abduction/adduction, pinkie finger abduction/adduction, thumb finger abduction/adduction, thumb opposition, wrist flexion, wrist ulnar deviation. For Mk-Cs, we computed 3 joint angles: shoulder adduction, elbow flexion/extension angle and wrist pronation/supination. Interaction force measurements were synchronized post-hoc to kinematics signals based on triggers marking the start (go cue) and end (threshold crossing) of each trial. For further analysis of arm and hand dynamics during natural reaching and grasping, we averaged the mesurements across each condition. Kinematics, force and grip pressure measurements were low-pass filtered at 10 Hz.
Principal component analysis (PCA) was performed on joint angle kinematics and kinetic variables to identify which dynamic features accounted for most of the variance in the data. We reconstructed the Y × Ndf matrix where Ndf is the number of joint angles and Y = [Y1, Y2,..., YN] is the concatenated vector of all time points t = 1,..., N. Average kinematic, force and pressure variables were normalized and mean-centered before singular values decomposition. The dynamic data projected along the first three eigenvectors in the PC space were averaged over each condition and smoothed using a 5-samples moving average filter before plotting.
2.4.3. Analysis of kinematic synergies
We used PCA, as described in Santello et al (1998) to identify kinematic synergies as orthogonal axes of maximal correlated variance in the 3D joint coordinates of the hand. Briefly, the x, y and z joints Cartesian coordinates were first normalized and mean-centered. The principal components (PCs) were then computed from the eigenvalues and eigenvectors of the matrix of the covariance coefficients between each of the joint coordinates waveforms. As each of the 13 markers was represented by three coordinates, the PCA was computed over 39 waveforms. The first PC accounted for at least 70% of the variance. We represented the hand posture corresponding to the first synergy by plotting the 39 coefficients corresponding to the first PC in 3D (Mason et al 2001) and overlaid a sketch of a monkey hand for the sake of representation. The positions of the ring finger and middle finger were not measured in our experiment but were represented in a realistic inferred position with respect to the thumb index and pinkie to help visualize the hand posture in supplementary figure S2(D).
2.4.4. Multiunit activity analysis during skilled grasping and 3D reaching
We acquired the multiunit spiking activity from each channel of intracortical neural recordings (2 × 64 channels for Mk-Cs and Mk-Jo, 2 × 48 channels for Mk-Ol) using the Neural Signal Processor (Capogrosso et al 2016). Specifically, a spiking event was defined on each channel if the band-pass filtered signal (250 Hz–5 kHz) exceeded 3.0–3.5 times its root-mean-square value calculated over a period of 5 s. Artefacts removal was achieved by eliminating all the spikes occurring within a time window of 0.5 ms after a spike event in at least 30 channels. We computed the firing rate of each channel as the number of spikes detected over non-overlapping bins of 10 ms.
In order to perform a neural population analysis, we identified a neural manifold (Gallego et al 2017) by conducting PCA on multi-unit firing rates ranging from movement onset to the end of the pulling phase. Movement onset happened in average 660 ms, 910 ms and 520 ms before the grasp for Mk-Jo, Mk-Cs and Mk-Ol, respectively. The pulling phase lasted at least 350 ms, 740 ms and 370 ms for Mk Jo, Mk-Cs and Mk-Ol, respectively. Events marking movement onset, grasp onset and release of the object were identified using video recordings. Neural features for M1 and S1 consisted in the firing rates computed over all intracortical neural channels of each array (64 channels for Mk-Cs and Mk-Jo, 48 channels for Mk-Ol). PCs were computed using at least 15 trials per object and 25 trials per position in Mk-Jo and Mk-Cs, respectively. In Mk-Ol, principal components during the objects-grasping task were computed using 70 trials per object (supplementary figure S3).
2.4.5. Neural encoding analysis
We manually spike-sorted the recordings from each electrode implanted in M1 and S1. We computed the average firing rate across the entire reach for each neuron to compare the two brain areas (figure 7(a)). Additionally, we inspected the tuning for each parameter by plotting the firing rate in each bin against the hand velocity and the magnitude of pulling force recorded at each time (figure 7(b)).
We then constructed encoding models to predict the spiking of each neuron using Generalized Linear Models (GLMs), adapting an analysis previously described by Lawlor et al (2018) and Perich et al (2018). First, we counted the number of spikes in non-overlapping 10 ms bins. In brief, GLMs generalize the idea of multilinear regression for non-Gaussian statistical distributions using a nonlinear link function. The neurons were assumed to have Poisson statistics, thus we used an exponential link function (Lawlor et al 2018). As inputs to the GLMs we provided: (1) full-limb kinematics, including the three-dimensional velocities and accelerations of the shoulder, elbow, and wrist; (2) three-dimensional pulling force applied to the robot by the monkey; (3) the time of the grab event, to capture either motor commands related to hand shaping or sensory feedback from the object contact. For the third input, the grab event was convolved with three raised cosine basis functions (Pillow et al 2008) spaced evenly up to 300 ms in the past or future for M1 and S1, respectively.
We quantified the performance of the GLMs using a pseudo-R2 metric, which generalizes the notion of variance explained for the Poisson statistics of the model (Lawlor et al 2018, Perich et al 2018). This metric compares the log-likelihood of the tested model fit against a simpler model.
Typically, the simpler model  is a mean-fit to the data. However, this formulation also allows us to test the relative contributions of different parameters. We compared the full model with all three types of inputs described above to a reduced model
  where just one of the inputs is omitted. This relative pseudo-R2 metric provides insights into how well specific parameters, such as object contact, helps to explain neural activity. We assessed significance for all of these using a Monte Carlo simulation resampling across the available trials. A model fit or parameter was assumed to be significant if the 95% confidence intervals on the parameter fit were greater than zero.
2.4.6. Detection of movement onset and object grasp from the sensorimotor neural activity
We implemented an approach based on a multiclass regularized linear discriminant analysis algorithm (mrLDA) to detect moments of movement onset and object grasp from the continuous neural recordings from either the motor or somatosensory cortices (Milekovic et al 2013a, Capogrosso et al 2016, Milekovic et al 2018). In brief, we synchronized the multiunit spike activity with the movement onset and object grasp events. The performance of decoders was evaluated using five-fold cross-validation (Hastie et al 2009). The movement onset and object grasp events, mo and og, were used to derive the respective classes of neural features, Cmo and Cog:
where  and
and  are feature vector members of classes Cmo and Cog, respectively; NTP is the number of multiunit spike rate measurements taken from the same neural channel; Δt is the temporal difference between the two consecutive spike rate measurements taken from the same neural channel; NCH = 64 is the number of neural channels; and Δtmo and Δtog are the temporal offsets for each type of event. NTP, NTP · Δt (history used to sample neural features), Δtmo and Δtog were used as decoder parameters—their values were selected from a following list of values: NTP: 3 and 5; NTP · Δt: 0.3 s and 0.5 s; Δtmo and Δtog: any value from −200 ms to 200 ms with 0.5 ms steps. We additionally formed another class COTHER representing states at least 10 ms away from all mo and og events.
We then calibrated a set of mrLDA decoding models using Cmo, Cog and COTHER and all possible combinations of parameter values (Milekovic et al 2013a, Capogrosso et al 2016, Milekovic et al 2018). We used the mrLDA regularization parameter as an additional parameter with values of 0, 0.001, 0.1, 0.3, 0.5, 0.7, 0.9 and 0.99. The performance of each of the models was validated using four-fold crossvalidation on the training dataset as follows. A model was calibrated on three quarters of the training dataset and tested on the remaining part of the training dataset. For each time point of this remaining part, the mrLDA model calculated the probability of observing neural activity belonging to Cmo and Cog classes. When one of these two probabilities crossed a threshold of 0.9, the decoder detected movement onset or object grasp, moDET or ogDET, respectively. To reproduce the sparsity of these events, we ignored the probability values of the detected event for 1 s after the detection. We pooled the time series of actual and detected events across all four folds and calculated normalized mutual information using a tolerance window of 200 ms (Milekovic et al 2013a, Capogrosso et al 2016, Milekovic et al 2018). We then calibrated another decoding model on the left-out testing dataset using the parameter values that resulted with the maximum normalized mutual information. This decoder was then used on the testing part of the dataset to detect the moDET or ogDET events. We again pooled actual and detected events across all five testing folds and measured the decoding performance using temporal accuracy—the ratio of actual events that have one and only one event of the same type within the 200 ms neighbourhood. We estimated the standard error of the temporal accuracy using bootstrapping with 10 000 resamples (Moore et al 2009).
2.4.7. Time-resolved classification of grasp types and trajectories
We applied a similar approach to classify grasp types (Mk-Jo) and reach target locations (Mk-Cs) using mrLDA from the neural recordings from either the motor or somatosensory cortex (Milekovic et al 2015). We measured the classification performance using leave-one-out cross-validation (Hastie et al 2009)—in each validation fold ('e'), a different trial e is selected as a test dataset and all other trials are used as a training dataset to calibrate a mrLDA model. This calibration involves a procedure to select the regularization parameter of the mrLDA model from the values of 0, 0.001, 0.1, 0.3, 0.5, 0.7, 0.9 and 0.99. The training dataset is used to derive the classes of neural features, C1(e,t), ..., CN(e,t) (N = 4 for four objects in Mk-Jo, and N = 3 object positions for Mk-Cs) as described above for event timing using leave-one-out validation on the training dataset. We then calibrated a mrLDA classifier on the complete testing dataset using the regularization coefficient that resulted with the maximum decoding accuracy. We pooled the classification outcomes across all folds and measured the decoding accuracy. This procedure resulted in a confusion matrix and decoding accuracy value for every value of the latency t around both movement onset and object grasp events. We estimated the standard error of the decoding accuracy using bootstrapping with 10 000 resamples (Moore et al 2009).
2.4.8. Kalman filter decoding
We assessed continuous predictions of limb kinematics using a Kalman Filter (Wu et al 2006). The Kalman Filter provides a probabilistic framework to predict the state of the limb during the reach and grasp task based on the neural recordings. The output of the filter was the state of the limb. For Mk-Cs, this comprised the position and speed of the elbow and wrist. For Mk-Jo, it comprised the position and speed of the thumb, index and pinkie finger joints (distal phalanx, PIP joint and MCP joint), as well as of the wrist, elbow and shoulder joints. We computed the limb kinematics and the instantaneous firing rate of each neuron at 50 ms intervals. We used the multiunit firing rate obtained from thresholding on M1 and S1 arrays as inputs to the decoder. The neural signals were shifted relative to the kinematics by a static value of 100 ms in Mk-Cs and 70 ms in Mk-Jo. These lags were determined by testing the models on various delays to optimize the model performance. We trained and tested the models using the leave-one out cross-validation method: we iteratively set aside one trial for testing and trained the model using the remaining trials. We pulled together kinematic and neural data over different objects (small sphere and large sphere) for Mk-Jo and over different positions (left, center and right) for Mk-Cs. The performance was assessed using the coefficient of determination R2 for which we computed the 95% confidence intervals across all repetitions. 3D static hand posture reconstruction represents hand configuration for the best time point of the fold resulting in the highest average R2 for both the small sphere and the cylinder objects in Mk-Jo.
2.5. Statistics
All computed parameters were quantified and compared between tested groups unless otherwise specified. All data are reported as mean ± SEM unless specified otherwise. Significance was analysed using non-parametric Monte-Carlo permutation test and Wilcoxon rank-sum test followed by post-hoc correction for multiple comparison.
2.6. Data and software availability
The custom-built open-source software application used to control the robotic arm and a step-by-step implementation protocol are available at (https://doi.org/10.5281/zenodo.3234138). Further data from this study are available from the corresponding author upon reasonable request.
3. Results
3.1. System performance
In order to assess the performances of the robotic platform, we ran a series of tests aiming at computing the spatial accuracy of positioning, stability of position over time and repeatability of behaviour across sessions (figure 2(A), Video 1).
We evaluated the spatial accuracy by measuring the positioning error—the distance between the target position and the actual position reached by the robot (figure 3(A)). To evaluate the speed of positioning, we measured the target positioning time—time needed for the robot to move the end effector to the target position. We measured the positioning error and the target positioning time for different joint stiffness values. To evaluate the stability of the robot to hold a specified position over time, we measured the drop error (figure 3(A)). For a stiffness of 200 N m−1 (the typical value used during experimental sessions), the mean positioning errors were 0.186, −0.133 and 0.008 mm for the x, y and z directions with standard deviation of 7, 6 and 13 mm, respectively. We considered these errors acceptable for our experimental demonstrations. Nonetheless, the positioning errors and the target positioning time decreased with increasing stiffness values (figure 3(B)). This shows that it is possible to obtain a higher positioning precision by accepting a higher joint stiffness during motion. Our analysis revealed no relationship between positioning error and end effector spatial location (figure 3(C)). Similarly, drop errors (figure 3(D)) were uniform across space (1.0 ± 1.8 mm, 0.8 ± 2.2 mm and 2.1 ± 0.3 mm for the x, y , and z direction). Measured forces were consistent across sessions (n = 2 sessions) (figure 3(E)).
We next evaluated the robot compliance upon interaction with a monkey. In particular, we verified that passive movements of the end effector did not introduce sudden and unexpected perturbations of the arm kinematic trajectories when pulling on the object.
We measured arm joint kinematics in Mk-Cs performing a reach-and-pull task (figure 1) in different directions and computed the smoothness index (Hans-Leo Teulings et al 1997) of arm joints and end effector trajectories during the reaching and the pulling phase separately. The smoothness during the pulling phase was comparable to that computed in the reaching phase suggesting that the robot did not perturbate the dynamics of natural arm movements (figure 3(F)).
We then computed the maximum wrist speed during the reaching and pulling phase in Mk-Jo performing a reach-and-pull task at different stiffness levels (figure 3(G)). Our results show than for every stiffness level, the maximal hand speed was significantly lower when interacting with the object than during the reaching phase. In addition, higher stiffness resulted in lower pulling speed. Taken together, these results show that our robotic platform can be used to apply loads while remaining compliant to upper-limb movements.
Finally, we characterized the force-to-voltage relationship of the grip pressure sensor for different object geometries. Calibration curves showed that spherical and cylindrical objects exhibit a non-linear force-to-voltage behaviour while the pinch-like geometry displayed a linear behaviour (figure 3(H)). We demonstrated that the force-to-voltage relationship remained stable after 1000 squeezes (figure 3(H)).
3.2. Applications to basic and translational studies
We investigated the kinematic, kinetic and neural components of natural three-dimensional reaching, grasping and pulling behaviour in monkeys. Three adult Macaca fascicularis female monkeys (Mk-Jo, Mk-Cs and Mk-Ol) were implanted with a pair of microelectrode arrays (Blackrock Microsystems, Salt Lake City, UT, USA). The arrays were placed in the hand and arm area of the right primary motor (M1) and right primary somatosensory (S1, area 1/2) cortices (Pons et al 1985, London and Miller 2013) (figure 4(A)). Brain signals were synchronized to interaction forces, grip pressure and arm and hand kinematics. We implemented two tasks. In both, the animal reached freely towards an object, performed a specific grasp, and compensated for the dynamic resistance applied by the robot to pull the object across a virtual border. In Task 1, the monkey reached for four objects of different shapes: a small sphere, a large sphere, a cylinder, and a 'pinch' object. Each object encouraged the animal to use a specific grasp: three finger grip (small sphere), whole hand grip (large sphere), two-finger precision grip (pinch), and power grip (cylinder) (figures 2(B), 4(B) and 5(A)). The objects were presented at the same position. The joint impedance varied across 'low', 'medium' and 'high' level of resistance to object displacement. In Task 2, the monkey reached for the small sphere presented at different positions in space ('central', 'left', or 'right', figure 4(C)).
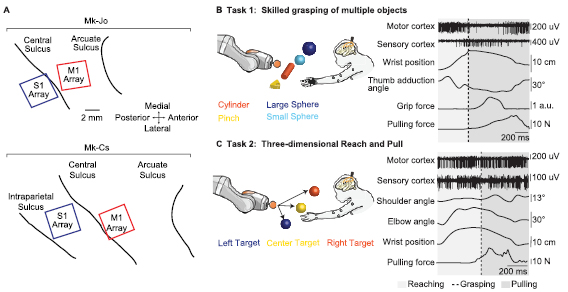
Figure 4. Multimodal electrophysiology during unconstrained reaching and grasping. (A) Utah arrays placement for Mk-Jo and Mk-Cs. Each animal received two arrays of 64 channels. M1 hand and arm areas where identified in Mk-Jo and Mk-Cs, respectively, through intra-operative electrical stimulation. (B) Schematic of a skilled grasping task during which the monkey had to reach for different types of object and pull them towards a pre-determined spatial threshold. (C) Schematic of the 3D reaching task during which the monkey had to reach for an object placed at different positions in space and pull it towards a pre-determined spatial threshold. Examples of synchronous multiunit neural recordings, hand and arm kinematics, grip pressure and pulling force recordings are shown on the right for both tasks.
Download figure:
Standard image High-resolution image
Figure 5. Arm and hand dynamics during natural reaching and grasping. (A) Examples of kinematic and kinetic variables for three different objects (n = 15 trials per object, one recording session). 3D hand configuration is shown on top for each object. (B) Example of normalized pulling force and grip pressure obtained for three levels of resistance when pulling on the large spherical object (n = 10 trials per resistance condition, one recording session). The box-plots show the median, the 1.96 SEM and the STD of the pulling force area under the curve (AUC) during the movement (n = 30 trials per condition, three recording sessions). Data were normalized by the maximal pulling force measured within each session. Increase in resistance had a significant effect on the pulling force impulse (Kruskal–Wallis, p < 0.001 with post hoc correction, * p low-med < 0.05, *** p low-high < 0.001, *** p med-high < 0.001). Correlation analysis between the grip pressure and the pulling force impulses (AUC) revealed a linear correlation between these two variables (R2 = 0.5 and p value = 1.6 × 10⁻¹⁶, n = 30 trials per condition, three recording sessions). (C) Principal component analysis of the kinematic and kinetic components of the movement for the three levels of mechanical resistances (n = 10 trials per condition, large sphere object, one recording session). The color-coded representation of factor loadings identifies variables that contributed most to the differences observed between the difference levels of resistance. (D) Top panel: postural kinematic synergy defined by the first principal component. Bottom panel: time course activation of the first PC averaged over trials shows modulation for high level of resistance compared to low and medium resistances, indicating a change in kinematic grasping strategy to overcome increased levels of resistance (n = 10 trials per condition, large sphere object, one recording session). (E) Examples of kinematic and dynamic variables for 3D reaching towards different spatial targets (n = 25 trials per position, one recording session). Joint kinematics angles, three dimensional pulling force and wrist trajectories are shown for the left, center and right position. Stick diagram depicts evolution of the arm joint angles for the three conditions while maxima pulling force is represented as 3D vectors. Thick stroke arrows represents the average maximal force value. Wrist trajectories are also plotted in 3D. (F) Principal component analysis of the kinematic and kinetic components of the movement reveals partial overlapping of the movement performed to reach the three different target positions (n = 25 trials per position, one recording session). Color-coded representation of factor loadings identifies the x and y components of the pulling force as the most meaningful features for the first PC while the wrist and elbow joints associate with high loadings in the second and third PC, respectively. Thicker lines represents the data mean while shaded areas depicts the SEM.
Download figure:
Standard image High-resolution image3.3. Arm and hand dynamics during natural reaching and grasping
We first explored how kinematic and kinetic components of movement varied during natural reach and grasp paradigms, and how these evolved under different levels of resistance. The animal adapted the hand configuration according to the selected objects (figures 5(A) and S3(B)). Fingers joint angles showed closer motor patterns for the small and large sphere than for the cylindrical object. Interestingly, average grip pressure was larger for the small spherical grip than for the other objects, presumably because strong grip was required to compensate for the small surface of hand contact. Grasping pressure and pulling forces increased in response to an increase in resistance (figures 5(B) and S3(B)), indeed during pulling grip pressure was linearly correlated to pulling force (figure 5(B), R2 = 0.5). We performed a principal component analysis (PCA) of kinetic and kinematic features of grasping. This analysis revealed that grasping features evolved over well clustered smooth trajectories for different resistance levels during movement (figures 5(C) and S2(C)).
The two leading principal components showed strong correlations to finger joint kinematic features, as well as kinetic features (figure 5(C)). This suggested that the monkey adapted its kinematic strategy to overcome higher resistances. To verify this hypothesis, we extracted kinematic synergies (Santello et al 1998, Mason et al 2001) (figures 5(D) and S2(D)). We found that the activation of the main synergy (first component, 70% of variance for all objects figures 5(D) and S2(D)) changed across resistance levels for spherical objects, but not for the cylinder (figures 5(D) and S2(D)). This suggests that the monkey adapted the grasping strategy to execute higher force levels. In the case of the cylindrical grip, the monkey overcame large resistance levels by generating stronger puling torque without substantial change in his grip pattern.
We then inspected kinematic behaviour for different spatial targets in Task 2 (figures 5(E), S3(D) and (E)). Joint angles showed reproducible patterns across trials, even if the animal was not trained to follow a specific strategy and was free to reach the object without time or spatial constraints. In Mk-Cs, joint angles and hand trajectory along the x and z direction showed a similar trend across the different positions (figure 5(E)). In Mk-Ol, since the lateral targets were located higher than the central target along the z direction, hand trajectories as well as wrist position showed variations along the y and the z coordinate (figure S3(D)). In both Mk-Cs and Mk-Ol, forces along the pulling direction were similar across all the target positions, confirming that the effort needed to pull the robot end effector past the threshold on the x-axis was proportional to the end effector displacement from the target position. Forces along the y -axis were markedly different, suggesting that the monkey always displaced the end effector towards its body center when pulling.
Projections in the PC space formed smooth and separated trajectories that spanned the three-dimensional manifold defined by first PCs (figure 5(F)). Most of the variance was explained by the force exerted in the y direction as suggested by the pulling force profiles (figure 5(E)).
3.4. Sensorimotor neural dynamics during natural reaching and pulling
We then used our robotic framework to study the neural activity in M1 and S1 during natural reaching and grasping. Nearly all channels showed high modulation of multi-unit firing rates for both sensory and motor areas in all monkeys (figures 6(A), (C), S3(A) and (C)). Interestingly, activity arising from the arm somatosensory area (Mk-Cs) was strongly modulated during the whole movement while the largest response in the somatosensory area of the hand (Mk-Jo and Mk-OL) occurred shortly following the grasp (figure 6(A)).

Figure 6. Sensorimotor neural dynamics during unconstrained reaching and pulling. (A) Averaged synchronized neural, kinematic and dynamic signals collected during skilled grasping of four different objects (Mk-Jo, n = 15 trials per object, one recording session). The dashed line identifies the onset of the grasp. Signals were averaged before the grasp over the mean reaching phase duration and after the grasp up to the minimum pulling phase duration. Brain signals were binned over 10 ms time window, normalized for each channel and sorted in ascending order of time of maximal firing rate. The reference condition for aligning neural signals is the large sphere for task 1. (B) Principal component analysis of the kinematic, motor and sensory neural components of the movement reveal clustering of the four different types of object geometry along the three first PCs in each the cortical and kinematic PC spaces (Mk-Jo, n = 15 trials per object, one recording session). (C) Averaged synchronized neural, dynamic and kinematic signals during the execution of the task 2 for three different spatial targets. Signals were processed identically to task 1 (Mk-Cs, n = 25 trials per position, one recording session). The reference condition for aligning neural signals is the central target for task 2. (D) Principal component analysis of the kinematic, motor and sensory neural components of the movement for the three different object positions (Mk-Cs, n = 25 trials per position, one recording session) show overlapping trajectories for the three targets in the neural PC space and dissociated trajectories in the kinematics PC space.
Download figure:
Standard image High-resolution imageWe then identified a neural manifold (Gallego et al 2017) from the multi-unit activity of each brain area and compared the trajectories to those of the kinematics (figures 6(A), (C) and S3(B)). In Task 1, both M1 and S1 showed smooth curves that segregate for different object shapes. The trajectories corresponding to similar objects were found to be very close in the PC space for both kinematic and neural features. In Task 2 instead, trajectories in the kinematic manifold showed distinct paths for different positions in space (figures 6(B) and (D)), while neural manifolds displayed very similar trajectories for different positions suggesting a common neural basis for reaching and pulling in both motor and sensory areas.
3.5. Single unit encoding of multimodal motor and sensory information
We then exploited the capabilities of our framework to dissect the role of kinematic, kinetic or sensory events on the firing patterns of single units. We manually sorted M1 and S1 recordings to identify well-isolated single units. During the task, firing rates in M1 were typically higher than in S1 (figure 7(A)). By design, the pulling force applied by the monkey correlated with the negative (towards the body) hand velocity of the pull (figure 7(B)). We first asked whether this interaction between limb kinematics and object dynamics could be observed at the single neuron level. We then plotted the firing patterns of single neurons against force and velocity variables and observed diverse and complex tuning for hand velocity and pulling force in both M1 (figure 7(C)) and S1 (figure 7(D)). While some cells showed apparent tuning for specific features (figures 7(C) top and (D) top likely modulate only with pulling force) others showed a more complex interaction of these features (e.g. figure 7(D), bottom, modulates with both hand velocity and pulling force).

Figure 7. Single unit encoding of multimodal motor and sensory information. (A) Each histogram shows the peak firing rate across all trials (one session per animal) for the populations of sorted neurons from M1 (red) and S1 (blue). On average, M1 firing rates were slightly higher than S1 (9.5 Hz compared to 6.4 Hz; p < 0.001, Student's t-test). (B) Hand velocity against pulling force for all trials from Mk-Cs. Each dot represents a single time point (sampled at 10 ms intervals). Since the pulling phase was loaded, the pulling force strongly correlates with negative hand velocity. (C) Example tuning for three M1 cells plotting firing rate against the hand velocity (left column) and pulling for (right column). Insets show 100 randomly drawn spike waveforms (scale bar indicates 100 μV). Due to the interplay between kinematics and force during the object interaction, we observed very complex tuning for the different cells. The top cell, for example, correlates with pulling force, whereas the middle cell appears to correlate with both force and kinematics. (D) Three example cells from S1, presented as in panel (C). (E) We used GLMs to assess whether neural activity is explained by limb kinematics, pulling force, or object contact events. Example predictions for one cell is shown comparing a model with kinematics and force (gray) against the full model (black). The black model better captures the burst of spikes following object contact. (F) The distribution of pseudo-R2 values for the full model across all M1 and S1 cells in Mk-Cs (solid) and Mk-Jo (hollow). (G) The relative pseudo-R2 metric captures the contribution of each parameter to the full model fit. Most cells were predominantly explained by limb movements, but there remains a substantial effect of pulling force and object contact. (H) The percentage of cells that were significantly described (p < 0.05, bootstrap test; see methods) by each of the parameters. All cells were significantly predicted by kinematics, though many also were significantly explained by object contact and pulling force.
Download figure:
Standard image High-resolution imageWe next sought to quantify the influence of these behavioural covariates on each spike train using an encoding model of neural activity. We constructed generalized linear models (GLMs) (Pillow et al 2008, Perich et al 2018) to predict the spiking activity of the individual neurons based on numerous behavioural and environment signals including limb kinematics, pulling force, and object contact events reflecting the possibility for cutaneous sensory input (figure 7(E)) at object contact. The GLMs predicted the probability of observing an individual spike train. We found that the majority of cells in both M1 and S1 could be significantly predicted using this model (figure 7(F)), with similar performance for both areas. By computing a relative pseudo-R2 metric, which compares the performance of the full model to a reduced model which omits specific variables (see methods), we quantified the unique contribution of each specific set of variables on the model performance (figure 7(G)). We found limb kinematics to be the dominant explanatory variable, reflecting the gross modulation of neural activity throughout the reach. Yet, a significant portion of neural spiking could also be explained by the three-dimensional pulling force or the time of object contact. For both monkeys, approximately 16% of S1 neurons were significantly explained by the precise object contact independently of other variables (figure 7(H)). Across the population of neurons recorded from the M1 arm area Mk-Cs, 24% of neurons were significantly explained by pulling force, yet we found very little force information in the hand-area M1 neurons recorded from Mk-Jo.
3.6. Discrete and continuous decoding of movement kinematics
Finally, we sought to demonstrate the relevance of our framework to neural engineering applications. For this, we evaluated the ability to decode discrete and continuous features of natural movement using tools widely employed in studies of brain computer interfaces (Velliste et al 2008, Fitzsimmons et al 2009, Vargas-Irwin et al 2010, Ethier et al 2012, Nishimura et al 2013, Capogrosso et al 2016, Hu et al 2018).
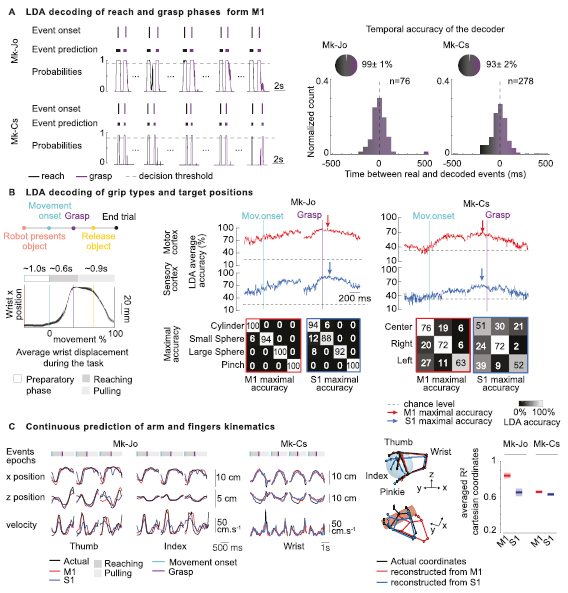
We developed a linear discriminant analysis (LDA) decoder that calculated the probability of reaching onset and grasping events using cortical signals from primary motor areas. The decoder accurately predicted these events over extended periods of behaviour in both monkeys (figure 8(A)), with accuracy of up to 99% for Mk-Jo and 93% for Mk-Cs. The median temporal precision was found to be close to zero (median difference: −11.5 ms for reaching onset and 9.5 ms for grasping in Mk-Jo, and −4 ms for both events in Mk-Cs).
Figure 8. Discrete and continuous decoding of movement dynamics (A) LDA decoding of reach-onset and grasp-onset events from M1 multiunit activity in both monkeys. On the left, four (Mk-Jo) and five (Mk-Cs) successive reach, grasp and pull trials are presented along with the actual event onset identified using video recordings, the detected motor states and the probability of reach-onset and grasp-onset motor states (in black and purple). On the right, histograms show the distribution of the temporal differences between the actual occurrence of reach-onset and grasp-onset events and the decoded occurrence of these motor states for all the recording sessions in the two monkeys (n = 76 reach and grasp events for M-Jo, one recording session, and n = 278 reach and grasp events for Mk-Cs, one recording session). (B) LDA decoding of grip types and target positions. On the left, we represented the trial structure as well as the average wrist displacement during the task (n = 48 trials for Mk-Jo, one recording session). The wrist position does not vary before the movement onset event identified via video recordings. The average reaching phase duration was 650 ms, while the average pulling phase lasted for about 900 ms. On the right, we show the average performance of the offline LDA decoder for each object shapes and each target position in space using multiunit activity recorded from M1 and S1 areas (n = 15 trials per objects for Mk-Jo, one recording session and n = 25 trials per position for Mk-Cs, one recording session). Confusion matrices report accuracies obtained for the best time window for M1 and S1 signals. (C) Continuous prediction of arm and fingers kinematics using Kalman filtering. Multiunit activity from M1 and S1 areas were used to predict fingers and arm 3D coordinates during the whole reach-and-pull movement. On the left, time traces show prediction of the thumb, index and wrist x, y positions and velocity using neural population activity from M1 and S1 arrays in Mk-Jo and Mk-Cs. Three-dimensional static hand postures were reconstructed by predicting x, y and z coordinates of each fingers and wrist joints in Mk-Jo for the small spherical grip and the cylindrical grip (n = 1 trial per object). On the right, performances of the continuous decoders are computed separately for M1 and S1 in both monkeys (cross validation k-folds with k = 48 for Mk-Jo, one recording session and k = 134 for Mk-Cs, one recording session).
Download figure:
Standard image High-resolution image
We then used the LDA decoder to classify object type and direction of reaching from both motor and sensory cortices. We repeated the LDA analysis at sliding time windows spanning the entire reach-and-grasp movement. Both M1 and S1 multiunit spiking activity accurately discriminated between different grasps during the grasping phase in Mk-Jo (maximum decoding accuracy: M1: 100%, S1: 94%). Interestingly, multiunit activity from M1 and S1 could be used to differentiate between objects more than 300 ms before movement onset. Yet, we were not able to reliably classify one of the three positions before the movement onset in Mk-Cs. Maximum decoding accuracy was reached around 100 ms before the grasp and was 70% for M1 and 58% for S1.
We finally investigated the possibility to decode continuous arm and fingers kinematics. By fitting a standard Kalman filter (Wu et al 2006) to each 3D coordinates of the arm and hand joints, we managed to reconstruct time-varying joint coordinates for most of the finger joints, obtaining a median performance of 0.83 and 0.65 for M1 and S1 areas, respectively, in Mk-Jo (figure 8(C)). Three-dimensional reconstruction of the wrist and fingers position based on decoded kinematic features is shown in figure 8(C) for both spherical and cylindrical grips. Hand and arm joint kinematics could also be decoded from Mk-Cs with a median performance of 0.68 and 0.67 for M1 and S1 area, respectively. For both monkeys, M1 decoder outperformed S1 decoder.
4. Discussion
Here we presented the implementation of a robotic platform for the study of sensorimotor processes underlying upper limb movements in monkeys. We validated this platform by implementing behavioural tasks in monkeys involving natural, three-dimensional reaching, grasping and object manipulation. We discuss our developments and the functionality of our robotic platform in light of three applications: 1) the study of arm/hand kinematics, 2) neural correlates of natural upper limb movements 3) application in Brain Computer Interfaces.
4.1. A versatile framework for multimodal characterization of three-dimensional arm movements
In typical neurophysiological experiments with monkeys, experimenters constrain the behaviour of monkeys to separate kinematic analysis from the study of dynamic force interactions with the world. Reach to grasp is often studied using static objects (Santello et al 1998, Brochier et al 2004, Vargas-Irwin et al 2010, Ethier et al 2012, Schaffelhofer and Scherberger 2016, Okorokova et al 2019) or constrained manipulandum (London and Miller 2013, de Haan et al 2018, Omrani et al 2016), while the production of forces is typically investigated under isometric/unidimensional conditions (Moritz et al 2007, Ethier et al 2012, Nishimura et al 2013) or in planar tasks (London and Miller 2013, Omrani et al 2016, de Haan et al 2018). While these constraints are effective to dissect the role of specific neuronal-subpopulation in the control of dynamic movement variables, even simple natural movements present an extraordinary complex patchwork of precision and force-controlled movement actions following unconstrained limb and joint trajectories. Our robotic framework allows the characterization of these natural behaviours while retaining the ability to integrate multimodal recordings of kinetic and kinematic signals.
We devised a platform in which subjects can interact freely with a robotic arm in a large three-dimensional workspace (figure S1(C)). We showed that interaction with the robot during upper-limb movements was safe and robust and that it did not impose any direct physical constraint on the arm, therefore promoting natural and smooth trajectories (figure 3(F)). In addition, we instrumented our platform to provide simultaneous recordings of pulling and contact forces. Our robot control strategy can accommodate for simple and straightforward definition of motor tasks and it allows the user to easily adjust robot behaviour. The control software package and libraries are made freely accessible and open source on Zenodo (https://doi.org/10.5281/zenodo.3234138). These can also be used as a basis to configure other robotic arms for similar tasks using our logic. We finally synchronized kinematics and cortical recordings to both robot behaviour and interaction forces measurements to obtain a rich multimodal panel of sensory and motor features characterizing arm and hand movements.
This framework provides with unprecedented means to address scientific questions that require the study of motor actions following unconstrained trajectories of limbs and joints in monkeys, such as the characterization of motor recovery in pre-clinical studies. It can potentially be used to design complex tasks such as precise control of grip pressure (Ethier et al 2012), maneuvering of 3D manipulandum, or motion under force-field perturbation. In addition, our platform could serve rehabilitation purposes (Spalletti et al 2014, 2017). For example, deficits and recovery in kinematics or force outputs could be characterized in animal models of disease.
4.2. Applications in the study of three-dimensional movement dynamics
Characterization of arm and hand movement dynamics requires the integration of pulling force components, contact forces and kinematics of the joints. In our example, we utilized these features to define a 'dynamic' manifold showing the evolution of trajectories in a space that mixes kinematic and forces. We used this tool to study kinematic adaptation to resistance levels and investigate the relationship between kinematics and pulling forces in grasping (Santello et al 1998). Surprisingly, our analysis revealed that kinematic strategies adapted to resistive loads. This suggests that kinematic synergies may vary when stronger forces are perceived. Our results indicate that during functional movements, upper-limb postures, interaction forces, and joint trajectories are continuously adapted together to reach the desired motor output, and perhaps regulated by both central (Santello et al 1998) or even simple reflex mechanisms (Weiler et al 2019).
4.3. Applications in the study of neural sensorimotor processes
We then sought to demonstrate the efficacy and potential of our framework for applications in the study of neural dynamics during natural movements. We reported that neural activity from both motor and somatosensory cortex show clear modulation with kinematic and dynamic movement variables. Both M1 and S1 activity showed complex modulation throughout the whole movement, with clear and smooth trajectories in the neural manifold (figures 6 and S3). This corroborates that somatosensory single cells encode multiple movement components and not only, or mostly, touch-related information (Prud'Homme and Kalaska 1994, London and Miller 2013). The firing patterns of single units in both M1 and S1 showed strong and complex modulation with respect to multiple movement parameters (figure 7). Our unique set up allowed us to investigate how kinematic, forces and contact events could, in combination or independently, explain neuron firing patterns. The majority of neurons in the somatosensory cortex encoded kinematics variables only. The remaining portion of cells encoded either contact events or force in conjunction with kinematics suggesting that important components of movement dynamics are encoded in somatosensory area 2. Availability of such a complex dataset and integrated kinematic signals opens intriguing possibilities for the study of population dynamics during natural behaviour.
4.4. Applications in neuroengineering and brain computer interfaces
Brain Computer Interfaces have been applied to animal models and humans to control robots (Hochberg et al 2006, 2012, Collinger et al 2013, Wodlinger et al 2015) support communication (Wolpaw et al 2002, Milekovic et al 2013b, Gilja et al 2015, Vansteensel et al 2016) and restore motor control (Moritz et al 2007, Ethier et al 2012, Bouton et al 2016, Ajiboye et al 2017). However clinical applicability is limited by the fact that these devices are tested in restricted laboratory environments and constrained tasks. Instead, the development of future solutions aiming at the recovery of functional movements requires set-ups that replicate and quantify performances of natural motor tasks. Our framework provides with such an opportunity allowing the execution and quantification of three-dimensional arm and hand movements in a relevant animal model.
For example, we showed that it was possible to decode both reach and grasp events as well as as target shape or position in space during a natural tasks that did not constrain the execution time or the movement trajectory. This type of information could be combined to build simple though robust decoders driving pre-programmed patterns of stimulation of the nervous system in pre-clinical and clinical settings (Capogrosso et al 2016, Wagner et al 2018).
Interestingly, even in a task that did not constrain the duration of the movement preparation or execution phase, we were able to predict grasp types from both motor and sensory activity several hundreds of milliseconds before movement onset. We found this result in accordance with several theories around the dynamical interaction and integration of sensory-motor processed during movement, and may even include components such as 'efference copy' (Grüsser 1994).
Finally, we showed that we were able to predict individual fingers kinematics from multiunit activity recorded in motor and somatosensory cortex during whole three-dimensional reaching and grasping movements (figure 8(C)). These results confirm the findings of Vaskov et al (2018) on M1-based finger motion decoding and extend the findings of Okorokova et al (2019) to multiunit activity and whole arm and hand movements.
5. Limitations
Our platform holds some limitations both in terms of performance in the present applications and flexibility towards different experimental uses. First, for our example applications, the monkey interacted with the robotic arm in an impedance-control mode. Impedance control introduces a damping effect on the arm of the animal which slows down the pulling movement. We explicitly chose this control mode, since this dampening effect was a feature of our experimental design. However, this behaviour can represent a motor constraint for studies that envision a fully transparent interaction with a robotic device that does not oppose any resistance to manipulation. In this case, direct torque-control strategies offer a good alternative to impedance control. These would allow for transparent interactions by compensation of any force applied on the robot end-effector. However, this control architecture could require additional strategies to compensate for kinematic instabilities. The code structure of our robotic framework provided online allows a custom implementation of direct force control schemes as well as several others, making it compliant to other behavioural requirements.
Second, our platform is built around a robotic arm. Obviously this choice influences not only the experimental performance and constraints, but also the number and type of variables that can be evaluated and compared to neural activity. In our case, we focused on studying upper-limb unconstrained reaching. Therefore, we allowed the monkeys to interact with the robotic arm exclusively at the end effector in order to leave the arm clear from any other constraints. This system is not compatible with studies aiming to manipulate or constrain specific degrees of freedom in the arm joint space, as well as the direct measurements of arm joint torques. In those cases, exoskeletons may offer a valid and more appropriate alternative (Scott 1999, Pirondini et al 2016).
6. Conclusion
In summary we have reported and described a platform that can be adapted to study a large variety of tasks that are useful to investigations in motor control and perhaps other related applications. We provided three examples showing the validity of our approach for both basic and applied investigations thus paving the way to more detailed studies investigating sensorimotor processes in both monkeys and humans.
Acknowledgment
The authors would like to acknowledge the financial support from the Wyss Center grant (WCP 008), the Bertarelli Foundation (Catalyst Fund Grant) an Ambizione Fellowship (No. 167912 to MC), and the Swiss National Science Foundation (No. 170032 to SM). The authors would like to thank Prof Eric Rouiller for his support at the Platform of Translational Neuroscience of the University of Fribourg; Prof Jocelyne Bloch and Prof Gregoire Courtine for performing surgical implantation of the BlackRock multi-electrode arrays, Jacques Maillard and Laurent Bossy for the care provided to the animals, Maude Delacombaz for helping training the animals, Dr Eric Schmidlin and Simon Borgognon for their help with anaesthesia and surgery preparations, Andre Gaillard for his help with the hardware, Vincent Hey for his help characterizing the pressure sensor, and the students Amelie Jeanneret, Laora Marie Jacquemet, Alen Jelusic, Antea Nicora, Clea Kunz and Giovanna Aiello for their help processing data.
Author contribution
MC, BB and MB conceived the study; BB designed and implemented the robotic framework hardware and the software modules with the support and supervision of SSM. A Bi MB designed and implemented the integrated sensors hardware and software with the support and supervision of FM and SSM. BB, MB, SC, MP and SW conducted the experiments; MB, BB, MP and TM performed the data analysis; SC, MB, A Bo and MK trained the animals; A Bo implemented the automatized training program and reward system and implanted the cortical arrays in Mk-Ol; MB, SC and SW processed the data. MC, MB, BB and MP wrote the manuscript; all authors edited the manuscript; SM and MC supervised the study.