
Abstract
A 162.5 MHz four-vane radio frequency quadruple (RFQ) accelerator has been developed at the Institute of Modern Physics (IMP) for Injector II of the China ADS linac. The RFQ will operate in continuous wave mode at 100 kW. For the designed 10 mA beam, the additional RF power dissipation will induce a very large reflection of power. A water-temperature controlling system will be used to reduce the power reflection by tuning the frequency of the RFQ. The tuning capability of the water temperature is studied under different configurations of cooling water. Simulations and experiment are compared in this paper. The experimental results agree well with simulation using ANSYS. This can be used as a reference to tune the RFQ in beam commissioning.
Export citation and abstract BibTeX RIS
1. Introduction
The China Accelerator Driven Subcritical System (China ADS) is a strategic plan to solve the nuclear waste and resource problems for nuclear power plants in China [1]. A continuous-wave (CW) proton superconducting linac is used as the driving accelerator of the China ADS. It consists of two parallel injectors, a medium energy beam transport (MEBT) and a superconducting main linac. Injector II was proposed and is being developed by IMP, the Institute of Modern Physics, Lanzhou. According to the roadmap, by 2015 the goal of the project is to build a 25 MeV proton linac, whose front-end of injector II is a 2.1 MeV four-vane radio-frequency quadrupole (RFQ) operating in CW mode [2].
Up to now, there are many RFQs which have been designed for high duty or CW operation, for example, the LEDA RFQ [3], SNS RFQ [4] and so on. In Injector II of the China ADS, the RFQ frequency is 162.5 MHz and it accelerates protons from 35 keV to 2.1 MeV. It is the only room-temperature acceleration element in Injector II and is the key element to guarantee CW operation. The RFQ has a four-vane structure. The cavity is divided into four segments with each about 1.0 m long. Oxygen-free high-conductivity copper (OFHC) is used for its good thermal and electrical conductivity. A full view of the RFQ with cooling devices is shown in Fig. 1. The specifications of the RFQ are listed in Table 1.
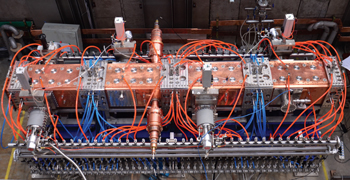
Fig. 1. Full view of the RFQ and cooling devices.
Download figure:
Standard image High-resolution imageTable 1. The main parameters of the RFQ.
| parameters | value |
|---|---|
| ion species | proton |
| RF frequency/MHz | 162.5 |
| inter-vane voltage V/kV | 65 |
| total structure length/m | 4.2079 |
| power/kW | 83.5 |
| duty factor (%) | 100 |
The cooling water system consists of two chillers which are used for cooling and frequency online tuning of the RFQ cavity. There are two independent cooling channels, which are used to control the temperature of the vanes and walls separately. In the actual situation, the temperature of the vanes is used to adjust the RFQ cavity frequency at the fixed temperature of the wall. The cavity frequency shift caused by cooling water temperature was investigated. The vanes and wall are shown in Fig. 2.
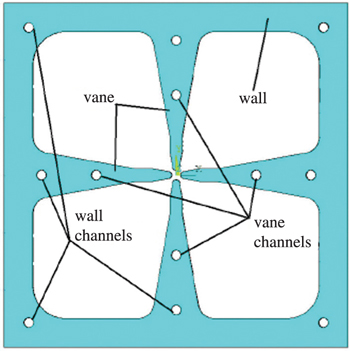
Fig. 2. Cross section of RFQ.
Download figure:
Standard image High-resolution image2. Frequency detuning and compensation of the RFQ
For a four-vane RFQ, the frequency is very sensitive to the temperature of the structure. The cooling water plays a key role for the operation of a CW RFQ, serving two functions. One is to take away the power dissipated on the inside surface of the RFQ by the RF field to maintain the thermal stability and to limit the deformation of the RFQ. The other is to tune the RFQ without affecting the field distribution when the RFQ is out of resonance [5]. It is a key factor for the stable operation of a high power CW normal conducting RFQ with and without beam. When there is no beam, the cooling water will remove the heat produced by RF dissipation and stabilize the cavity frequency. When the beam goes through the cavity, the temperature of cooling water will be adjusted to compensate the frequency shift caused by beam loading. For the RFQ cavity of ADS Injector II, there is no circulator for the amplifier, so the cooling water temperature tuning method will be an effective way to stabilize the cavity frequency when the beam is on.
To compensate for the shift, the water tuning method should first be simulated. Therefore, a multi-physics analysis with ANSYS[6] is necessary to study the relation between water temperature and frequency shift.
A parameterization analysis was carried out by varying the cooling water temperature to examine the frequency shift of the cavity. The results under different temperatures of cooling water are illustrated as follows. The base boundary conditions were: environmental temperature and cooling water temperature were set to be 20, and cooling water velocity was 2.29 m/s, with the input RF power fixed at 100 kW. The frequency shift is set to be zero when the cavity is under the base boundary condition.
The effects of cooling water temperature on the vanes, wall and total are shown separately in Fig. 3. From the figure, it can be seen that the frequency decreases at a ratio of −16.125 kHz/°C when the temperature of cooling water in the vane is increased, while the effect from cooling water in the wall is the inverse with a ratio of 12.875 kHz/. The frequency drift from the total cooling water change goes down at −3 kHz/°C [7].
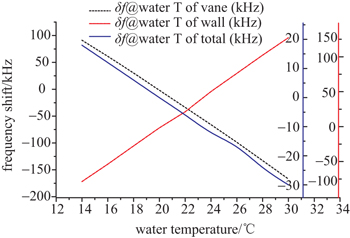
Fig. 3. Relationships between frequency shift and water temperature.
Download figure:
Standard image High-resolution imageFrom the simulation, the frequency shift is much more sensitive to the cooling water in the vanes. The water in the vanes will be used to tune the RFQ cavity frequency shift in the real situation.
3. Experimental conditions and process
The experiments were designed to verify the capability of changing the water temperature and find the right way to compensate the shift by tuning the water temperature. Tests were performed with the RFQ cavity and cooling water system to get real data to guide the tuning of the RFQ in beam commissioning. The data will also be used to benchmark the simulation results.
3.1. The cooling water system
The cooling system consists of 12 longitudinal coolant channels in the cavity. The layout of the cooling channels is shown in Fig. 2. Four of these are in the vanes of cavity, the other eight in the wall of the cavity. The cooling water system consists of two chillers, as shown in Fig. 4. One chiller provides circling cooling water for the four vanes of every segment of the RFQ. The other provides circling cooling water for the walls and π-mode rods of each segment of the RFQ. The two chillers can control the temperature of water channels in the wall and vane independently. There are water manometers, thermometers and flowmeters placed at the entrance and outlet of each water channel to monitor the water parameters from time to time.
The resolution of temperature tuning is 0.2°C for the water in both the wall and vanes, which will cause 1.2 and 1.6 kHz frequency shift of the cavity respectively. This can be measured by a network analyzer.
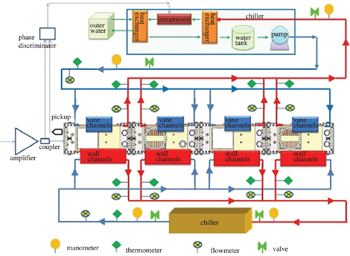
Fig. 4. The whole cooling system.
Download figure:
Standard image High-resolution image3.2. Water tuning experiment procedure
The water tuning experiments were carried on based on the above ideas and simulation. The water temperature in the vanes was adjusted to measure the cavity frequency shift with the fixed water temperature in the wall. The cavity frequency shift caused by the water in the wall has the opposite behaviour. The measurement system included network analyzer, RFQ cavity, water cooling system and other accessory equipment. The network analyzer was used to measure the frequency of the cavity. Once the temperature was changed, it took about 10–15 min to reach stability. When the water temperature was stable, new frequency will be gotten.
The experiments were carried out under two different RFQ conditions. One was cold status and the other was the full continuous wave RF power situation. The water temperature in the wall and in the vanes were changed from 20.0°C to 21.8°C and from 19.3°C to 21.3°C to apply the data acquisition. The step size was 0. 2°C. Experiments changing both water temperatures with 1.0°C step size were also done to crosscheck the former two experiments.
During the process, the vacuum, cooling water velocities and environmental temperature were monitored. The vacuum was 10 −7 Pa, which means the cavity sustained about one bar pressure. The cooling water velocities were 2.3 m/s, which is the design value. The environmental temperature is hard to control, so the experiments were done as fast as possible to reduce the variation in environmental temperature. The final environmental temperature variation was around 1.0°C.
4. Experimental results and comparison with ANSYS
In the full continuous wave RF power situation, experiments were carried out three aspects: changing the water temperature of the vanes, changing the water temperature of the wall, and changing the water temperature of all the channels. The experimental results are a linear distribution, and agree well with simulation using ANSYS, as shown in Fig. 5.
In the cold situation, experiments were carried out on the same three aspects as above, and the results are shown in Fig. 6. In the cold situation, the experiment results have almost the same trend as the CW results. So the frequency shift caused by changing the cooling water temperature is unaffected by whether it is run in CW or cold mode. The results of CW and cold mode compared with the results of the simulation are listed in Table 2.

Fig. 5. Comparison of experimental results and simulation results for (a) changing the water temperature of the vanes, (b) changing the water temperature of the wall, and (c) changing the water temperature of all the channels.
Download figure:
Standard image High-resolution image
Fig. 6. Comparison of cold situation experiments results and CW situation experiments results for (a) changing the water temperature of the vanes, (b) changing the water temperature of the wall, and (c) changing the water temperature of all the channels.
Download figure:
Standard image High-resolution image
Table 2. Simulation results and experiment results.
| change T of vane | change T of wall | change T of all | environment temperature | water velocity | |
|---|---|---|---|---|---|
| simulation | −16.125 kHz/°C | 12.875 kHz/°C | −3 kHz/°C | 20°C | 2.29 m/s |
| full power | −13.95 kHz/°C | 10.80 kHz/°C | −3.34 kHz/°C | 19.7 20.9°C | 2.15 2.45 m/s |
| cold | −14.5 kHz/°C | 11.40 kHz/°C | −3.27 kHz/°C | 19.7 20.9°C | 2.15 2.45 m/s |
There are many factors which influence the experiments, such as the perturbation of the flow rate, the variation of the environmental temperature, and so on.
In the experiments, the water velocity is in the range of 2.20–2.40 m/s. From previous simulations using the ANSYS code, when the water velocity changed by 0.1 m/s, the frequency shift was nearly 1.5 kHz [7].
During the experiments, the environmental temperature was ever-changing, with the minimum environmental temperature being 19.7°C and the maximum environmental temperature being 20.9°C. The environmental temperature has a slight effect on the cavity frequency.
5. Conclusion
The measurement of tuning capability of the cooling water system has been completed. The experimental results agreed well with the simulation results. The frequency is more sensitive to the water temperature of the vanes. The frequency shift caused by changing the cooling water temperature is unaffected by whether CW or cold mode is used. The results can also be a good reference to tune the RFQ in beam commissioning.
Footnotes
- *
Supported by National Natural Science Foundation of China (91026001)