

Abstract
NASA's TESS mission yields light curves for tens of millions of stars spread across the entire sky, a data set that will be a challenge to fully exploit without help from citizen scientists. To address this, we launched a new citizen science project, called "Planet Patrol", designed to analyze TESS data on exoplanet and eclipsing binary candidates. The project will also serve to benchmark different data reduction pipelines and help analyze unusual light curves that might defeat automated algorithms. The first stage of the project ran on the Zooniverse platform between 2020 September and November and involved more than 5500 registered volunteers. The Planet Patrol citizen scientists produced nearly 400,000 classifications of difference images used for photocenter analysis of about 1000 planet candidates from TESS. The results were incorporated into the photocenter module of the Discovery And Vetting of Exoplanets (DAVE) pipeline to improve its reliability. Specifically, the classifications indicated that all per-transit difference images are appropriate for photocenter analysis for about 40% of the planet candidates, and the corresponding measurements are sound. In contrast, the volunteers found that all per-transit difference images are dominated by astrophysical contamination and/or systematic effects for about 10% of the planet candidates. This indicated that the corresponding photocenter measurements are unreliable. Finally, the fraction of images appropriate for photocenter analysis varies between 0 and 1 for half the candidates. Removing the images classified as poor from DAVE's analysis of most of these candidates helped reduce the corresponding photocenter uncertainty by up to ∼30%. We plan to implement the output from another module of DAVE, designed for lightcurve vetting, into a second stage of the Planet Patrol project.
Export citation and abstract BibTeX RIS
1. Introduction
False positives are a major challenge for efforts aimed at the detection of transiting exoplanet candidates. Each candidate requires substantial vetting to eliminate instrumental artifacts, on-target stellar variability, eclipsing binaries, contamination from variable field objects, etc. Several automated processes and pipelines have been developed to tackle the problems false positives present, each pipeline using different methods and approaching the issue from a different perspective (e.g., Morton 2012; Coughlin et al. 2014; Catanzarite 2015; Ansdell et al. 2018; Shallue & Vanderburg 2018; Thompson et al. 2018; Eisner et al. 2019; Kostov et al. 2019; Giacalone et al. 2021; Guerrero et al. 2021). These methods have been extensively used for the analysis of Kepler, K2 and Transiting Exoplanet Survey Satellite (TESS) data, resulting in the creation of several catalogs of uniformly-vetted transiting exoplanet candidates (e.g., Coughlin et al. 2016; Morton et al. 2016; Thompson et al. 2018; Kostov et al. 2019; Eisner et al. 2020; Guerrero et al. 2021).
Catalogs produced by automated pipelines still rely on complementary analysis performed by trained human vetters. For example, using four publicly-available K2 light curve catalogs Kostov et al. (2019) showed that about 30% of the analyzed 772 planet candidates are not detected at a sufficient signal-to-noise ratio in at least one of the four catalogs. This demonstrated that no automated pipeline is 100% effective, no data set is 100% unbiased, and independent analysis of the same data set using different pipelines and different methods is highly valuable. To recognize and fill in the gaps missed by these pipelines, it is necessary to maintain a human component in the loop. Moreover, different light curve pipelines will make different optimization decisions when extracting the light curves from the respective target pixel files, e.g., crowded versus uncrowded regions, cool stars versus hot stars. This highlights once more the need for humans to evaluate which decision is most appropriate.
The TESS mission represents a bigger data challenge compared to Kepler and K2 as it surveys ∼200,000 stars at 2 minutes cadence and also records all-sky, Full-Frame Images (FFI) at 10 minutes and 30 minutes cadence. The FFIs contain tens of millions of sources, among which there are expected to be ∼10,000 transiting exoplanet candidates waiting to be discovered (Barclay et al. 2018) 18 . All planet candidates from TESS require comprehensive analysis and characterization, including human vetting. Overall, at the time of writing only about 150 candidates discovered by TESS have been confirmed to be genuine exoplanets while thousands are still under scrutiny. It is up to the community to capitalize on this treasure trove of data and discover these exciting new exoplanets.
For each transiting exoplanet candidate the research community must compare results from several light curve pipelines: e.g., CDIPS (Cluster Difference Imaging Photometric Survey, Bouma et al. 2019), DIAMANTE (Montalto et al. 2020), eleanor(Feinstein et al. 2019), DIA (Differential Imaging Analysis, Oelkers & Stassun 2019), PATHOS (PSF-Based Approach to TESS High Quality Data Of Stellar Clusters, Nardiello et al. 2019), QLP (Quick-Look Pipeline, Huang et al. 2021), SPOC (Science Processing Operations Center, Jenkins et al. 2016), and TASOC (TESS Data For Asteroseismology Lightcurves, Handberg et al. 2021). We must also consider the results from several different vetting pipelines: e.g., DAVE (Kostov et al. 2019) (Cacciapuoti et al. 2022, in preparation) versus LATTE (Eisner et al. 2019), SPOC Data Validation (SPOC DV, Twicken et al. 2018), TEV (Guerrero et al. 2021), and TRICERATOPS (Giacalone et al. 2021). We need to understand which pipeline is most reliable, where improvements are needed, and recover the many planets that one or more of these pipelines has missed or mischaracterized. The candidates for which the vetting process is most challenging (and potentially most subjective) are often the most elusive ones—which also usually turn out to be the most interesting. For example, the analysis of small planets with long orbital periods, planets around young stars, or planets in stellar associations may suffer the most from low SNR or strong systematics. Thus complementary human vetting of such systems is practically mandatory.
Unfortunately, visual inspection can be a slow process if a single human vetter must inspect a large number of figures, images and documents (often many pages long) per target. Additionally, visual inspection by a single human vetter or even a small team of vetters inevitably introduces a certain level of bias. This bias can be minimized by asking the vetters to follow the same analysis workflow as the automated pipelines, i.e., inspecting the data for secondary eclipses, photocenter motion during transit, odd–even differences (e.g., Coughlin et al. 2014; Thompson et al. 2018). However, a single vetter can not stay perfectly focused and consistent looking at such data for prolonged periods of time.
Citizen science provides an ideal platform for expanding these vetting efforts by offering a way to improve speed and calibrate for biases. Through citizen science, the vetting process can be "parallelized" by simply involving more vetters. This will effectively distribute the workload over a number of "computing nodes" orders of magnitude larger than typically used.
Indeed, citizen science has already been tremendously successful at analyzing data on transiting planet searches. A query of the NASA exoplanet archive at the time of writing reveals that nearly 1/3 of the known transiting exoplanets with periods longer than 1 yr were discovered by citizen scientists. For example, the Planet Hunters (https://blog.planethunters.org/2010/12/16/planet-hunters-introduction/, Fischer et al. 2012, MNRAS, 419, 4), Exoplanet Explorers (exoplanetexplorers.org, REF), Citizen ASAS-SN (https://www.zooniverse.org/projects/tharinduj/citizen-asas-sn0), and SuperWASP variable stars (https://www.zooniverse.org/projects/ajnorton/superwasp-variable-stars) projects have asked volunteers to help fill in areas missed by automated pipelines processing transit photometry. Analyzing data from the Kepler mission, volunteers have discovered hundreds of new exoplanet candidates (e.g., Wang et al. 2015), as well as other rare and intriguing objects (e.g., Boyajian et al. 2016). Where human vetters truly excel is targets with low SNR data, strong stellar variability, prominent systematic effects, planet candidates of small sizes, long periods, crowded fields—in other words, targets where the automated pipelines can struggle with the data.
Citizen scientists are already helping with the analysis of TESS data. The Planet Hunters TESS (PHT) project has produced the first set of TESS planet candidates discovered by volunteers, including 73 single-transit candidates and a number of eclipsing binary stars (Eisner et al. 2019, 2020, 2021). PHT uses the Zooniverse platform (Lintott et al. 2008) to engage citizen scientists in the detection of new planet candidates using the 2 minutes cadence TESS data. The candidates are ranked according to a clustering algorithm, and the top 500 are vetted by the core science team using the LATTE pipeline (Eisner et al. 2020).
Inspired by these efforts, we created the Planet Patrol initiative—a NASA Citizen Science project aimed at vetting transiting exoplanet candidates from TESS. The main focus of the project is to involve citizen scientists in the analysis of exoplanets, employing them to vet transiting exoplanet candidates discovered with TESS data. We note that Planet Patrol uses both the 2 minutes and the FFI TESS data, utilizing the eleanorlight curves (Feinstein et al. 2019) for the latter, whereas PHT exclusively uses the former. Also, in contrast to PHT, (i) the focus of Planet Patrol is on vetting of the candidates rather than their identification; (ii) the detailed analysis is done outside of the Zooniverse platform by a dedicated group of citizen scientist "SuperUsers" (see Cacciapuoti et al. 2022, in preparation for details). These volunteers are continuously trained and guided by the core science team through weekly meetings since the start of the project; and (iii) the SuperUsers interpret and analyze a comprehensive set of vetting tests and diagnostics produced by the Discovery and Vetting of Exoplanets software (DAVE, Kostov et al. 2019). DAVE is an automated pipeline designed to vet transiting planet candidates from K2 and TESS, consisting of several modules aimed at ruling out specific false positives such as photocenter motion during transit, significant secondary eclipses and odd–even differences. Overall, DAVE and LATTE utilize similar vetting diagnostics, e.g., photocenter measurements, lightcurve analysis, momentum dumps and/or known artifacts, presence of nearby stars, etc. While beyond the scope of this work, we note that applying independently-developed pipelines to the same data set and comparing the results would be highly valuable (see e.g., Kostov et al. 2019).
This paper introduces the basic citizen science methodology employed by the Planet Patrol project. It is organized as follows. In Section 2, we describe the project workflow and methodology; Section 3 discusses the quality of the image classifications and presents their implementation. Section 4 outlines the advantages of using human vetting and the synergy with automated pipelines. We summarize this work and outline our future plans in Section 5. The detailed results from the project, a catalog of uniformly-vetted planet candidates from TESS using Planet Patrol and DAVE, are presented in Cacciapuoti et al. (2022, in preparation).
2. Citizen Science Methodology
We started developing the Planet Patrol project in the winter of 2019. After setting up an initial workflow, the project passed internal review in 2020 February and was approved for a beta-testing phase, which was completed by 2020 May. The beta test helped us significantly improve and streamline the workflow, e.g., from a two page, multiple-question setup to a 1-page-1-question workflow, expanding the F.A.Q., adding more examples. Zooniverse approved the project for launch with the condition that recommended updates are implemented. The Zooniverse Planet Patrol project launched (opened to the public) on the 29th of September 2020 at exoplanetpatrol.org.
The website asked volunteers to visually inspect TESS images of thousands of stars hosting one or more planet candidates, and weed out the images that are contaminated or distorted by instrument artifacts and/or astrophysical false positives. These "difference" images, created with the photocenter module of DAVE (Kostov et al. 2019), represent the relative brightness of a particular target at the time of a particular transit and are used to evaluate the source of said transit by measuring the position of the center-of-light. The difference images are created by subtracting the average in-transit image from the average out-of-transit image for each transit, both averaged over the same number of cadences, and both having the same pixel size. For details, see Kostov et al. (2019). An example of a difference image is shown in Figure 1. The colors on each image represent the relative brightness of every object in the field of view during a particular transit, such that the background is typically dark blue and the center region is light yellow.

Figure 1. The main classification page of Planet Patrol on Zooniverse. The page shows the difference image for a particular transit of a particular planet candidate, representing the difference between the average in-transit image and the average out-of-transit image. It asks the user to select among five options that will help us understand if the target star is the true source of the detected transit-like signals. The red dashed contour represents the pixels used to extract the light curve from (the target's aperture), and the red dot represents the photocenter measured from DAVE. See text for details. The classifications for this particular image are finished, meaning it has been classified by 30 or more users.
Download figure:
Standard image High-resolution imageAfter familiarizing themselves with the project and the workflow, citizen scientists are asked to answer the following question for each image they see on their screen: "Do you see a single, bright spot that stands out in the image, with a red dot near the middle of the spot?" (see Figure 1). The possible options for the users are:
- 1.Yes, and it is inside the red, dashed contour.
- 2.Yes, but it is outside the contour.
- 3.No, there are multiple bright spots.
- 4.No, poorly-defined spot.
- 5.None of the above.
For example, when the volunteers answer with (1) they indicate that there are no obvious image artifacts that would otherwise contaminate the measured photocenter from the DAVE vetting pipeline, the source of the detected transits is inside the aperture used to extract the light curve of the target star, and the automated disposition of the particular target is reliable. In case the answer is (2), it means that the photocenter measurement is again reliable, but the time-varying source is outside the target's aperture—indicating that the transit signal is a false positive produced by a field star. If the answer is (3), the implication is that there is more than one variable source (either astrophysical or due to systematics) in the difference image. This indicates that the difference image is not adequate for photocenter measurements and the measured photocenter from DAVE is likely unreliable. This kind of image could also suggest that the candidate is a potential false positive due to a variable (intrinsic or extrinsic) field star. Cases (4) and (5) have been added to flag clearly poor images in which the data processing presented problems, for example due to high noise levels, high-amplitude, bright, nearby variable stars, missing data. Examples of difference images seen on the Planet Patrol Zooniverse portal are shown in Figure 2.
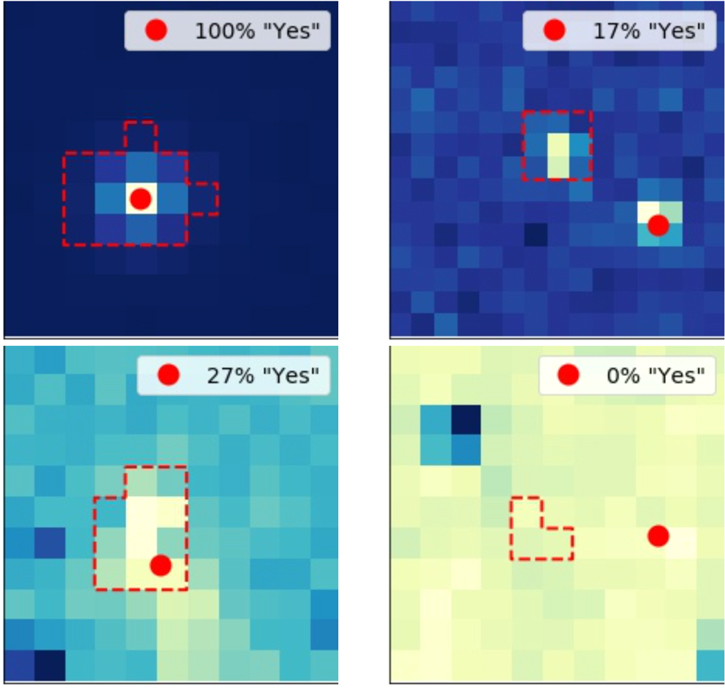
Figure 2. Examples of difference images vetted by the Planet Patrol users. The four examples represent, clockwise from top left, respectively: a good image (see text), an image in which more than one source is varying, an image on which the processing failed, and an image with a poorly defined spot. The percentage listed in the upper right corner of each image represents the fraction of users that answered with response 1 or 2 such that, e.g., the top left image was correctly classified by all users.
Download figure:
Standard image High-resolution imageThe "ideal" difference image corresponding to a particular transit of a particular planet candidate will show a single, bright spot (the target star as seen from TESS) with a red dot near the center of the spot. This bright spot represents the part of the image that is changing during the observed transits, and the red dot represents the measured photocenter of the bright spot, i.e., the source of the light lost during the observed transits (in this case the target itself). Such images are optimal for photocenter analysis and the respective measurements are trustworthy; we refer to these as "good" images throughout the text. We note that the shape, size, and location of the spot is target-specific. For bona-fide planet candidates, it is located near the center of the image with a photocenter measurement near the center of the spot—like for the case shown in the upper left panel of Figure 2. The brightness of the individual images in this sequence and the position of the measured photocenter will change from one image to the next ever so slightly, which is normal.
However, if some of the difference images for a particular planet candidates deviate from the ideal scenario outlined above this can throw off the photocenter measurement. Here, we refer to such images as "poor", and interpret the corresponding center-of-light measurements as unreliable. For example, sometimes the diffence images may show a bright spot partially overlapping the edge of the image, multiple bright spots (like the upper right panel of the figure), poorly-defined spots (lower left panel), negative spots (i.e., a dark spot on a bright background, lower right panel), or even no discernible spots at all. Except in a handful of unusual cases, the photocenter module of DAVE will produce a center-of-light measurement (regardless of the overall quality of the image) and provide a goodness-of-fit criterion which indicates whether the fit was successful. Based on our experience with TESS data, sometimes these criteria are sufficient to rule out a poor image (i.e., the fitting routine will fail) but in most cases they are not. This makes an automated triage of poor images challenging and necessitates complementary visual inspection.
Besides the vetting workflow described above, the Planet Patrol Zooniverse portal also provides users with general information about exoplanets and the TESS mission, describes the detection and analysis process, outlines the challenges, and provides a vetting tutorial and F.A.Q. as well as examples of different kinds of false positives. The Zooniverse webpage for each subject contains an "info" button that displays metadata about the subject: additional information about the particular target. The metadata we uploaded included coordinates, identification number in the TESS Input Catalog (TIC), and the TESS sector in which the image was taken. It also includes an active hyperlink to the ExoFOP-TESS archive, allowing the citizen scientists to easily learn more about the planet candidate. Finally, the Planet Patrol Zooniverse portal also provides a bulletin board (Talk) where volunteers can interact with the science team and one another in real time and ask questions about a particular target/image/candidate.
3. Results
Within a month after launch, Planet Patrol volunteers produced ∼400,000 classifications of difference images, completing the first stage of the project. These classifications provide information about ∼1000 planet candidates, obtained from the Exoplanet Follow-up Observing Program—TESS archive (ExoFOP-TESS, https://exofop.ipac.caltech.edu/). The TOIs included in this project represent about half of the planet candidates listed on ExoFOP-TESS at the launch of Planet Patrol on Zooniverse (2020 September). Their sizes range between about 0.06 RJup to about 3 RJup (with a prominent peak near 0.2–0.3 RJup); their orbital periods range from about 6 hr to more than 100 days (with a peak around 3 days). The host stars range in size from about 0.15 R⊙ to about 10 R⊙, and in brightness from Tmag ∼ 4.5 to Tmag ∼ 16 (see Cacciapuoti et al. 2022, in preparation for more details).
About half of these candidates are based on the 2 minutes cadence TESS light curves, and the other half are based on the 30 minutes FFI data. In total, this stage of the project contained 20,318 images with sizes between 11 × 11 and 23 × 23 pixels, depending on the target (where each pixel is about 20'' wide) and dynamic range dependent on the transit depth of the particular candidate.
3.1. Classification Quality
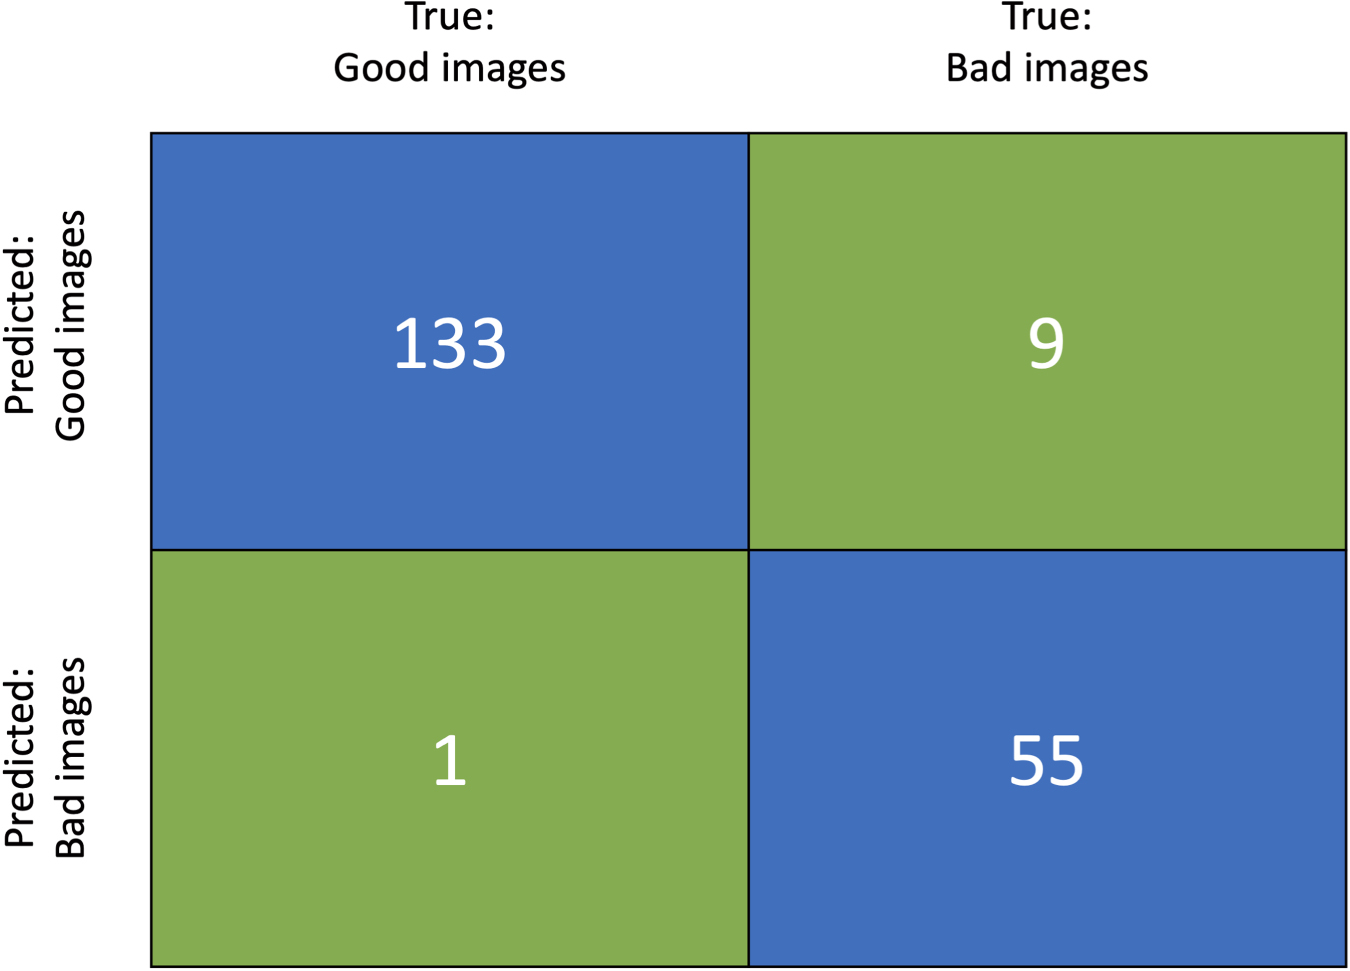
To evaluate the reliability of the accumulated results, we scrutinized a sample of 198 randomly-selected images classified by citizen scientists and checked the validity of the corresponding answers. Specifically, the percentage of the users who classified a particular image with "Yes, and it is inside the red, dashed contour." or "Yes, but it is outside the contour."was compared to the "ground-truth" classification by the science team and the superusers group; if this percentage exceeded 50%, the volunteers" classification was considered to be correct and the corresponding disposition reliable. This analysis found that out of the 198 sampled images, 95% were correctly classified by the citizen scientists. The incorrectly classified cases were usually caused by images where the bright spot and the measured centroid (red spot) both fall outside of the dashed line that is used to extract the light curves. The percentage of users that misclassified these kinds of images peaks around 45%, betraying the unreliable nature of such classifications. Figure 3 presents a confusion matrix (Tharwat 2021) describing this step of the analysis. The elements in the matrix are:
- 1.True Positive (TP): Correct prediction of good images (users correctly answered "Yes"),
- 2.True Negative (TN): Correct prediction of poor images (users correctly answered "No"),
- 3.False Positive (FP): Incorrect prediction of a good image (users incorrectly answered "Yes"),
- 4.False Negative (FN): Incorrect prediction of a poor image (users incorrectly answered "No").

Figure 3. Confusion matrix to test the accuracy of users classifications on a random sample of photocenter images. Clockwise from upper left: 133 True Positives (correct classification), 9 False Positives (incorrect classification), 55 True Negatives (correct classification), and 1 False Negative (incorrect classification).
Download figure:
Standard image High-resolution imageThe quality of the classifications is described by the parameters and metrics listed in Table 1. Briefly, the metrics are defined as follows: (i) sensitivity indicates how many good images (i.e., answers 1 or 2, Section 2) were classified as such; (ii) specificity is a measure of how many bad images were flagged as bad (i.e., answers 3, 4, or 5, Section 2); (iii) precision represents the fraction of true positives (good images classified as good) among all of the images classified as good; and (iv) accuracy measures the fraction of all correct users classifications, i.e., those that match the "ground-truth" classifications of the science team. As seen from the values listed in the table, the citizen scientists excel in recognizing both good and bad images, and consistently produce correct identifications. We note that the slightly lower percentage of the specificity metric is not unexpected—after all, there are only two possible categories of good images compared to a large variety of bad images. Extrapolating the results from this test to the entire set of 20,318 classified centroid images, we expect the 19,302 images to be classified correctly and 1016 to be incorrect classifications.
Table 1. Table of Parameters Describing the Quality of 198 Randomly Sampled Classifications of Centroids Images by the Users
| Parameter | Definition | Value |
|---|---|---|
| Sensitivity |

| 99% |
| Specificity |

| 86% |
| Precision |

| 94% |
| Accuracy |

| 95% |
Download table as: ASCIITypeset image
3.2. Applying the Classifications
The classifications marked as correct in the process described above (i.e., good images, corresponding to responses 1 or 2 from Section 2) were incorporated into the photocenter module of the DAVE pipeline in order to improve and streamline its output. Specifically, the photocenters measured from difference images flagged as poor by citizen scientists (i.e., poor images with responses 3, 4, or 5 from Section 5) are removed from the vetting analysis, and the respective photocenter standard deviation,  , recalculated. Here, N is the number of transits for a given planet candidate in a given sector (corresponding to N difference images), ci
is the measured photocenter for theith transit, and cmean is the average photocenter. This approach ensures that the difference image is optimal for photocenter analysis, i.e., there is a single source that is changing in brightness during the detected transits. This improves the reliability and precision of the measured photocenters, regardless of whether the target is the true source of the signal. To evaluate the image classifications for each planet candidate and for each sector of available data, we calculate the fraction of images (F) marked as good by at least 50% of the volunteers:
, recalculated. Here, N is the number of transits for a given planet candidate in a given sector (corresponding to N difference images), ci
is the measured photocenter for theith transit, and cmean is the average photocenter. This approach ensures that the difference image is optimal for photocenter analysis, i.e., there is a single source that is changing in brightness during the detected transits. This improves the reliability and precision of the measured photocenters, regardless of whether the target is the true source of the signal. To evaluate the image classifications for each planet candidate and for each sector of available data, we calculate the fraction of images (F) marked as good by at least 50% of the volunteers:

where NGood Images,50% is the number of difference images classified as good by at least 50% of the volunteers, and NAll Images is the number of all difference images (corresponding to all detected transits per candidate, per sector). Throughout this work, we adopt the 50% cut-off for simplicity.
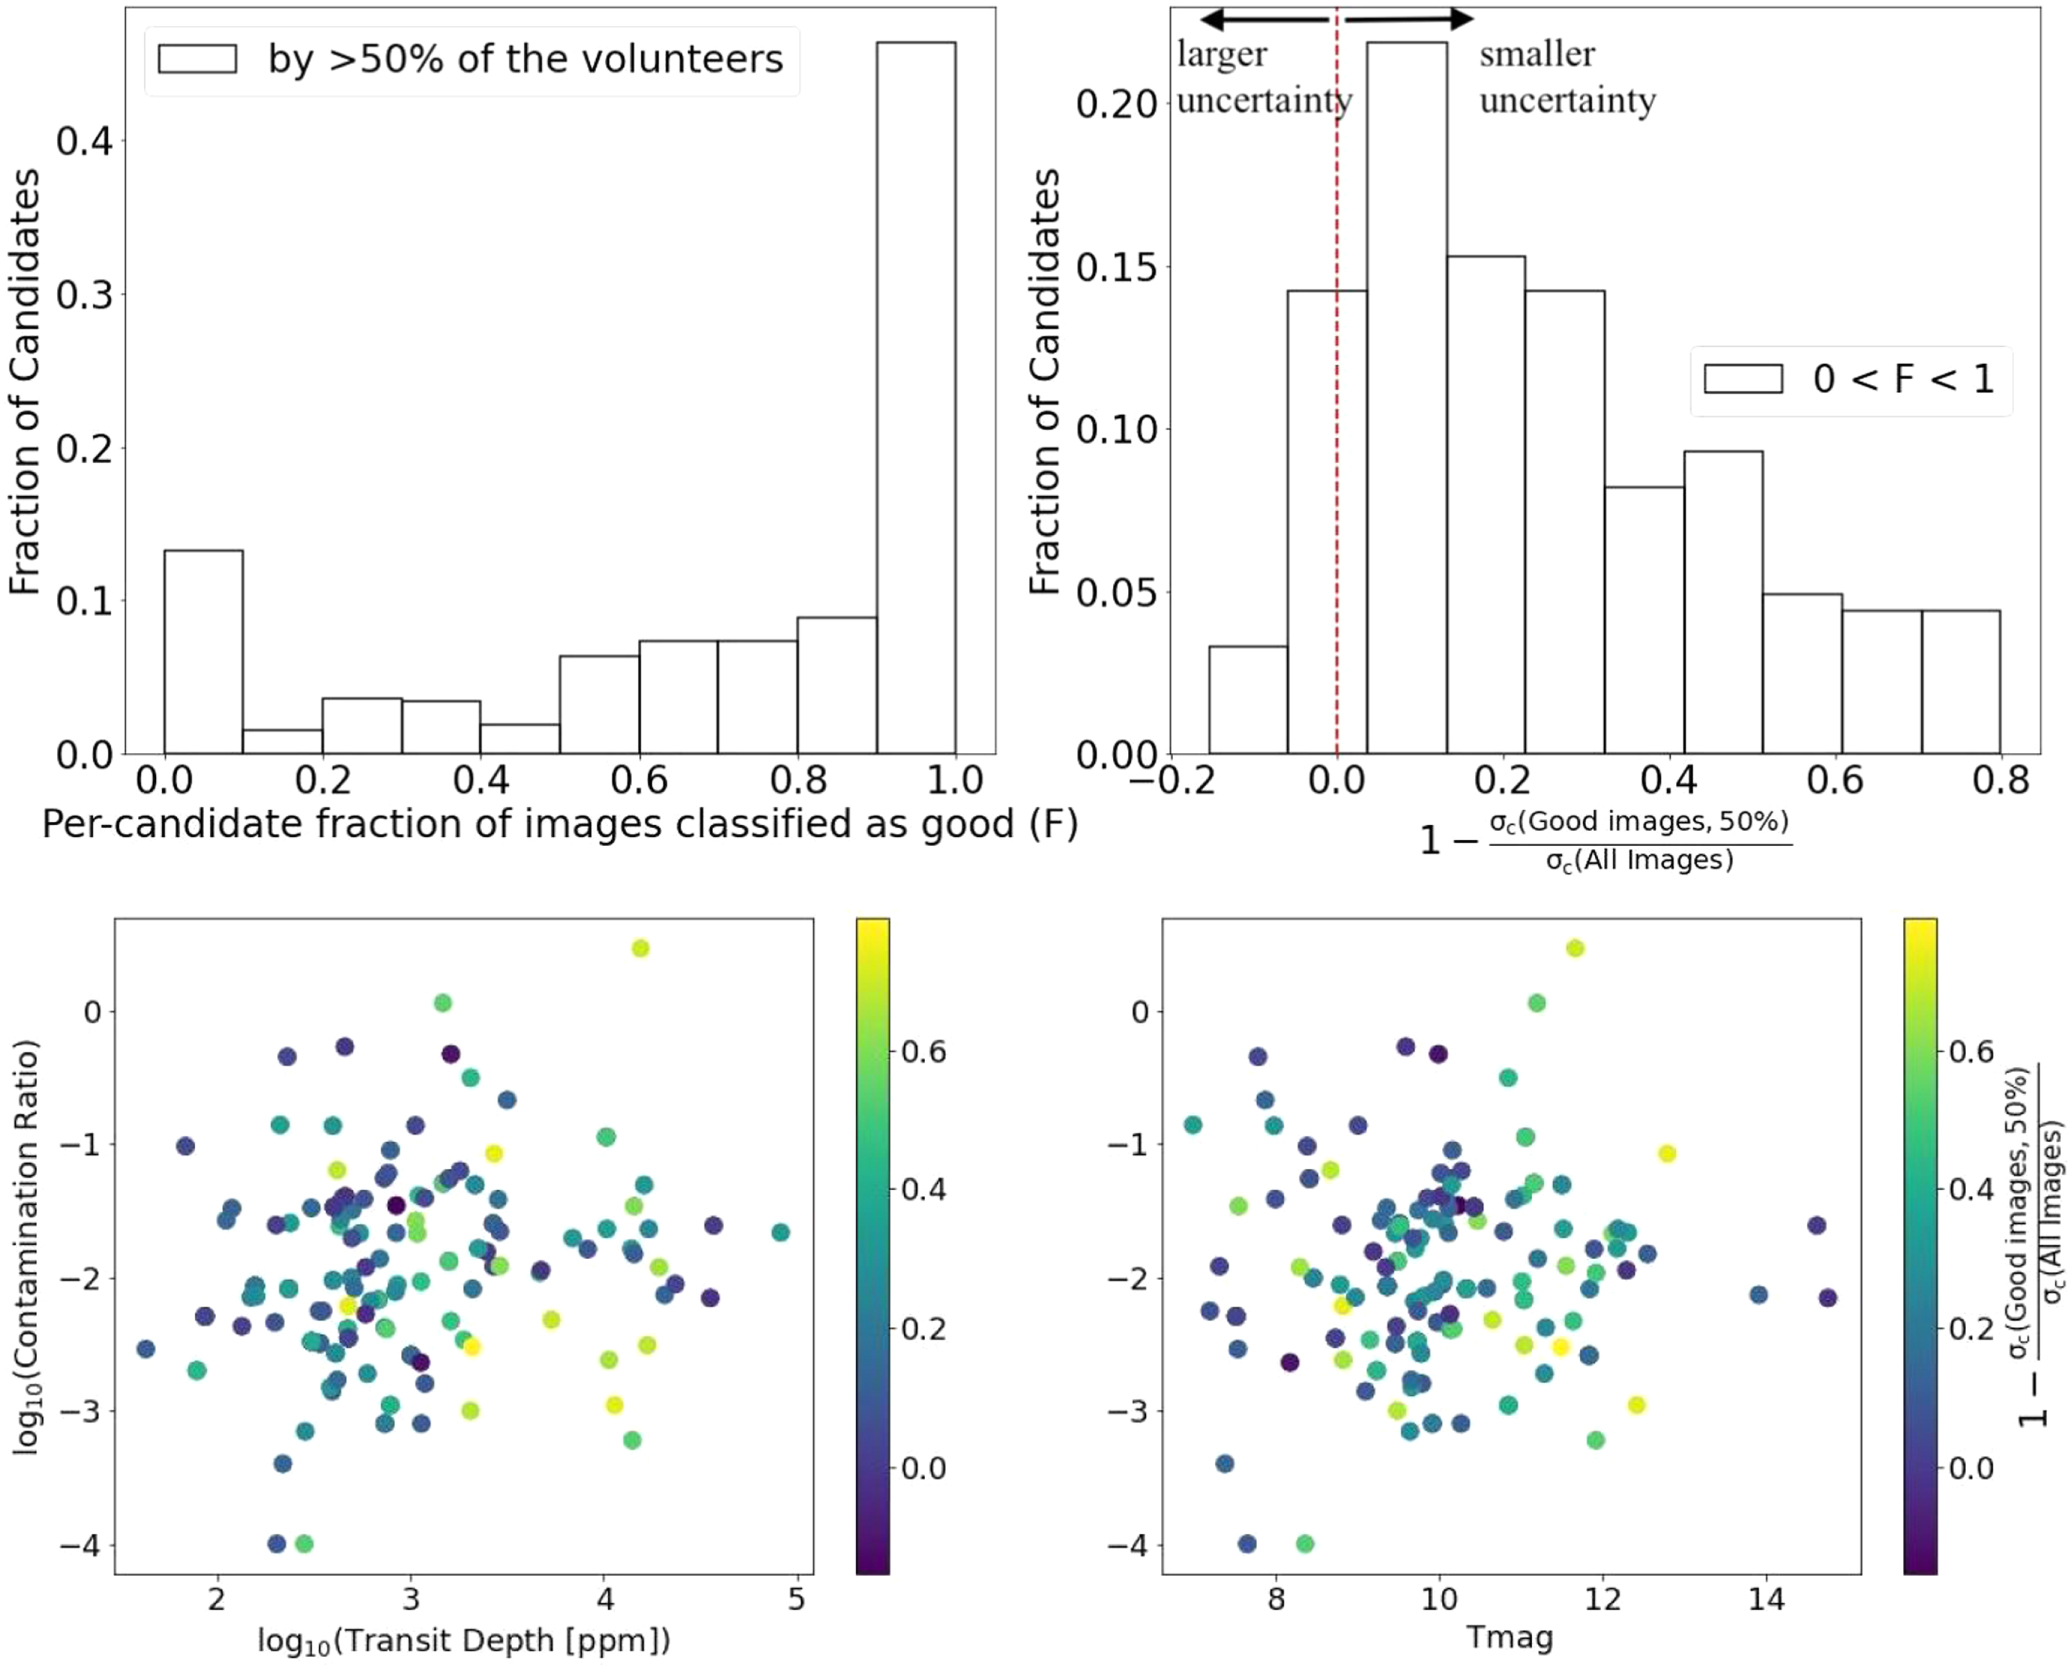
The image classifications produced by Planet Patrol helped reduce σc by estimating F for each target (and each sector observed) through flagging difference images that are not adequate for reliable photocenter measurements. As shown in the left panel of Figure 4, the fraction F is 100% for about 40% of the planet candidates. This indicates that the corresponding automated photocenter measurements from DAVE are reliable and the image classifications provide no further improvement of σc . The fraction F reaches zero for roughly 10% of all planet candidates. This suggests that the respective difference images are dominated by astrophysical contamination and/or systematic effects, indicating that the corresponding photocenter measurements are unreliable. Finally, the fraction is between 0 and 1 for about half of the planet candidates. For one in four of these candidates, less than half of the images were marked as good by the volunteers.

Figure 4. Upper left panel: fraction of planet candidates as a function of the per-candidate fraction of images, F, classified as good (i.e., responses 1 or 2 from Section 2) by at least 50% of the volunteers for each available sector of TESS data. Upper right panel: The corresponding distribution of improvements in the measured photocenter uncertainty, σc . For most of these candidates, removing the images flagged as poor by the volunteers results in up to ∼30% decrease in σc ; for some candidates σc decreases by up to a factor of five. See text for details. Lower panels: the improvements in σc as a function of the contamination ratio, transit depth, and TESS magnitude for the few hundred targets with contamination ratio as provided in the TESS Input Catalog.
Download figure:
Standard image High-resolution imageFor most of the candidates with 0 < F < 1, removing from the photocenter analysis the images classified as poor reduces σc by up to ∼30%; for some of these candidates σc decreases by up to a factor of five. For about 9% of them σc increases by up to a 15%. This is highlighted in the right panel of the figure, where we show the distribution of improvements in σc in terms of the normalized ratio between the uncertainty measured from the good images σc (Good Images, 50%) and that from all images σc (All Images). We note that the potential decrease in σc depends on multiple factors, e.g., the magnitude of the target, the contamination ratio, the transit depth, the sector the target was observed in, the cut-off for images considered as good. Overall, each candidate comes with its unique combination of contributing factors and, as highlighted in Figure 4 for the few hundred targets with known contamination ratios as provided in the TIC, we find no obvious correlations between these.
An example of this process is shown in Figure 5 for the case of TIC 1449640 (TOI 446.01). This is an eclipsing binary star with an orbital period of about 3.5 days that produced 6 eclipses in Sector 5. 19 The TESS lightcurve of the target is shown in the upper panels of Figure 5, highlighting the eclipses. The six difference images corresponding to these eclipses are shown in the lower panels of the figure, along with the aperture used to extract the lightcurve, the measured photocenters, and the percentage of volunteers who classified the image as good. As seen from the figure, image 2 is clearly dominated by systematics (and, to a lesser degree, image 4 as well)—even though there is nothing obviously wrong with the lightcurve at the time of the transit. 20 This suggests that the corresponding photocenter measurement is unreliable. And yet the photocenter fitting routine was successful for transit 2 even though it is clear that the difference image does not show a single, bright spot that stands out from an otherwise uniform dark background. To the rescue came the Planet Patrollers who correctly labeled image 2 as poor—i.e., only 27% of the respective classifications were labeled as options (1) or (2) described in Section 2. Removing the photocenter corresponding to image 2 from DAVE's analysis reduced the uncertainty in the measured average photocenter, σc , from ∼0.45 pixels to ∼0.2 pixels. We note that increasing the classification acceptance threshold to 67% (instead of the 50% outlined above) flags image 4 as well, which further reduces σc to ∼0.06 pixels. The latter practically confirmed that the target is the source of the detected eclipses, highlighting the synergy between DAVE and citizen science.
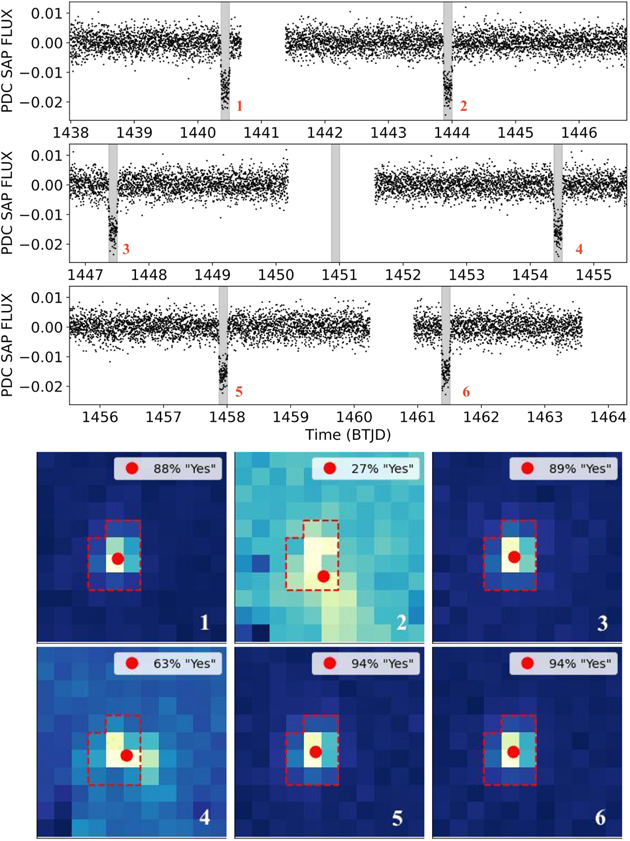
Figure 5. Upper panels: normalized PDC SAP light curve of TIC 1449640 for Sector 5, with the eclipses highlighted in gray and numbered in red. Lower panels: the corresponding difference images along with the aperture used to extract the lightcurve (red contour), the measured photocenters (red circles), the percentage of volunteers who classified the image as good, and the transit number. DAVE measured photocenters for all six eclipses, and marked the corresponding fits as successful, even though image 2 is clearly poor (and, to a lesser degree, image 4 as well). Citizen scientists flagged the poor images, and helped reduce the uncertainty in the measured average photocenter, σc, from 0.45 pixels to about 0.2%/0.06 pixels (assuming 50%/67% "Yes" threshold, respectively). This practically confirmed that the eclipses are on-target. See text for details.
Download figure:
Standard image High-resolution image4. Discussion
Planet Patrol is built on results produced by the DAVE vetting pipeline which is, by design, fully automated. However, these results can sometimes be unreliable, especially when the number of detected transits is small and/or their signal-to-noise is low due to e.g., instrumental and/or astrophysical artifacts. For example, the algorithm measures the center-of-light of each difference image, regardless of its quality, and automatically compares it to the catalog position of the corresponding star. As demonstrated above, evaluating the per-transit image quality is highly non-trivial as each target star comes with its unique data quirks, issues, and systematics—all of which vary on a sector-by-sector basis (in some cases even within the same sector)—and the differences between a good image and a bad one are sometimes subtle. Another source of confusion for the vetting disposition produced by an automated pipeline could be a target where stellar variability might conceal the presence of secondary eclipses from the algorithms—whereas human inspection would flag it effortlessly. An example of this scenario is shown in Figure 11 of Kostov et al. (2019) for the case of EPIC 206135267.01.
Given the large parameter space of the astrophysical signals under scrutiny, of the underlying systematic effects, and of the interactions between the two, it is thus highly challenging to hard-code in a classical algorithm all possible conditions contributing to the vetting process. Second, addressing the problem through AI methods such as machine learning (e.g., artificial neural networks) requires a robust training data set, which is often not readily available. And even after training, machine learning methods still heavily rely on training data. Thus the added utility of the image classifications produced by Planet Patrol—in essence a research product in itself—is that they can be used a large-scale training data set used by the community for the development of new AI-based vetting pipelines.
Another possible application of the Planet Patrol results is in providing better understanding of the heuristics of human perception with respect to the task of vetting, how data sets similar to those described here might be distributed, processed, and interpreted in the future. This will also improve the scientific workflow both at the citizen science level (in terms of how to provide instructions and at what level of detail) and at the professional science level (in terms of how to address common sources of ambiguity). Through the interactions with the citizen scientists our science team gained valuable "outside" perspective into aspects of the vetting process that we might have otherwise missed.
Last but not least, Planet Patrol has allowed thousands of people to be part of the scientific process underlying the discovery and characterization of exoplanets, as well as become familiar with the potential pitfalls and shortcomings of the transit method. Our experience with other Zooniverse citizen science projects taught us the overwhelming value of cultivating a group of well-trained citizen scientists to work with the science team on augmenting and extending the scope of the projects (Kuchner et al. 2016, 2017).
With this in mind, we created a Google Form that asks users to directly flag and report potential false positives, as well as outline the reason why they are considered as such. Completing this form was also utilized as a sign-up request to get in contact with the science team beyond the Zooniverse project and, if interested, to join our advanced user group. Altogether, 553 volunteers filled the form. Finally, the science team has been meeting weekly with advanced users on Google Meet since 2020 October. These weekly meetings have continued even after the Zooniverse project ran out of data in 2020 November. Details about the work of the advanced user group are presented in Cacciapuoti et al. (2022, in preparation).
5. Summary and Future Plans
The Planet Patrol project quickly surpassed our expectations in terms of the numbers of users that engaged in this endeavour, the rate of classifications, and the positive response from the volunteers. More than 5600 citizen scientists joined the effort over the duration of the project and helped reach the goal of classifying 400,000 difference images corresponding to about 1000 TESS planet candidates in the incredibly short period of about two week (see Figure 6). The classifications produced by the Planet Patrol project contributed to the overall reliability of the DAVE vetting workflow by evaluating whether the respective difference images are appropriate for reliable photocenter measurements. Specifically, the volunteers marked all per-transit differences images as such for about 40% of the planet candidates, indicating that the corresponding photocenter measurements are sound. For one in ten candidates, the volunteers found no per-transit difference images appropriate for photocenter analysis. These are candidates for which all difference images are dominated by astrophysical contamination and/or systematic effects, suggesting that the respective photocenter measurements are unreliable. The fraction of difference images classified as appropriate for photocenter analysis is between 0 and 1 for half of the candidates. For most of these, identifying the poor images helped reduce the measured photocenter uncertainty by up to ∼30%. Without the help from the citizen scientists, this task would have taken our science team years to complete.
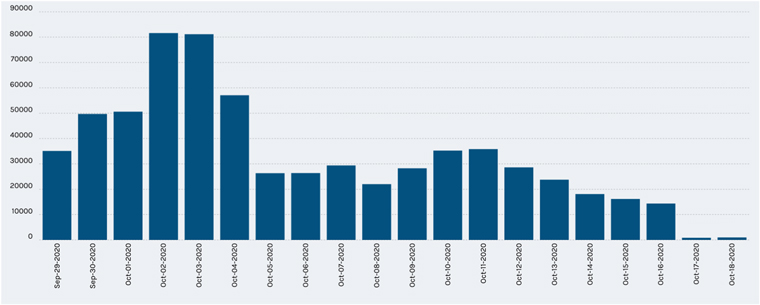
Figure 6. The rate of classifications of Planet Patrol images from the launch of the project on 2020 September 29th up to late October of the same year. Most of the classification of centroid images was done during the first few days right after the launch of the program. Barely two weeks in the project, the images were all classified with at least 30 dispositions and, often, many more.
Download figure:
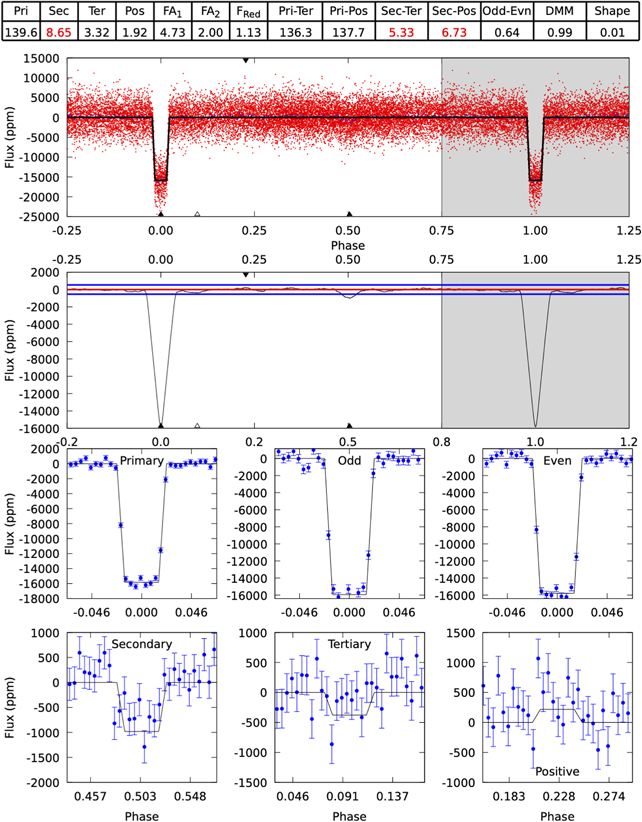
Standard image High-resolution imageThe citizen science image classifications produced by the Planet Patrol project will be further used as a training set for a machine learning classification scheme aimed at improving DAVE's automated disposition. Moreover, we plan to expand our citizen science efforts to examine additional false positive scenarios. In particular, beyond the photocenter analysis discussed here, DAVE also tests for indications of false positives due to secondary eclipses, odd–even differences between consecutive eclipses, stellar variability. An example of this is presented in Figure 7 for the case of planet candidate TIC 1449640. The figure shows the output from DAVE's modshift module designed to search for said signs. Briefly, the module phase-folds the light curve (upper panel on the figure) and convolves it with the best-fit trapezoid transit model (second panel) to find transit-like events at phases different from zero; for details see Kostov et al. (2019). For TIC 1449640 the modshift module finds a significant secondary eclipse at phase ≈0.5 and DAVE automatically flags the candidate as a false positive (caused by an eclipsing binary).
Figure 7. Results from DAVE's modshift module for planet candidate TIC 1449640. The module is designed to highlight significant secondary eclipses, odd–even differences between consecutive transits, etc. The upper panel shows the phase-folded light curve (red), the second panels show said light curve convolved with the best-fit trapezoid transit model (black curve in upper panel) along with the scatter in the light curve (blue horizontal lines). The lower panels show the best-fit model to all transits (label "Primary"), to all odd (label "Odd") and all even (label "Even") transits, to the best-fit secondary (label "Secondary") and tertiary (label "Tertiary") transits, and to the best-fit positive feature. The table above the figure represents the significance of the corresponding feature, such that a red number highlights a potential false positive sign. For the case of TIC 1449640, DAVE flags a clear secondary eclipse at phase ≈0.5. See text for details. Citizen scientists will ensure that the automated false positive flag is correct.
Download figure:
Standard image High-resolution image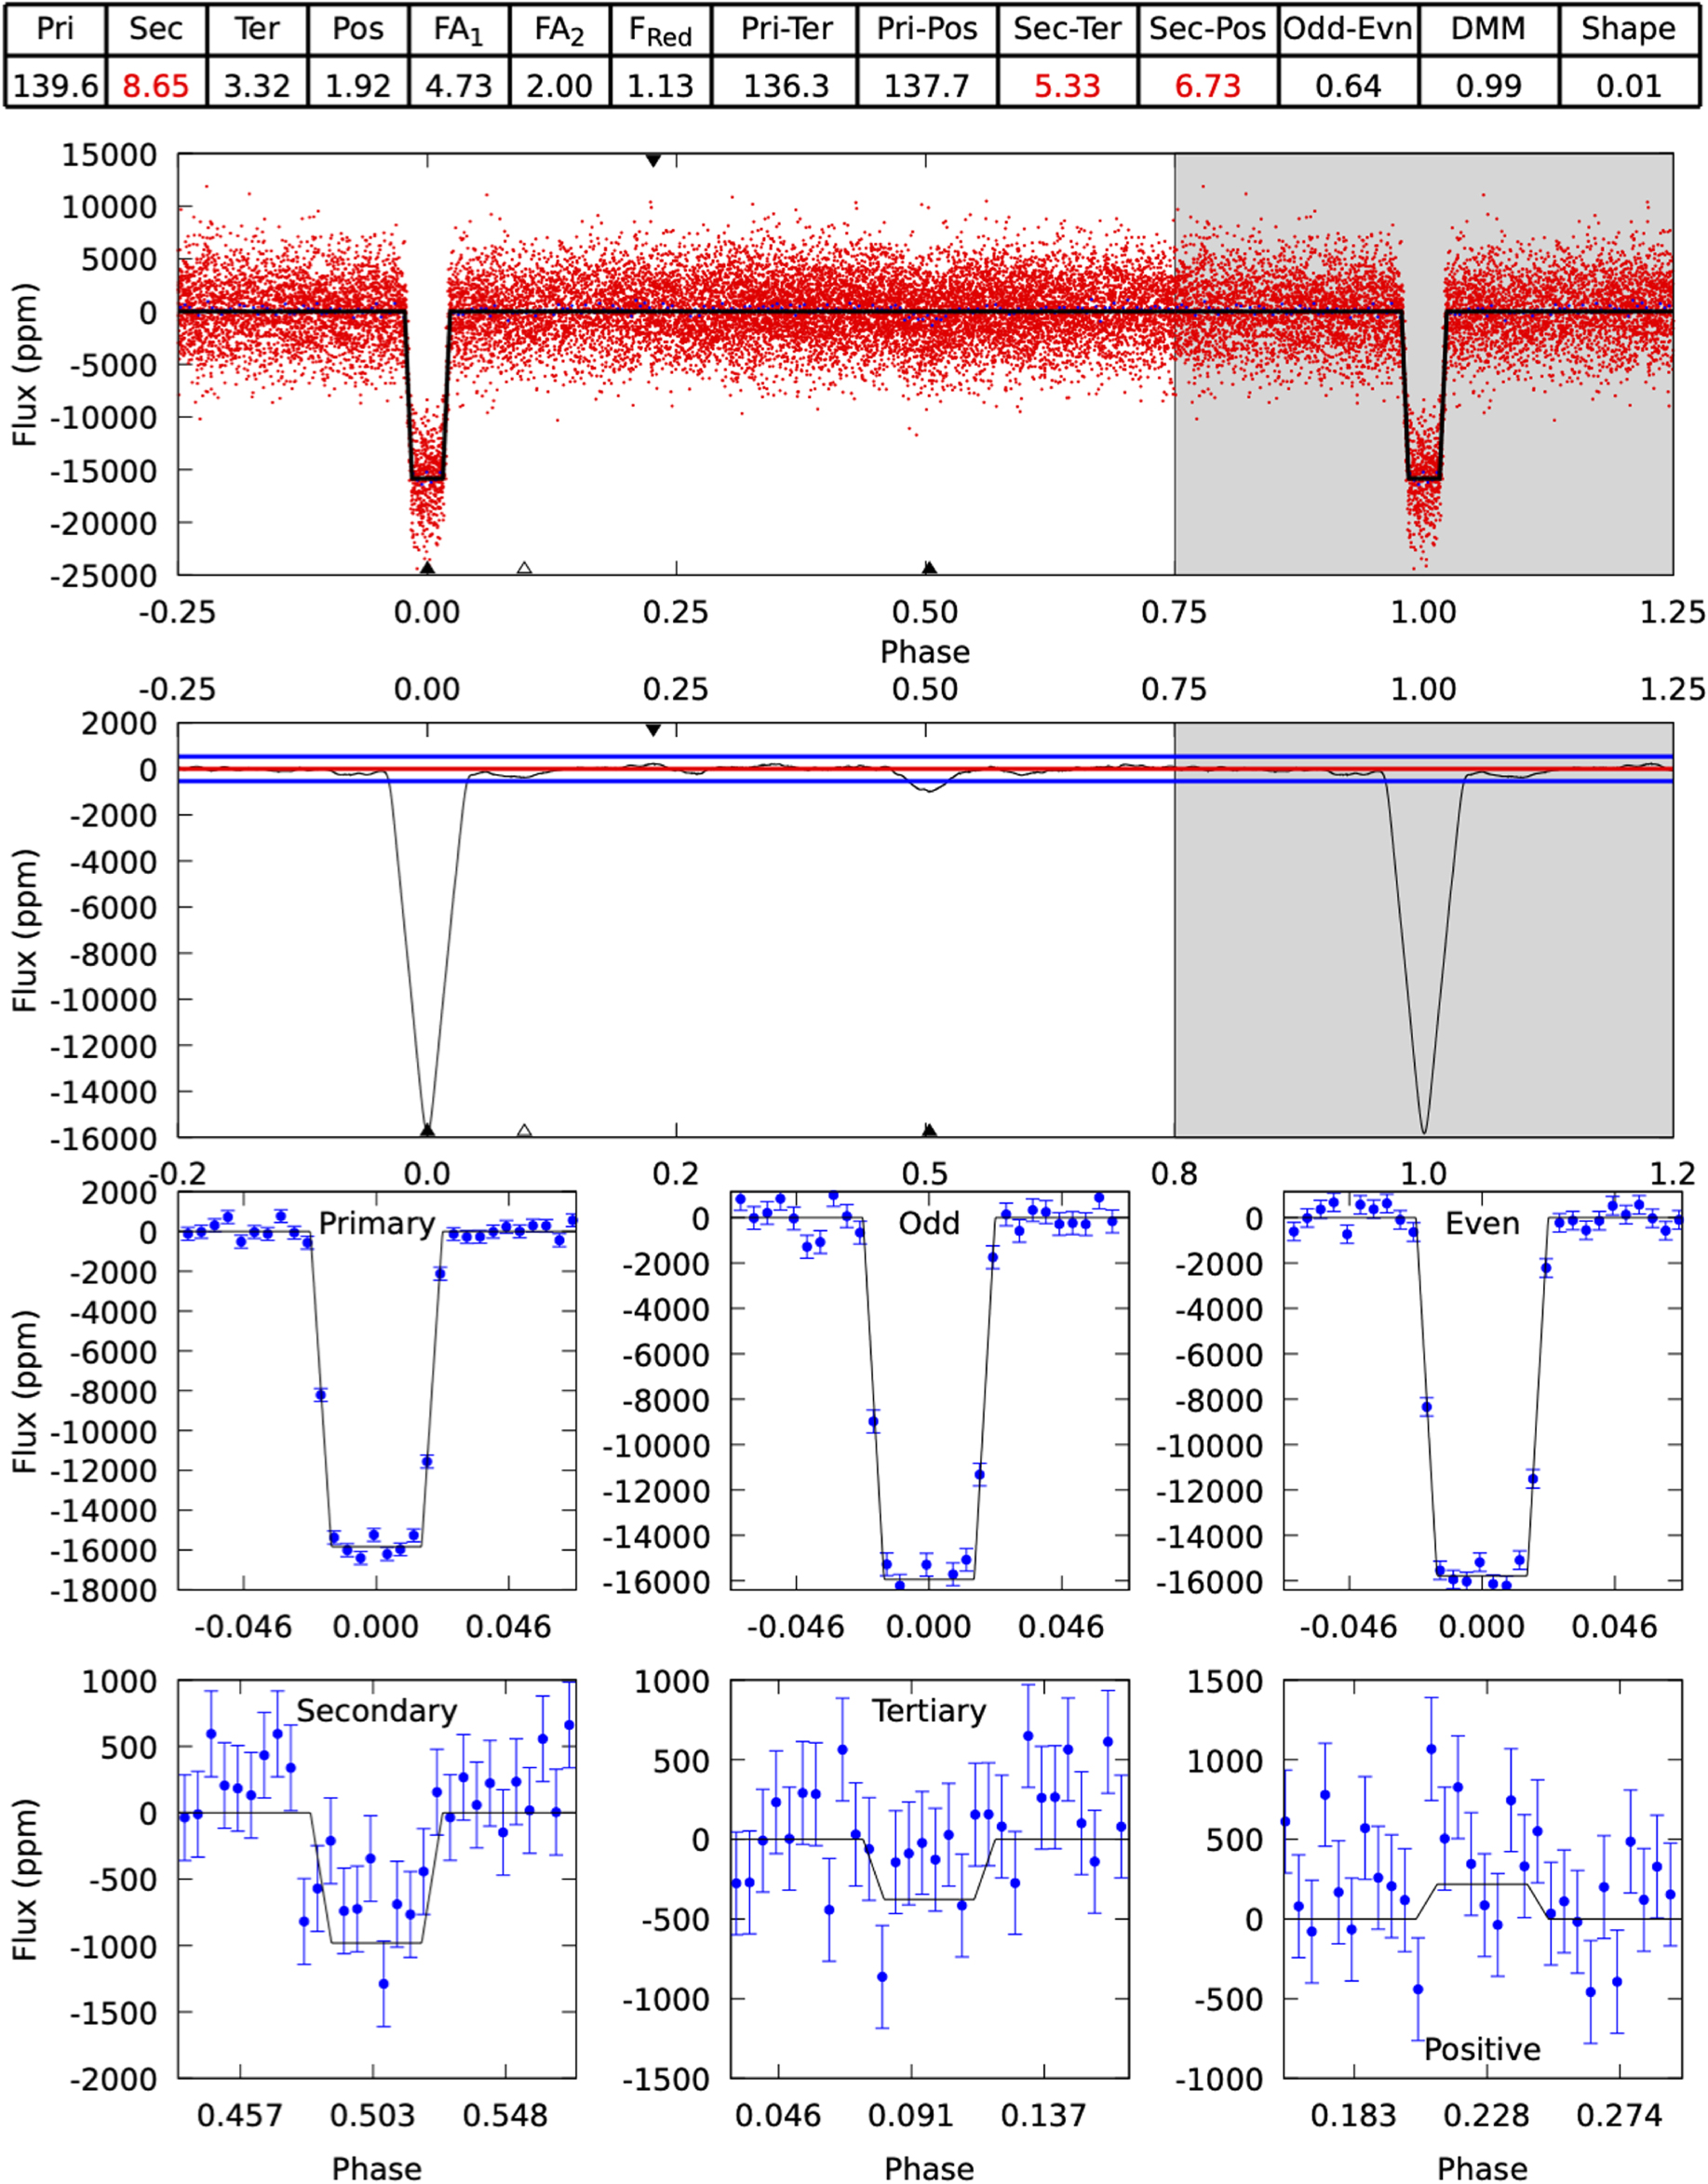
While the module is fully automated and works well most of the time, it is not 100% effective. For example, false positives caused by secondary eclipses can pass unnoticed through the modshift tests due to strong stellar variability (see EPIC 206135267.01, Kostov et al. 2019). Alternatively, a candidate can be incorrectly flagged as a false positive due to odd–even differences where none are present. Instead, the apparent differences are caused by stellar variability where one transit happens to occur during a peak in the light curve and another during a trough (see Cacciapuoti et al. 2022, in preparation).
To address these issues, we plan to implement the result from DAVE's modshift module into a new Planet Patrol Zooniverse workflow as a second stage of the project. Specifically, we will separate the panels from 7 into two figures highlighting: (a) potential secondary eclipses and (b) potential odd–even differences. We will use the short-cadence SPOC light curves where available, the FFI eleanordata, and potentially the FFI QLP data as well Huang et al. (2021). We will also describe the corresponding vetting process, add a new F.A.Q., and a dedicated Talk Board.
Overall, we expect to present to the volunteers the light curves for all TESS planet candidates listed on ExoFOP-TESS at the release of the new workflow (currently several thousand targets). Based on our experience with TESS data, about 20%–30% of these candidates will likely turn out to be false positives (Cacciapuoti et al. 2022, in preparation). Without the volunteers, identifying these false positives would take years to complete. With Planet Patrol, we expect to have every candidate vetted in the matter of weeks.
We thank the referee for the insightful comments which helped improve the manuscript. Planet Patrol has been made possible by the participation of more than 5600 volunteers. The project as a whole is referred to as the Planet Patrol Collaboration in the affiliations listed above.
This paper includes data collected by the TESS mission, which are publicly available from the Mikulski Archive for Space Telescopes (MAST). Funding for the TESS mission is provided by NASA's Science Mission directorate.
This research has made use of the Exoplanet Follow-up Observation Program website, which is operated by the California Institute of Technology, under contract with the National Aeronautics and Space Administration under the Exoplanet Exploration Program.
This work has made use of data from the European Space Agency (ESA) mission Gaia (https://www.cosmos.esa.int/gaia), processed by the Gaia Data Processing and Analysis Consortium (DPAC, https://www.cosmos.esa.int/web/gaia/dpac/consortium). Funding for the DPAC has been provided by national institutions, in particular the institutions participating in the Gaia Multilateral Agreement.
Facilities: Gaia - , MAST - , TESS - .
Software: Astropy (Astropy Collaboration et al. 2013, 2018), Eleanor (Feinstein et al. 2019), IPython (Perez & Granger 2007), Matplotlib (Hunter 2007), NumPy (Harris et al. 2020), SciPy (Virtanen et al. 2020).
Footnotes
- 18
We note that the number of light curves in TESS FFI data is comparable to that from ground-based exoplanet surveys such as e.g., the SuperWASP project where more 30 million stars were observed.
- 19
At the start of the Planet Patrol project, the target was listed as a planet candidate on ExoFOP-TESS but has since been retired as an on-target eclipsing binary. However, this does not affect the validity of the classifications for our photocenter analysis.
- 20
However, we note that the lightcurve is processed by custom detrending whereas the differences images used for photocenter measurements are constructed directly from the target-pixel files.