


Abstract
We investigated the behaviours of electrons from ZnO nanoparticles via a strong terahertz field. Luminescence from ZnO nanoparticles and surrounding nitrogen molecules was observed when the nanoparticles were irradiated with a terahertz free-electron laser (FEL). These excitations arose from the collision of electrons released via field electron emission with the ZnO nanoparticles and neighbouring nitrogen molecules. The strong excitation frequency dependence of the luminescence reflected the kinetic energy and trajectory of electrons outside the nanoparticles. We also observed spectral changes in the luminescence during macropulses of the FEL, even though the carrier lifetime of the nanoparticles was shorter than the interval between the micropulses. These changes were caused by the nanoparticles becoming charged due to electron emission, resulting in the electrons being re-emitted outside the nanoparticles. The electrons outside the nanoparticles were accelerated more efficiently by the terahertz field than the electrons inside the nanoparticles, and thus the motion of these exterior electrons provided a new excitation path.
Export citation and abstract BibTeX RIS

Original content from this work may be used under the terms of the Creative Commons Attribution 3.0 licence. Any further distribution of this work must maintain attribution to the author(s) and the title of the work, journal citation and DOI.
1. Introduction
The extremely strong optical fields obtained using intense ultrashort laser technologies provide unique opportunities to investigate field-sensitive nonlinear optics beyond the conventional perturbation theory. In an atomic gas system, an electron released from the bound state via tunnelling is accelerated by an AC electric field, and higher harmonics are generated through its re-collision with an atom [1, 2]. The critical field strength for this phenomenon is characterised by the ponderomotive energy  where e and m are the charge and mass of an electron, respectively, and
  and
and  are the amplitude and frequency of the optical field. The ponderomotive energy is equivalent to the time-averaged kinetic energy of an electron accelerated in the optical field. When the ponderomotive energy is larger than the relevant energy (for example, ionisation energy in an atomic gas system), non-resonant and non-perturbative phenomena appear on the energy scale of
  The ponderomotive energy is proportional to the square of the electric field over the frequency and thus intensive studies have been conducted on this nonlinear phenomenon using intense mid-infrared ultrashort pulses.
In the semiconductors, the variety of its electric band structures results in various field-sensitive phenomena [3, 4]. Many researchers have demonstrated higher harmonic generation, Bloch oscillation, dynamic Franz–Keldysh effects, Zener tunnelling, impact ionisation, and THz-induced phase transition using coherent intense few-cycle terahertz (THz) fields generated with frequency down-conversion techniques of ultrashort optical pulses [3–7]. These phenomena occur when the ponderomotive energy is larger than the relevant energy to its electric structure (for example, bandgap energy Eg). Because the electron scattering process and dielectric screening of an incident AC field suppress the efficient driving of electrons in semiconductors, metallic structures were attached to the solid in these studies to enhance the ponderomotive energy.
Electrons can likely be more efficiently accelerated by an AC electric field outside the material than inside the material, given the little scattering of electrons and low dielectric screening of an incident AC field. The application of a strong (megavolts per centimetre) electric field to a needle-like structure of conductors causes the release of electrons from the surface via quantum tunnelling, known as field electron emission [8]. AC field electron emission occurs when the ponderomotive energy is larger than the work function. THz field electron emission has been reported, in which the THz electric field was strongly enhanced by various metal nanostructures [9–12]. Accelerated electrons outside the solid have a sufficiently large Ep to excite and ionise ambient nitrogen molecules [12]. The release and acceleration of electrons is likely similar to that in an atomic gas system [1, 2]; consequently, phenomena induced by electrons with large  may be different from the reported extremely nonlinear phenomena occurring inside solids.
We explored this excitation path by focusing on ZnO nanoparticles as a unique electron source. ZnO nanostructures have been developed as promising materials for cold cathodes [13] and thus their electron affinity is well characterised (U0 = 4.1 eV for bulk ZnO [14]). ZnO is a typical direct gap semiconductor with a bandgap energy of Eg = 3.4 eV. ZnO is being developed as a promising material for light-emitting diodes [15, 16] and its luminescence includes information on carriers in the electron source material. In this work, we performed luminescence measurements of ZnO nanoparticles with the work function close to the bandgap energy under intense THz pulse excitation by using a tuneable picosecond THz free-electron laser (FEL) for excitation. The field strength is sufficiently strong for field electron emission without need for an antenna structure to enhance the AC electric field, allowing analysis of the trajectory of electrons outside the nanoparticles by assuming a homogeneous THz field. The characteristic micropulse train profile of the THz-FEL resulted in an unusual spectral change in the luminescence with time.
2. Experimental
We used 100 nm diameter ZnO nanoparticles (Sigma-Aldrich) on a Ge substrate; quantum size effects were negligible. The nanoparticle layer in the sample is hundreds of micrometres thick in order to suppress the influence of the substrate with large dielectric constant. Before the experiment, we observed the broadband photoluminescence spectra under picosecond pulse excitation, and this luminescence was assigned as the intrinsic luminescence of the ZnO nanoparticles. The results of the time-resolved photoluminescence measurements are shown in supplemental data available online at stacks.iop.org/NJP/19/053017/mmedia. A photoluminescence decay time of hundreds of picoseconds has been reported previously [17].
We used a THz-FEL based on the L-band electron linac at the Research Laboratory for Quantum Beam Science, Institute of Scientific and Industrial Research, Osaka University [18]. The FEL generates a linear-polarised pulsed THz beam at a repetition frequency of 5 Hz. This beam is a train of about 100 FEL micropulses separated at 37 ns intervals (27 MHz repetition) that forms a FEL macropulse with a duration of about 4 μs. Figure 1(a) shows a schematic of the FEL macropulse profile and the experimental setup for irradiation, and figure 1(c) shows the intensity profile of the micropulse train, measured using a fast pyroelectric detector (P-5, Molectron). We also evaluated the profile of one FEL micropulse by electro-optic sampling methods using a Ti:sapphire laser (Tsunami, Spectra-Physics) with a repetition of 81 MHz and a duration of 100 fs, synchronised to the third harmonic of the micropulse repetition with a jitter of <2 ps. Figure 1(d) shows the temporal profile of the intensity of an FEL micropulse measured using the electro-optic sampling technique. We used a (110)-oriented 0.27 mm thick GaP crystal as the electro-optic crystal, and a polarimeter based on detectors with the bandwidth of 200 MHz, and evaluated one micropulse with a duration of 5 ps. The frequency of the THz-FEL with a 15 MeV electron beam was tuneable from 3 to 6 THz by changing the magnet gap of the wiggler (figure 1(b)). The FEL characteristics depend on the optical cavity length, which was set at the position providing the highest macropulse energy.
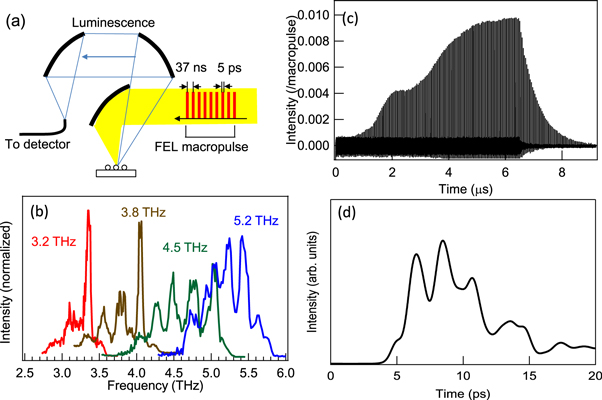
Figure 1. (a) Experimental setup for luminescence measurements using THz-FEL pulses. (b) THz FEL spectra. (c) Intensity of the micropulse train as a function of time, measured using a pyroelectric detector. The peak intensity of each micropulse is normalised by the summation of the peak intensities of all micropulses. (d) Temporal profile of the intensity for an FEL micropulse measured using the electro-optic sampling technique.
Download figure:
Standard image High-resolution imageThe FEL beam was a transversely coherent Gaussian beam in the evacuated transport line. The beam passed through a polycrystalline diamond window, then through air, to the experimental station, and the highest measured macropulse energy was 15 mJ. Each macropulse comprised about 100 micropulses and the highest micropulse energy was calculated to be approximately 150 μJ. The THz pulses were focused on the sample in dry air using an Au-coated parabolic mirror with a 25 mm focal length. We evaluated the frequency-dependent spot size of the excitation pulse from 0.24 to 0.36 mm using the knife-edge method. The maximum field was >5 MV cm−1 for a macropulse energy density of 23 J cm−2 at the focal point and was sufficient to observe field electron emission without metallic antenna structures. The damage threshold of the nanoparticles is a macropulse energy of 12 mJ and thus we attenuated the THz pulses using a pair of wire-grid polarizers. The luminescence was collected with Al-coated parabolic mirrors and the time-resolved luminescence was measured with a single-shot streak camera (C5680, Hamamatsu Photonics K K) equipped with a spectrometer with a 150 mm focal length (SP2150, Princeton Instruments). A 2 m optical fibre was used to guide the luminescence to the detector and thus we carefully calibrated the luminescence spectra in the UV region using a standard light source. The spectral and temporal resolutions were 1.2 nm and 40 ns, respectively.
3. Luminescence under strong THz radiation
The upper red curve in figure 2 shows the luminescence spectrum for an excitation frequency of 3.2 THz and an energy density of 6.7 J cm−2. Sharp luminescence lines were observed in the UV region and were assigned to the second positive system of nitrogen molecules  and the first negative system of
  ions
ions  [12, 19], denoted by crosses and solid triangles, respectively, on the baselines of the luminescence spectra. Figure 3 shows the luminescence intensity of the prominent peak at 3.46 eV (second positive system of
  ) as a function of the macropulse energy density. Luminescence at an excitation frequency of 3.2 THz (red solid circles) appears and rapidly increases above a threshold macropulse energy density of 5 J cm−2 and is a characteristic feature of the field-sensitive phenomenon. These lines were not observed in air in the absence of ZnO nanoparticles and thus they did not arise from the breakdown of air. We therefore concluded that the nitrogen molecules surrounding the nanoparticles were excited by the electrons emitted from the nanoparticles.
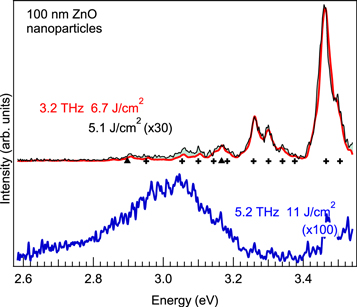
Figure 2. The bold curves show the luminescence spectra for the excitation frequencies 3.2 and 5.2 THz. The macropulse energy for excitation is 8 mJ. The superimposed thin curve for 3.2 THz excitation shows a luminescence spectrum with a lower excitation energy density of 5.1 J cm−2. The crosses and solid triangles show the transition energies of the second positive system of nitrogen molecules and the first negative system of  ions, respectively [19].
Download figure:
Standard image High-resolution image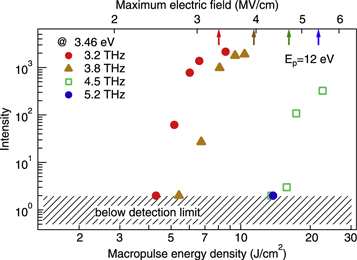
Figure 3. Luminescence intensity at 3.46 eV (second positive system of  ) measured in counts as a function of macropulse energy density for different excitation frequencies. The upper axis shows the corresponding maximum electric field strength of the THz-FEL. The arrows show critical electric fields for the ponderomotive energy of
  at the respective excitation frequencies.
Download figure:
Standard image High-resolution imageThe luminescence showed strong excitation frequency dependence, as shown in figure 3, in which the threshold energy density for the onset of luminescence from excited nitrogen molecules increased with increasing excitation frequency. Additionally, a different luminescence component became apparent at higher excitation frequency. The lower blue curve in figure 2 shows the time-integrated spectrum obtained using an excitation frequency of 5.2 THz. The macropulse energy remained at 8 mJ, corresponding to an energy density of 11 J cm−2, yet the spectral shape observed for an excitation frequency of 5.2 THz is completely different from that observed for an excitation frequency of 3.2 THz, namely, a broad emission peak at around 3.1 eV. Comparison of this broad peak with the photoluminescence spectrum in figure S1 of supplemental data resulted in it being assigned as the luminescence of the nanoparticles. The vertical scale of the lower spectrum for 5.2 THz excitation is 100 times magnified compared to the upper spectra for 3.2 THz; consequently, this broad luminescence component is tiny at the lower excitation frequency at 3.2 THz, where the luminescence of nitrogen is strong. The luminescence spectrum (black) for 3.2 THz and 5.1 J cm−2 is vertically expanded 30 times for normalisation, and thus the small difference in the intensities of the spectra around 3.1 eV for different excitation energy densities is due to the luminescence of the ZnO nanoparticles.
4. Electrons bypassing the nanoparticles
The luminescence of the surrounding nitrogen molecules arose from the collisions of released electrons via field electron emission, whereas the mechanism underlying the excitation of the ZnO nanoparticles is unclear. The broadband luminescence near the bandgap energy may be due to the carriers driven by the strong field in the nanoparticles. Higher harmonic generation in bulk ZnO was previously observed using ultrashort mid-infrared excitation pulses [20]. We measured the luminescence of the bulk ZnO plate under THz-FEL excitation in transmission geometry (figure S2 of the supplemental data) and observed weak emission over the entire visible region, similar to the higher harmonics of the excitation pulse. We measured the emission below 2.6 eV in reflection geometry using THz-FEL pulses but observed no emission from the ZnO nanoparticles, suggesting that excitation of the ZnO nanoparticles is not due to irradiation of the higher harmonics generated in the nanoparticles.
Impact ionisation induced by the intense THz field in the nanoparticles may be the most plausible mechanism for the excitation of the nanoparticles, given previous reports regarding similar phenomena in InSb and GaAs [3, 4, 21–23]. Accurate calculation of the impact ionisation rate in ZnO is challenging because the high-energy electron scattering rate is unknown [24]. A critical field strength of 15.7 MV cm−1 for the ZnO-based avalanche diode has been reported [25], which is higher than the field strength in our experiment. Dominant phenomena, therefore, should be quantum tunnelling, such as Zener tunnelling [26, 27], and field electron emission [9–12].
The characteristic energies of these phenomena in ZnO, namely the bandgap energy Eg = 3.4 eV [28] and the work function  [14], are comparable. However, the induced AC electric field inside the nanoparticles is strongly screened below the infrared-active phonon frequency
  due to the large dielectric constant
  and
and  [28]. With the simple assumption of spherical dielectrics, the induced electric field inside the nanoparticle is reduced as
  whereas it does not significantly decrease as
  just outside the particle [29]. Thus, we define the critical field of quantum tunnelling in the nanoparticle as
 ![$((\epsilon (0)+2)/3)\,[{\rm{\omega }}{(2m{{E}}_{{\rm{g}}})}^{\mathrm{1/2}}/e],$](https://content.cld.iop.org/journals/1367-2630/19/5/053017/revision1/njpaa6e19ieqn19.gif) and that for the field electron emission as
and that for the field electron emission as ![$((\epsilon (0)+2)/(\epsilon (0)-1))\,\{{\rm{\omega }}{[2m({{U}}_{0}-E)]}^{\mathrm{1/2}}/e\}.$](https://content.cld.iop.org/journals/1367-2630/19/5/053017/revision1/njpaa6e19ieqn20.gif) Comparing them, we concluded that the field electron emission is more incident than the Zener tunnelling. The probability of electron emission is proportional to exp[−γ] with the parameter
Comparing them, we concluded that the field electron emission is more incident than the Zener tunnelling. The probability of electron emission is proportional to exp[−γ] with the parameter ![${\rm{\gamma }}={\rm{\omega }}{[2m({{U}}_{0}-E)]}^{\mathrm{1/2}}/e{E}_{{\rm{THz}}},$](https://content.cld.iop.org/journals/1367-2630/19/5/053017/revision1/njpaa6e19ieqn21.gif) where U0 is the energy of the potential barrier and E is the electron energy. The parameter
where U0 is the energy of the potential barrier and E is the electron energy. The parameter  is equal to the ratio of the tunnelling time of electrons through the barrier to the half period of the AC field [4]. γ = 1 calculated for ETHz = 2 MV cm−1, ω/2π = 5 THz, and
  is almost the same in our experimental conditions, provided that the field reduction at the surface of the nanoparticles is neglected.
Iwaszczuk et al reported nitrogen luminescence via field electron emission from structured metal using an intense THz field with a frequency lower than the THz-FEL [12]. They reported that, in addition to field electron emission, the ballistic acceleration, excitation, and ionisation of nitrogen molecules, and UV emission, all govern electron behaviour in air near metallic structures under a strong THz field. Because the cross-section of nitrogen excitation is one order of magnitude smaller than that of elastic scattering, electrons are elastically scattered many times and travel several micrometres from the emission area. The released electrons then excite nitrogen molecules far from the nanoparticles. However, in our case, some electrons driven by the high-frequency field were not scattered to the nitrogen molecules. Because an electron is accelerated to a velocity of  within a half period of the THz field, the propagation length of the electron is
  Electrons returned to the ZnO nanoparticles if l fell below the mean free path length of the electron, le, for the higher-frequency excitation. The kinetic energy of the accelerated electrons outside the nanoparticles was larger than that in the nanoparticles due to the short scattering time, which multiplied the number of electron–hole pairs via electron–electron inelastic scattering in the nanoparticles. Figure 4(a) shows a schematic of this bypassed electron excitation.
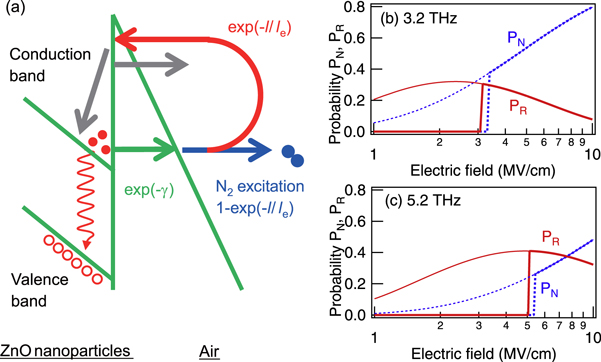
Figure 4. (a) Schematic of the excitation of nanoparticles and nitrogen molecules by released electrons via field electron emission early in the micropulse train. Returned electrons can cause secondary electron emission, which may be detected later. Probabilities  (bold dashed curves) and
  (bold solid curves) are shown as functions of the incident AC electric field with frequencies of (b) 3.2 and (c) 5.2 THz. We assume
  with
with  and
and  respectively.
Download figure:
Standard image High-resolution imageWe numerically evaluated the probability of one electron colliding with a nitrogen molecule, ,$](https://content.cld.iop.org/journals/1367-2630/19/5/053017/revision1/njpaa6e19ieqn31.gif) and the probability of the electron returning to the nanoparticles,
and the probability of the electron returning to the nanoparticles, ![${P}_{{\rm{R}}}=\exp [-\gamma ]\exp [-l/{l}_{{\rm{e}}}].$](https://content.cld.iop.org/journals/1367-2630/19/5/053017/revision1/njpaa6e19ieqn32.gif) Figures 4(b) and (c) show
Figures 4(b) and (c) show  (bold curves) and
  (dashed curves) as functions of the incident THz field with frequencies of 3.2 and 5.2 THz. We assumed le = 0.4 μm based on a cross section for electron collisions of 10−15 cm−2 [12] and a molecular density of nitrogen in the air of 2.7 × 1019 cm−3. A released electron returns to the nanoparticles at low electric field
  whereas an electron released from the nanoparticles is frequently scattered at high electric field
  The crossover field for
  increases with the excitation frequency.
Next, we discuss the processes by which the nitrogen molecules and nanoparticles are excited. An electron collides with a nitrogen molecule and excites it when its kinetic energy  is larger than the excitation energy of the nitrogen molecule,
  [12]. The field amplitude of
  is denoted by arrows in figure 3. The threshold of the luminescence in the nitrogen molecules was almost the same as that for
  On the other hand, the electrons in the nanoparticles are multiplied by returned electrons with kinetic energies
  above the critical energy, Ec, which is generally equal to 3Eg in materials with a simple band structure [30]. We assumed critical behaviour of
  and
and  (vertical lines in figures 4(b) and (c)). At the field with
  for 3.2 THz excitation,
  the probability of
  is larger than
  which causes nitrogen excitation. For 5.2 THz excitation, however, PN is smaller than
  which causes excitation of the nanoparticles. We can therefore explain why the spectral line-shape of the luminescence is drastically changed when the excitation frequency is tuned from 3.2 to 5.2 THz, as shown in figure 2.
We experimentally confirmed the validity of this model from the luminescence of the ZnO nanoparticles in vacuum. Figure 5 shows the luminescence spectra of the ZnO nanoparticles under atmospheric pressure (red curve) and below 10−3 Torr (blue curve) at an excitation frequency of 3.8 THz. The excitation energy density is 6.5 J cm−2, which is just above the threshold of the luminescence. The luminescence intensity of the ZnO nanoparticles under vacuum is 1.8 times larger than that under atmospheric pressure. All electrons emitted into the vacuum should return and re-collide with the nanoparticles below 10−3 Torr, and thus this luminescence behaviour shows evidence of electron excitation bypassing the nanoparticles.
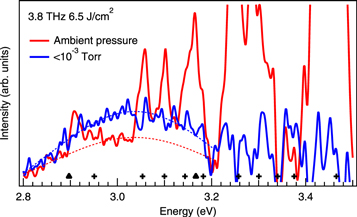
Figure 5. Time-integrated luminescence spectra of the ZnO nanoparticles under atmospheric pressure (red curve) and below 10−3 Torr (blue curve) for an excitation frequency of 3.8 THz. Dashed curves show the fitted Gaussian curves used to extract the luminescence components of the ZnO nanoparticles. The transition energies of the second positive system of nitrogen molecules and the first negative system are shown as crosses and closed triangles, respectively [19].
Download figure:
Standard image High-resolution imageThis bypassed electron excitation process for nanoparticles is analogous to the higher harmonic generation process in an atomic gas [1, 2]. A free electron moves away from the atom and returns. The collision of the returning electron causes extremely nonlinear polarisation, which creates a high-energy photon. Despite the large  no coherent harmonics components below 2.8 eV were observed near the nanoparticles in reflection geometry. The collision of the returning electron is equivalent to the resonant excitation process because there is an empty density of state in the conduction band. The non-resonant coherent process was consequently suppressed.
5. Spectral change in luminescence during the macropulse
We observed an unusual change in the luminescence spectrum during the macropulse and this change was due to micropulse train excitation. Figure 6 shows image plots of the time-resolved luminescence spectra for an excitation macropulse energy of 8 mJ at excitation frequencies of (a) 3.2 and (b) 5.2 THz, which are the same excitation conditions as in figure 2. The corresponding time-integrated spectra and macropulse profiles measured by the fast detector are also shown. For an excitation frequency of 3.2 THz, the UV luminescence increased early in the micropulse train, and appeared within the macropulse duration. For an excitation frequency of 5.2 THz, the broadband luminescence also increased early in the micropulse train. This luminescence spectrum changed during the macropulse; the intensity of the broadband luminescence at 3.1 eV decreased with a low-frequency spectral shift to 2.8 eV despite the micropulse train arriving. Because the lifetime of excited nitrogen molecules in air is several nanoseconds [12] and that of the ZnO nanoparticles is a few hundred picoseconds in the photoluminescence measurements [17], these luminescence components should decay within 37 ns, which is the interval between the micropulses. Therefore, the spectral change of broadband emission during the macropulse cannot be explained by a simple contribution of the excited nanoparticles.
A similar spectral changes in luminescence was also observed in a sintered ZnO pellet (see supplemental data). Despite the non-uniform grain size and the surface roughness of the ZnO pellet, we observed luminescence similar to that of the ZnO nanoparticles. Because the damage threshold of the ZnO pellet was higher than that of the nanoparticles, we observed this unusual spectral change under higher intensity THz-FEL excitation: the broadband ZnO luminescence was reduced with a spectral shift toward lower energy despite arrival of the micropulse train, and the luminescence recovered after the micropulse train left, clearly demonstrating luminescence quenching.
A plausible mechanism for this quenching is charge build-up on the nanoparticles, which is frequently observed in cathodoluminescence measurements, scanning electron microscopy, and photoemission spectroscopy. Figures 4(b) and (c) indicate that some released electrons from the nanoparticles collided with the nitrogen molecules and did not return to the nanoparticles, even under a low electric field. This resulted in an accumulation of positive charge in the nanoparticles, inducing strong internal field modulation in the nanoparticles [8] which should quench the luminescence. The charge accumulated on the nanoparticle with every micropulse and dissipated slowly, causing the spectral shift toward lower energy due to simultaneous band bending [31] and the high-density charge effect [32]. Conversely, the charge build-up does not influence the spectral line-shape of the excited ambient molecules, as shown in figure 6(a), because the excited nitrogen molecules are far from the charged nanoparticles due to spatial diffusion of the emitted electrons and molecules [12].
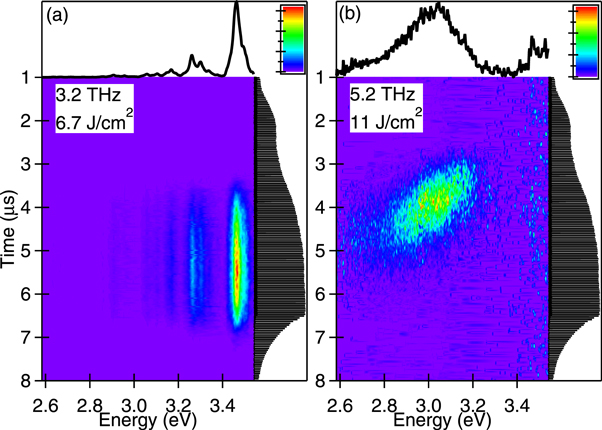
Figure 6. Time-resolved luminescence spectra of the ZnO nanoparticles for the excitation frequencies (a) 3.2 and (b) 5.2 THz. The upper panels show the corresponding time-integrated spectra. The right-hand panels show the profiles of the THz-FEL macropulse.
Download figure:
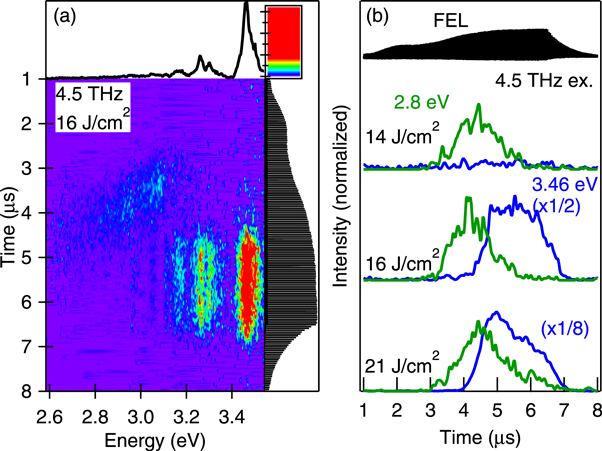
Standard image High-resolution imageThis charge build-up in the nanoparticles also caused a dramatic change in luminescence. Figure 7(a) shows a contour plot of the time-resolved luminescence spectra for an excitation macropulse energy of 9.3 mJ and an excitation frequency of 4.5 THz. These excitation conditions lie in the crossover region between the conditions in figures 6(a) and (b). The time-integrated spectrum in the upper panel of figure 7(a) shows both luminescence components. The broadband emission at 3.1 eV shifted towards the low-frequency region with time as the emission intensity decreased. After annihilation of the broadband emission, the sharp luminescence lines increase. Figure 7(b) shows the corresponding temporal evolution of the luminescence components at 3.46 and 2.8 eV at different excitation energies. The switching time of the luminescence spectrum became earlier as the excitation energy increased.
Figure 7. (a) Time-resolved luminescence spectra of the ZnO nanoparticles at an excitation frequency of 4.5 THz. The upper and right-hand panels are the corresponding time-integrated spectra and the profiles of the THz-FEL macropulse, respectively. (b) Temporal evolution of the luminescence intensity at 3.46 eV (blue) and 2.8 eV (green). The excitation macropulse energy densities are 14, 16, and 21 J cm−2. The upper panel shows the profiles of the THz-FEL macropulse.
Download figure:
Standard image High-resolution image
We focused on the luminescence lines arising at 3.46 eV and the simultaneous quenching of the broadband luminescence due to charge build-up. Electron–phonon scattering should be suppressed at high carrier concentrations due to screening effects [33] and thus the energy relaxation of hot electrons becomes slower. Furthermore, impact ionisation may also be suppressed by a decreased number of electrons in the valence band, resulting in hot electrons being re-emitted outside the nanoparticles as secondary electron emission. Some re-emitted electrons collided with the nitrogen molecules in air, resulting in an increase in the sharp luminescence line at 3.46 eV late in the micropulse train.
6. Conclusion
We observed strong excitation frequency dependence of luminescence from ZnO nanoparticles under non-resonant THz-FEL excitation. The electrons driven by THz pulses were strongly damped in the nanoparticles. In contrast, the electrons released from the nanoparticles were efficiently driven by a THz field in air and excited atmospheric nitrogen molecules and the nanoparticles selectively. The collisions of electrons returning to the nanoparticles multiplied the number of electrons and thus luminescence near the bandgap energy was observed for high frequency excitations. Charge build-up on the nanoparticles late in the micropulse train resulted in increased re-emission of electrons. This bypassed electron excitation scheme is possible in widegap semiconductor nanoparticles, where the field electron emission may be more incident than the field-induced impact ionisation. This scheme paves the way for a new nonlinear phenomenon for strong AC fields.
Acknowledgments
This work was supported by JSPS KAKENHI Grant Number 15H03579 by Industry-Academia Collaborative R&D from the Japan Science and Technology Agency, and by the Cooperative Research Program of the 'Network Joint Research Center for Materials and Devices'. We acknowledge Takayuki Kiss for fruitful discussions.