


Abstract
Nanoscale multilayer thin films of W and PC (Polycarbonate) show, due to the great difference of the components' characteristics, fascinating properties for a variety of possible applications and provide an interesting research field, but are hard to fabricate with low layer thicknesses. Because of the great acoustic mismatch between the two materials, such nanoscale structures are promising candidates for new phononic materials, where phonon propagation is strongly reduced. In this article we show for the first time that W/PC-multilayers can indeed be grown with high quality by pulsed laser deposition. We analyzed the polymer properties depending on the laser fluence used for deposition, which enabled us to find best experimental conditions for the fabrication of high-acoustic-mismatch W/PC multilayers. The multilayers were analyzed by fs pump-probe spectroscopy showing that phonon dynamics on the ps time-scale can strongly be tailored by structural design. While already periodic multilayers exhibit strong phonon localization, especially aperiodic structures present outstandingly low phonon propagation properties making such 1D-layered W/PC nano-structures interesting for new phononic applications.
General Scientific Summary
Introduction and background. There is great research interest in the field of phonon transport because this affects many fields of physics, ranging from acoustics to thermal transport. A prominent host, to study propagation of such lattice vibrations in, are thin-film multilayers. Those are represented in literature as superlattices, phononic crystals and modern metamaterials, and provide unique properties for phonon transport. Moreover, they can even be able to strongly suppress phonon modes from propagating. The reason for this is the high amount of interfaces in such materials affecting phonons in a way that they face scattering events and boundary reflection. By the superlattice structure of such materials, the dispersion is altered leading to band gaps and increased phonon mode confinement.
Main results. Since the capability of multilayers to confine phonon propagation strongly depends on the difference in material properties across an interface, two components with great difference in sound velocity and density have been chosen, namely W and polycarbonate (PC). First multilayers of this combination are presented here, which excel by large phononic band gaps and strong interface resistance. While already periodic W/PC multilayers show strong phonon mode confinement and localization, aperiodic ones are even more potent in filtering modes, thus, reducing phonon propagation.
Wider implications. This material combination enables high-quality acoustic mismatch multilayers that are not only of interest for phonon engineering applications but are also promising candidates for fully-dense, ultra-low thermal conductivity materials.
Figure A. Thin-film multilayers of W and Polycarbonate were pulsed laser deposited. With an ultrafast pump-probe reflectivity setup phonons have been excited at the surface and their transmission through the multilayer has been studied. Due to the strong acoustic mismatch between W and PC, phonon propagation through the periodic multilayer is strongly confined. This effect can even be enhanced in aperiodic multilayers. Download figure:
Export citation and abstract BibTeX RIS

Original content from this work may be used under the terms of the Creative Commons Attribution 3.0 licence. Any further distribution of this work must maintain attribution to the author(s) and the title of the work, journal citation and DOI.
General Scientific Summary
Introduction and background. There is great research interest in the field of phonon transport because this affects many fields of physics, ranging from acoustics to thermal transport. A prominent host, to study propagation of such lattice vibrations in, are thin-film multilayers. Those are represented in literature as superlattices, phononic crystals and modern metamaterials, and provide unique properties for phonon transport. Moreover, they can even be able to strongly suppress phonon modes from propagating. The reason for this is the high amount of interfaces in such materials affecting phonons in a way that they face scattering events and boundary reflection. By the superlattice structure of such materials, the dispersion is altered leading to band gaps and increased phonon mode confinement.
Main results. Since the capability of multilayers to confine phonon propagation strongly depends on the difference in material properties across an interface, two components with great difference in sound velocity and density have been chosen, namely W and polycarbonate (PC). First multilayers of this combination are presented here, which excel by large phononic band gaps and strong interface resistance. While already periodic W/PC multilayers show strong phonon mode confinement and localization, aperiodic ones are even more potent in filtering modes, thus, reducing phonon propagation.
Wider implications. This material combination enables high-quality acoustic mismatch multilayers that are not only of interest for phonon engineering applications but are also promising candidates for fully-dense, ultra-low thermal conductivity materials.
 Figure A. Thin-film multilayers of W and Polycarbonate were pulsed laser deposited. With an ultrafast pump-probe reflectivity setup phonons have been excited at the surface and their transmission through the multilayer has been studied. Due to the strong acoustic mismatch between W and PC, phonon propagation through the periodic multilayer is strongly confined. This effect can even be enhanced in aperiodic multilayers.
1. Introduction
Multilayer thin films of metals and polymers found their way into a variety of applications and are a prominent research field for further improvement [1–4]. Especially, the totally different material properties of the two components allow tuning of optical, mechanical, electrical and acoustic characteristics [5–9]. For the field of acoustics, such nanoscale multilayers are of special interest because of the high difference in density and sound velocity of the two components leading to a high acoustic mismatch at the interfaces. Thereby, the phonon propagation probability and phonon mean free path is strongly reduced, making such nanoscale structures possible candidates for phonon blocking materials [10, 11], within which also the thermal conductivity could be strongly decreased [12, 13].
To improve the outstanding acoustic properties of such material combinations, the difference of the properties of the single components has to be maximized. That makes it essential to choose hard and heavy metals together with soft and lightweight materials, such as polymers [14, 15]. For this purpose, we chose W with its very high density of 19.25 g cm−3 as metal component and PC (Polycarbonate) as the corresponding low density polymer (density of about 1.2 g cm−3), resulting in a strong acoustic mismatch and great difference of material properties. Unfortunately, the large difference in the thermal properties, e.g. melting point and thermal conductivity, makes it challenging to prepare nanoscale multilayers of those material combinations.
The aim of this paper is to show that pulsed laser deposition (PLD) allows the fabrication of such nanoscale multilayers and to study the phonon propagation in these multilayers by optical fs time-resolved pump-probe spectroscopy. To optimize the acoustic mismatch between W and PC, first the polymer properties had to be studied using different laser fluences during film growth. Then, the phonon dynamics were determined in a periodic and aperiodic W/PC multilayer by the fs pump-probe technique. Due to the acoustic mismatch at the interfaces, we expect little phonon propagation already for periodic structures. But, in aperiodic structures, phonon propagation through the multilayer should even be further reduced making such material combinations well suited candidates for new phononic applications [16, 17].
2. Experimental
For the deposition of the thin films, we used a standard pulsed KrF laser with 248 nm wavelength, 20 ns (FWHM) pulse duration, 5 Hz repetition rate, and a target-to-substrate distance of 7 cm [18]. All films were grown at room temperature in an ultra-high vacuum chamber at a base pressure around 10−8 mbar. Due to the fact that W has a melting point of 3422 °C, which is the highest for all metals [15], and a bulk thermal conductivity of 173 W mK−1 [15], a high laser fluence of 3.5 J cm−2 had to be taken during PLD. In contrast, PC has a glass transition temperature of around 140 °C and a thermal conductivity of only about 0.2 W mK−1 making it challenging not to destroy the polymeric structure during ablation with laser pulses at 248 nm [14, 19, 20]. In order to achieve this goal, the laser is run with low energy pulses, which are damped by an attenuator. Additionally, the laser beam was defocused by a lens resulting in low laser fluences in the range from 25 mJ cm−2 to 375 mJ cm−2 on the target. Compared to the deposition of W, this is a change in laser fluence of one or two orders of magnitude. In order to produce multilayers of both materials in one chamber with the same laser, a laser controlling software was written allowing to change the pulse energy during deposition, to put a movable attenuator into the beam path (only in the case of PC) and to move the focusing lens to either focus the laser beam on W or defocus it on PC. The layer thicknesses of both materials could be adjusted by the number of laser pulses used for deposition.
The deposition rates were measured in situ via an oscillating quartz crystal (Inficon SQM 160) as well as ex situ by profilometry (Dektak 150, Veeco) and x-ray reflectivity (XRR) measurements (Bruker D8 Discover with Cu-Kα-radiaton), which have been fitted by simulated spectra using LEPTOS 7 (Bruker). For insight into the structures, transmission electron microscopy was used (FEI, Titan). In order to get information about the structure of the polymer, near-edge x-ray absorption spectroscopy (NEXAFS) measurements have been conducted at a table-top device [21]. For measurements of hardness and roughness of the polymer layers, we used atomic force microscopy (AFM) in tapping mode and ambient conditions (MultiMode 8, Bruker).
For phonon dynamics measurements, we used time-resolved fs pump-probe spectroscopy with a pulse duration of 60 fs and a repetition rate of 250 kHz, from a Ti:Al2O3 laser at a wavelength of 800 nm, already utilized in previous work [9]. Since PC has a glass transition temperature of about 140 °C [14], it was in the experiment important to avoid a too strong heating. Thus we have chosen an incident power of 150 mW with a Gaussian laser spot radius of 60 μm (FWHM) leading to an optical fluence of about 5 mJ cm−2. Results of this method were fitted to a numerical finite differences time domain (FDTD) model in order to get information about wave propagation inside the system [22–24].
3. Results and discussion
According to the acoustic mismatch model in 3D [10, 11], where phonon waves are treated following Fresnel's equations, the transmission probability for phonons from material 1 to 2 or vice versa is [25]:

where ϱ1,2 are the corresponding densities of materials 1 or 2, ν1,2 the group velocities of phonons in material 1 or 2, and θ1,2 the incident phonon angles against the normal of the interface.
This transmission probability can be reduced by increasing the mismatch between the density and sound velocity of the two materials. For a great mismatch, on the one hand W has been chosen, which can be laser deposited with low surface roughness of only 0.3 nm, as shown earlier [26, 27]. On the other hand we chose PC as the corresponding counterpart in the multilayer.
For polymers, the laser deposition process is more complex than for metals and can lead to drastic changes in polymer properties [28]. Therefore, single layers of PC have been deposited at different laser fluences (up to 250 mJ cm−2) onto thin SiN substrates for NEXAFS studies at the K-absorption edge of carbon. In figure 1(a), the NEXAFS measurements are depicted for several PC thin films. Independent of the laser fluence used during deposition, all curves show the absorption maxima typical for the different bondings in PC [29]. The small deviations from bulk PC concerning the intensity of the peaks are explainable by the process of incubation at the target [30].
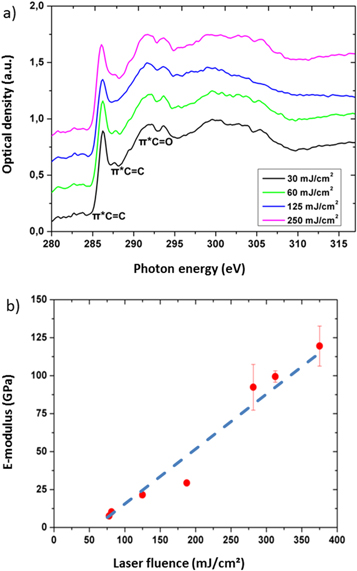
Figure 1. NEXAFS measurements in (a) show characteristic PC peaks as expected for a laser deposited polymer. Those remain stable at different laser fluences between 30 mJ cm−2 and 250 mJ cm−2. Hardness measurements in (b) indicate a rising E-modulus of PC films with rising laser fluence because of increased structural change of the polymer (dashed line is guide to the eye).
Download figure:
Standard image High-resolution imageIn order to perform hardness measurements, several PC thin films with thicknesses of some μm (to minimize the influence of the substrate) were deposited with different laser fluences on Si substrates. Figure 1(b) shows the corresponding curves of the Young's modulus E against the laser fluence indicating a drastic increase of hardness from 7.6 GPa to 120 GPa. The strong increase of the elastic modulus can be related to the more and more intense laser radiation, which leads to increasing structural changes of the PC due to the laser energy of about 5 eV used for deposition (corresponding to the wavelength of 248 nm). At lowest laser fluence, the polymer properties are best preserved.
Since the acoustic mismatch between PC and W does not only depend on the difference in their corresponding densities, but also on the difference in sound velocities, a low value for PC in comparison to the high value for W is desirable. Here, one has to distinguish between two sound velocities, mainly the longitudinal  and transversal
  that depend on the longitudinal modulus M and the shear modulus G, respectively [31]. Since both moduli are linked to the E-modulus according to
  and
and  respectively, with the Poisson's ratio ν, it is desirable to fabricate a soft polymer with a low E-modulus, which has the highest contrast to the hard W and provides therefore the highest possible acoustic mismatch. As a consequence, a low laser fluence is necessary for the multilayer preparation.
Another important criterion for the use of a W/PC multilayer as a phononic crystal is the roughness of the individual layers. As already mentioned above, W layers grown by PLD feature a rms roughness of around 0.3 nm [27, 32], but for PC layers, this was unknown so far. Again, a systematic analysis of the PC properties depending on laser fluence has been undertaken, this time concerning roughness. Figures 2(a) and (b) show exemplarily two AFM profiles of PC layers, one which has been deposited at 80 mJ cm−2 and another one, where 310 mJ cm−2 were used. It is clearly visible that a higher laser fluence results in a higher roughness, as also summarized in figure 2(c). Below 200 mJ cm−2, a relatively low roughness of around 1 nm is observed, which rises up to a value of almost 10 nm at high laser fluences.

Figure 2. Roughness investigations in PC films. (a) and (b) show AFM measurements on PC films deposited at laser fluences of 80 mJ cm−2 and 310 mJ cm−2, respectively. A corresponding graph in (c) shows a significant roughness reduction towards 1 nm at laser fluences below 200 mJ cm−2.
Download figure:
Standard image High-resolution imageFrom all these results it can be concluded that a low laser fluence results in smoother layers and well defined interfaces, which is helpful when studying phonon propagation and reflection in W/PC multilayers. Thus, for the growth of the W/PC multilayers we chose laser fluences of 3.5 J cm−2 for W and 80 mJ cm−2 for PC.
Under these conditions, several W/PC multilayers have been laser deposited and analyzed by TEM and XRR. In figures 3(a) and (b), exemplarily TEM micrographs of a cross-section of such a structure are shown in different resolutions, which indicate the high quality of the W/PC multilayers. Due to the difference in particle mass and energy during deposition, PC grows very smoothly on top of W resulting in a low interface roughness, whereas the heavy W particles intermix slightly with the PC layer. This asymmetric intermixing process has already been shown elsewhere and originates from the occurrence of energetic ions during PLD [26].

Figure 3. (a) and (b) Depict two TEM images in different magnification of a W/PC multilayer with layer thicknesses of 35 nm for PC (bright layers) and 7.5 nm for W (dark layers), respectively, showing a high quality thin film stack with smooth surfaces and a slight intermixing at the W/PC interface. (c) Shows XRR measurements (black) and corresponding simulations (red) of a W/PC multilayer with single layer thicknesses around 10 nm.
Download figure:
Standard image High-resolution imageXRR measurements performed on such multilayers support these results. In figure 3(c), the experimental curve of a multilayer with 8 periods of W and PC is depicted, which shows strong Bragg peaks even up to a scattering angle 2θ of 8° already indicating sharp interfaces. From the fit of the simulated reflection curve to the experimental curve, the layer thicknesses of W and PC of 8.3 nm and 10.5 nm, respectively, and an interface roughness of 0.8 nm and 0.3 nm for W on PC and vice versa were determined.
Such a periodic multilayer with overall thickness of about 115 nm (schematically sketched in the inset of figure 4(a)) has now been analyzed by fs pump-probe reflectivity measurements. As shown in figure 4(a), after the initial peak, the reflectivity R decreases and shows a fast oscillation within the first 50 ps. In order to obtain the frequency of this oscillation, first the background caused by thermal diffusion was subtracted from the data and then the residual reflectivity data R' were Fourier transformed. The Fourier amplitude spectrum (see figure 4(b)) shows a peak at a frequency fp of 318 GHz, corresponding to the fast oscillation. The temporal decay of this mode is characterized by a linewidth Δfp of 39 GHz.
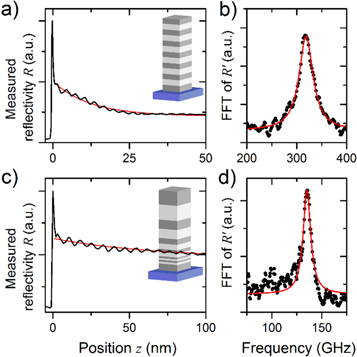
Figure 4. Pump-probe reflectivity measurements, obtained from (a) a periodic W/PC multilayer of 6 periods of 8.4 nm W (gray) and 9.1 nm PC (white) on a single layer of 9.6 nm W, deposited on a glass substrate (blue), and (c) an aperiodic W/PC multilayer with layer thicknesses from 20.2 nm W and 21.8 nm PC down to 2.5 nm W and 2.7 nm PC according to a Fibonacci series again on a 9.6 nm W layer deposited on a glass substrate. In both datasets, an exponentially decaying background (in red) is superposed by a coherent oscillation. After removal of the background, the residual reflectivity R' was Fourier transformed. (b) and (d) Show Fourier amplitude spectra corresponding to the periodic and aperiodic sample. The frequency intervals selected in these plots contain the spectral peaks corresponding to the aforementioned coherent oscillations.
Download figure:
Standard image High-resolution imageTo interpret these results, we performed numerical FDTD simulations of the experiments [33]. While the experiment is surface sensitive, this numerical approach allows looking inside the sample. Note that because the lateral size of the laser spots is much larger than the total thickness of our sample, only the z-direction, which is normal to the multilayer stack, is relevant. The numerical model implements laser light absorption, thermal diffusion and thermal expansion. The latter gives rise to elastic dynamics, which is described as well. We present our results in terms of maps of locally Fourier transformed strain  Note that the strain ε = −∂u/∂z related to a dynamic mode is not continuous at the interface between two dissimilar materials, in contrast to the stress σ = c11ε.
Adjusting the speed of sound of W to 5260 m s−1, and the value of PC to 2100 m s−1, the numerical model qualitatively reproduces the experimental findings. Here, especially the adjusted speed of sound vL = 2100 m s−1 of PC is interesting, because from material parameters alone, one would expect vL = 2600 m s−1 for PC. The reduction in the longitudinal sound velocity can be attributed to an increased temperature, which is also known for other polymers [34]. The amount of velocity change implies an average temperature increase due to heat accumulation of ∆T = 50 K above room temperature RT during the experiment, although the time interval between successive laser pulses is 4 μs. For this, one has to take into account the strong temperature dependence of the speed of sound  in PC [35]. This temperature increase of 50 K is very reasonable, because we found that a doubling of the incident laser fluence led to the destruction of the sample, because the glass temperature
  was reached [36]. In the case of W, vL = 5260 m s−1 is not far from literature values and the temperature dependence is neglibible [15].
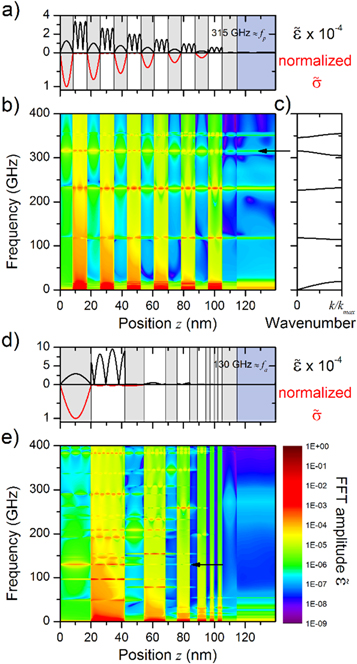
In particular, in the numerical model we find for the periodic sample a mode at 315 GHz with a linewidth of 1.9 GHz, marked by an arrow in figure 5(b). The section through the strain map at 315 GHz (see figure 5(a)) highlights the collective character of the dynamics, which extends throughout almost the whole multilayer. The superlattice structure of such a multilayer accounts for phonon reflection at the interfaces and, taking into account coherent phonons with a mean free path larger than the superlattice spacing, even interference can occur [37–39]. This leads to significant changes in the dispersion relation and band gaps form that prevent several phonon modes from transmitting [40–42]. Figure 5(c) shows a calculation of this band structure using Rytov's equation [43]. In our periodic system with its artificially fabricated acoustic band structure the dominant mode at 315 GHz can be seen as a Bloch-like eigenmode of the periodic multilayer. Such an eigenmode can coherently propagate though the superlattice only getting disturbed by scattering centers like rough interfaces or impurities, where phonons lose their phase information and transport becomes diffusive.
Figure 5. Simulated pump-probe experiment. Results corresponding to the periodic sample are shown in (a)–(c), results corresponding to the aperiodic sample are shown in (d) and (e). (b) and (e) Show maps  of locally Fourier transformed strain
  The same logarithmic color scale was used for both plots. In each plot, an arrow marking the strongest experimentally observable mode at 315 GHz for the periodic stack and at 135 GHz for the aperiodic one is included. (a) and (b) Show sections through these strain maps for specific frequencies, as well as the corresponding stress. W is shown in gray, while PC is displayed in white and the substrate in blue. (c) Shows a theoretical band structure calculation for the periodic sample.
Download figure:
Standard image High-resolution image
Note that, while the simulation suggests the excitation of dynamics in all bands (as shown in figure 5(b)), the experimental observations only confirm dynamics in the first and fourth band. Dynamics in the second (∼120 GHz) and third band (225 GHz) cannot be seen experimentally. This apparent contradiction can be understood by the details of the measurement process, in which a signal contribution carrying information about elastic dynamics builds up by integrating a product of the local electric light field  and strain
  [44]:
[44]:

In this formula, R is the measured reflectivity change and  describes in a linear approximation the material dependent change of the refractive index when being strained.
Looking at figure 5(b), one sees that the modes excited in the second and third band have strong strain amplitudes in the PC, and weak amplitudes in the W. In the PC in particular several nodal lines can be seen. Thus the spatial integration in equation (2) effectively cancels out a contribution to the measured signal. This is the first reason for the missing appearance of this dynamics in the experimental data.
Secondly, one should consider that together with the strength of the light field, the parameter  determines the sensitivity on dynamics in the different layers. The light field decays exponentially in the metallic layers on a scale of 23 nm. This implies that the method is especially surface sensitive. Note that
  is often not well-known. In total we conclude that the dominant appearance of dynamics in the fourth band not only reflects the larger amplitudes in the vicinity of the surface, but also indicates that the parameter
  is larger for W than for PC.
Let us finally consider now the dynamics in the first band. Here, frequencies are lowest, and thus the wavelengths are larger than the individual layer thicknesses. Especially no nodal line inside a PC layer appears. Therefore sensitivity to dynamics in the first band does not vanish. Note that in this article the focus lies on high frequency dynamics, associated with the fourth band. Regarding the first band, the quantitative agreement between experiment and simulation is not as good. We attribute this to transient changes of elastic properties in PC, which was not taken into account in the simulation.
If the periodicity had been fully perfect, all modes excited by the laser would have been able to pass the multilayer from the surface to the bottom. In fact, the thickness of the last W layer of 9.6 nm is slightly larger than the thickness of the preceding W layers. This is enough to detune the local resonance, and to stop the mode at 315 GHz from penetrating into the last W layer, as the section through the strain map shown in figure 5(a) reveals. This detuning finally blocks the radiation into the substrate.
In order to foster this blocking effect to the maximum, an aperiodic sample has been designed, resembling a Fibonacci series starting at the substrate after the first W(9.6 nm) layer with a PC(2.7 nm)/W(2.5 nm) bilayer and ending at the surface with PC(21.8 nm)/W(20.2 nm) (shown in figure 4(c)). Again, in the raw data (figure 4(c)), a fast oscillation can be easily identified. The Fourier spectrum shown in figure 4(d) exhibits a corresponding peak at a frequency of fa = 135 GHz, whose linewidth is ∆fa = 9 GHz.
But, in contrast to the periodic multilayer, the simulated strain map of this aperiodic sample shows (see figure 5(e)) that at a given frequency the elastic dynamics is almost always confined to a few layers only, because the missing long range symmetry only allows for local resonances. For instance, the dynamics at fa = 135 GHz experimentally found in the second sample can be explained by the simulation as a resonance (frequency 129 GHz, line width 1.1 GHz) of the top-most W layer (see section in figure 5(d)). Note that due to an optical penetration depth of 23 nm, the laser beam is almost fully absorbed within the first W layer. In this thick layer, the resonances have a lower frequency than in the following thinner layers. Therefore, the thin layers effectively block the passage of elastic waves coming from the surface, and radiation into the substrate is suppressed in a wide frequency range, which is not only an important result for phononics, but is also discussed as a route to minimize thermal transport [45].
This finding is supported by a closer look at the experimentally determined line widths in the Fourier-regime (shown in figures 4(b) and (d)). In contrast to the simulation, where perfectly flat interfaces were assumed, experimental interface roughnesses give rise to additional scattering and thus lead to a cumulative broadening of the line width with each passed interface. One finds in the periodic case a ratio fp/Δfp of about 9.6, whereas the aperiodic sample features a higher value of fa/Δfa of 15. This increase by a factor of 1.5 can be interpreted as a fingerprint of a reduced accumulated interfacial scattering: In the aperiodic sample, the mode simply extends over less interfaces than in the periodic sample.
Furthermore, the interfaces are also decisive for the thermal conductivity of the material. Using a simple heat conduction model one can cautiously estimate the thermal conductivity of the W/PC multilayer. Using the incident laser power P0 of 150 mW deposited within the Gaussian laser spot with radius r of 60 μm on the multilayer surface and the measured temperature increase of about ∆T = 50 K, the cross-plane thermal conductivity given by

where dtot is the total thickness of the multilayer, should be in the order of about 0.03 W mK−1.
This estimation is indeed reasonable: in a multilayer one can estimate the thermal conductivity by

where dW and dPC are the layer thicknesses of the W and PC layers, respectively, n is the number of interfaces and Rbd is the interfacial thermal resistance [46]. With the thermal conductivities of κW = 167 W mK−1 and κW = 0.2 W mK−1 [14, 15], and a typical interfacial thermal resistance Rbd ≈ 10−7 m2K W−1 for thin films [10, 47, 48], a value for the thermal conductivity of 0.08 W mK−1 is evaluated, which is in the same order of magnitude. Both values indeed indicate that the thermal conductivity of the W/PC multilayer should be very low.
4. Conclusion
In this work we have shown that nanoscale W/PC multilayers are appropriate candidates for acoustic layered materials due to the great difference in material properties of the adjoining components. In order to fabricate such structures with high quality, the PLD process had to be investigated in detail, especially concerning the deposition of the polymer.
At low laser fluences, PC thin films show all characteristic peaks in the NEXAFS spectra, lowest hardness and minimum layer roughness. In the W/PC multilayers, the PC/W interfaces are sharp (PC on W), while slight intermixing occurs at the other interface, as seen in the XRR and TEM measurements.
The fs pump-probe reflectivity measurements on periodic W/PC structures show strong phonon mode confinement and phonon localization, restricting the propagation of coherent phonons according to the band structure defined by the periodicity of the multilayer. In order to improve this phonon mode confinement, aperiodic multilayers have been fabricated, where the aperiodic structure filters even more modes especially from the coherent regime and thus further reduces phonon propagation.
In summary, the nanoscale thin film synthesis of such different components as W and PC in multilayers is proved to be challenging, but lead to an interesting new material combination. Such structures are promising for future applications as two-dimensional phononic crystals and might be also a promising approach as a very-low thermal conductivity material.
Acknowledgments
We would like to thank Volker Radisch for his support at the focused ion beam. This work was supported by the Deutsche Forschungsgemeinschaft (SFB 1073: 'Atomic scale control of energy conversion' Project A02 and A03).