

Abstract
Coherent anti-Stokes Raman scattering (CARS) and, in particular, femtosecond adaptive spectroscopic techniques (FAST CARS) have been successfully used for molecular spectroscopy and microscopic imaging. Recent progress in ultrafast nano-optics provides flexibility in generation and control of optical near fields, and holds promise to extend CARS techniques to the nanoscale. In this theoretical study, we demonstrate ultrafast subwavelentgh control of coherent Raman spectra of molecules in the vicinity of a plasmonic nanostructure excited by ultrashort laser pulses. The simulated nanostructure design provides localized excitation sources for CARS by focusing incident laser pulses into subwavelength hot spots via two self-similar nanolens antennas connected by a waveguide. Hot-spot-selective dual-tip-enhanced CARS (2TECARS) nanospectra of DNA nucleobases are obtained by simulating optimized pump, Stokes and probe near fields using tips, laser polarization- and pulse-shaping. This technique may be used to explore ultrafast energy and electron transfer dynamics in real space with nanometre resolution.
Export citation and abstract BibTeX RIS

Content from this work may be used under the terms of the Creative Commons Attribution 3.0 licence. Any further distribution of this work must maintain attribution to the author(s) and the title of the work, journal citation and DOI.
Recent progress in nano-optics has led to many exciting applications that benefit from nanoscale subwavelength resolution, such as imaging cancer cells, biosensing, and designing nanoscale devices [1]. Tip- and surface-enhanced techniques that use metal nanostructures offer nanoscale resolution due to their subwavelength size. It is desirable to obtain simultaneous nanometre spatial and ultrafast temporal resolution to investigate the dynamics of proteins, surface water, plasmon propagation, energy and charge transfer in biomolecules, and other ultrafast nanoscale processes [2].
Raman spectroscopy provides molecular vibrational fingerprint information. In coherent Raman spectroscopy, such as coherent anti-Stokes Raman scattering (CARS) [3–5], vibrational coherence is used to enhance molecular signals compared to weak spontaneous Raman spectroscopy. The increased sensitivity was used to develop CARS microscopy, which allowed three-dimensional imaging capability [6–8]. Another approach to enhance Raman signals is using plasmonic nanoantennas for surface-enhanced Raman scattering (SERS) [9–12] and tip-enhanced Raman scattering (TERS) [13, 14]. Combination of the coherence and surface enhancements may further improve sensitivity, and has been realized in surface-enhanced CARS (SECARS) [15–21] and tip-enhanced CARS (TECARS) [22, 23]. Unfortunately, CARS often suffers from a large nonresonant background, but various approaches have been developed to suppress it. Optimal laser pulse shapes were designed in coherently-controlled CARS [8, 24–27], time-resolved CARS (tr-CARS) [28–31], and femtosecond adaptive spectroscopic techniques (FAST CARS) [32]. Recently we demonstrated time-resolved surface-enhanced CARS (tr-SECARS), which allowed suppressing background and enhancing molecular signals using randomly aggregated gold nanoparticles [33].
In this theoretical study, we apply ultrafast near-field control to two-pulse tr-CARS using two silver tips as spatially separated optical nanoantennas. The two tips couple at different angles to a curved nanosphere waveguide and provide nanolocalized enhanced near fields for CARS (figure 1). It is important that the nanostructure is not too simple so that it has several overlapping modes which may be excited and controlled by variable control knobs. The proposed nanostructure provides enough complexity to realize the spatiotemporal control. On the other hand, the nanostructure should not be too complex so that it provides selectivity and does not allow exciting too many modes which are hard to control. Hot spots have previously been widely used in static applications such as SERS. Here we designed a nanostructure with controllable time-dependent hot spots which allow observing surface-enhanced dynamics. For example, using this nanostructure it is possible to use one hot spot to excite a molecular system at one point in space (r1) and one point in time (t1) and then to use another hot spot to probe the system at another point in space (r2) and in time (t2). Such space-time-resolved spectroscopy may be very useful for single molecule dynamics investigations.
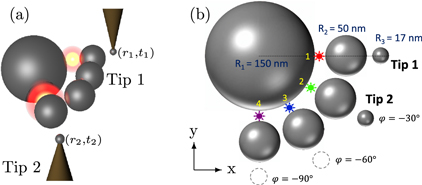
Figure 1. Dual-tip plasmonic nanostructure made of self-similar nanolens antennas connected by a waveguide. (a) Side and (b) top view. The smallest nanospheres, attached to scanning probe microscope tips, provide controlled subwavelength excitation and detection. Near-field hot spots generated in the gaps between the 50 and 150 nm spheres are labelled 1–4, and highlighted by red, green, blue and purple stars, respectively. Cytosine, thymine, adenine, and guanine are placed in these hot spots, respectively. The position of tip 1 is fixed. The position of tip 2 is varied between values of the angle  : no tip 2,
  ,
,  , and
, and  . The nanostructure is excited by x-polarized ultrashort laser pulses propagating along the z-direction. The dynamics of near fields is controlled by changing the position of tip 2 and by laser pulse shaping.
Download figure:
Standard image High-resolution imageThis nanostructure design is analogous to plasmonic circuits made of two dipole nanoantennas coupled by a transmission line [34, 35]. Here, we model self-similar chains of silver spheres as nanoantennas [36]. The curved waveguide geometry allows compact lumping of antennas into a small region of space. Optimization of this dual-tip-enhanced CARS (2TECARS) approach requires spatiotemporal overlap of the pump, Stokes and probe fields using position-dependence of the tip enhancement and laser pulse shaping. We simulate 2TECARS spectra of DNA nucleobases placed in the gaps of the nanoantennas and demonstrate hot-spot-selective signal generation and spectral control. The dual-tip plasmonic nanostructure made of silver nanospheres is shown in figure 1. Figure 1(a) shows a side view with two 17 nm spheres attached to the moving tips of a scanning probe microscope. The tip mounts are made of a non-metallic material (e.g., silicon) and do not influence the nanostructure response. The structure of 50 and 150 nm spheres may be fabricated on a surface by chemical deposition with manipulation by an AFM [37]. Figure 1(b) shows a top-view schematic (tip mounts are not shown) with specified geometrical parameters where four 50 nm spheres are used to connect the 17 and 150 nm spheres to form self-similar nanolens antennas with orientations at  ,
,  ,
,  and
and  . These four spheres also form a curved waveguide connected to the 150 nm sphere.
The sphere sizes were chosen according to the design of the self-similar nanolens [36]. The sphere radii satisfy  . The distance between the surfaces of the consecutive spheres is
  . The near-field response of the nanostructure was calculated using the multiple elastic scattering of multipole expansions (MESME) approach [38, 39] in the range from 200 to 700 nm with x-polarized incident plane waves for all tip 2 positions. Each incident field
  was multiplied by a response function
  , where m corresponds to a particular tensor component.
  was used in the tip-enhanced CARS simulations. The Gaussian pump/Stokes pulses were ∼6 fs in duration corresponding to ∼2400
  bandwidth. The Gaussian probe pulse had a bandwidth of 3
  . Pulse durations were held constant during the scan of the center frequency, with the bandwidth changing accordingly. Gaussian laser pulse shapes
 ![${{E}_{k}}(\omega )={\rm Exp}[-2{\rm ln} (2){{\left( \frac{\omega -{{\omega }_{ko}}}{\Delta {{\omega }_{k}}} \right)}^{2}}],\quad (k=1,2)$](https://content.cld.iop.org/journals/1367-2630/16/8/083004/revision1/njp497476ieqn16.gif) were used to induce the CARS signals, where k = 1, 2 stands for pump and Stokes, respectively.
were used to induce the CARS signals, where k = 1, 2 stands for pump and Stokes, respectively.
The picosecond probe pulse was modelled by  otherwise, where
  , c is the speed of light in vacuum,
  is the center frequency of the kʼth pulse, and Δωk is the corresponding bandwidth. The Raman data for linewidths, relative cross sections, and resonance frequencies was obtained for DNA nucleobases from [40]. The dielectric function of silver was taken from [41]. Vacuum permittivity was used to describe the surrounding dielectric medium. Additional simulations were performed in air (See figures 1 and 2 in Supplementary Information), but did not show significant differences. Another set of simulations was also performed using gold instead of silver. Reduced surface enhancement factors were obtained, but the CARS spectra did not show significant changes. The simulations were performed in Mathematica® 8.
In figure 1(b), four hot spots in the gaps between the 50 and 150 nm spheres are labeled 1–4 and highlighted by red, green, blue, and purple stars, respectively. Tip 1 is fixed and forms the receiving antenna for the x-polarized light localized at spot 1. The x-polarized spectral response of this nanostructure without tip 2 at spot 1 is shown in figure 2(a) (black solid line), in which several resonances are observed with the strongest peak at 440 nm. The corresponding temporal near-field profile at spot 1 due to the excitation by x-polarized 6 fs incident laser pulses centered at 440 nm is shown in figure 2(b) (black line), while this response is compared to the response of a nanostructure without tips at spot 1 (red line) and to the original incident laser pulse (blue line), which shows that there is a factor of 8 enhancement of the electric field amplitude of the nanostructure without tips compared to the incident laser pulse and an additional enhancement due to the presence of tip 1. This order of magnitude field enhancement results in several orders of magnitude enhancement in the nonlinear optical signals such as CARS. The enhancement may be further improved by optimizing the nanostructure design, e.g., decreasing the gap size.
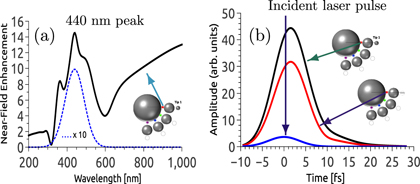
Figure 2. Calculated near-field enhancement in frequency and time domains. (a) x-polarized spectral response of the nanostructure without tip 2 in hot spot 1 due to excitation by the incident x-polarized ultrashort Gaussian laser pulse (dashed blue (10x)). (b) The corresponding x-polarized temporal response (black) compared to the response of a nanostructure without tips (red) and to the incident laser pulse (blue). 17 nm tip 1 provides an additional near-field enhancement.
Download figure:
Standard image High-resolution imageSpatiotemporal control of the near-field response will allow localizing and controlling CARS signals. Therefore, we next investigate the near-field pulse shapes from other hot spots. Time-dependent snapshots of the x- and y-polarized spatial electric field distributions for the nanostructure with tip 2 at  are shown in figures 3(a)–(c) and 3(d)–(f), respectively. These snapshots are taken when the peak of the incident x-polarized 6 fs Gaussian laser pulse centered at 440 nm is
  fs before the time of the maximum plasmonic response, which is at 2.35 fs (figures 3(a) and (d)) in the simulation time scale, at the maxima of the hot spots ∼0.3 fs after the peak of the pulse at 3.52 and 3.36 fs (figures 3(c) and (f)), and at an intermediate time 2.84 fs (figures 3(b) and (e)). Figures 3(a)–(c) show two strong hot spots which correspond to the receiving antenna at spot 1 and the emitting antenna formed by two medium-sized spheres at spots 3 and 4. As expected the antennas focus the incident light in the gaps between the spheres. In addition, there is a weaker peak at spot 2. Figures 3(d)–(f) show the temporal evolution of two weak fields at spots 2 and 3, and of a stray field located in between the small and medium size spheres of the emitting antenna. We also include two movies which show the full spatiotemporal dynamics (see Supplementary Information). The movies and figure 3 show that hot spots appear in positions labeled 1–4 in figure 1. Additional hot spots also appear in other places but we assume that the molecules are only present in spots 1–4. This can be achieved, for example, by using a coated large sphere in experiments.
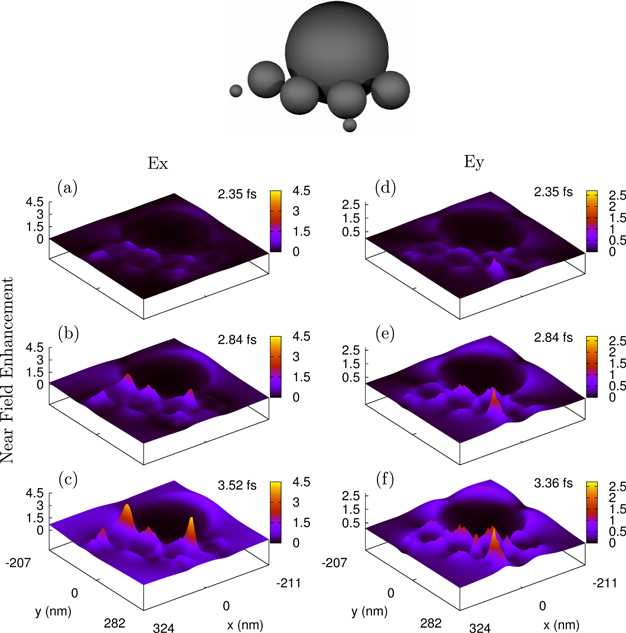
Figure 3. Time-dependent snapshots of the x- (a)–(c) and y-polarized (d)–(f) spatial near-field enhancement distributions in the x-y plane of the nanostructure with tip 2 at  excited by x-polarized 6 fs, 440 nm Gaussian laser pulses.
Download figure:
Standard image High-resolution imageIn addition, we show temporal field profiles at spots 1–4 for various nanostructures with different tip positions (figure 4). These profiles give the same information as the movies but allow observing the spatiotemporal dynamics more clearly such as relative temporal shifts of peaks from different hot spots. These shifts reveal complex ultrafast plasmon propagation and depolarization effects. Figure 4 shows the temporal near field amplitude profiles due to the excitation by x-polarized 6 fs Gaussian laser pulses centered at 440 nm from hot spots 1–4 without tip 2 (a,b), and with tip 2 at  (c,d) and
  (e,f). The corresponding nanostructure geometries are sketched in the left column. The x-(Ex) and y-polarized (Ey) field profiles are shown in the middle and right columns, respectively. Complex near field temporal dynamics due to plasmon propagation and scattering is observed. Figures 4(a), (c) and (e) show x-polarized fields where hot spot 1 (red) has the largest amplitude. Figures 4(b), (d) and (f) show y-polarized fields where spot 3 has the largest peak amplitude. These y-polarized fields are due to depolarization of the x-polarized fields propagating along the waveguide from spot 1. Hot spot 4 becomes strongest after ∼3.5 fs in figure 4(f). These ultrafast near field pulses are broad enough to excite vibrational coherences of typical molecules and serve as both pump and Stokes pulses in the CARS process. The temporal profile of the picosecond probe pulse is not significantly affected by the nanostructure and is not shown. However, the spectral profile of the probe is proportional to the spectral response profile such as that shown in figure 2(a). The spatiotemporal overlap of the pump/Stokes and probe pulses control the intensities of CARS signals, but the near field pulses in figure 4 may also be used to trigger electronic and structural changes in molecules and to induce photochemical reactions. These pulses may be delayed in time with respect to the CARS pulses. 2TECARS may therefore be used as a nanoscopic ultrafast probing technique to monitor these processes.
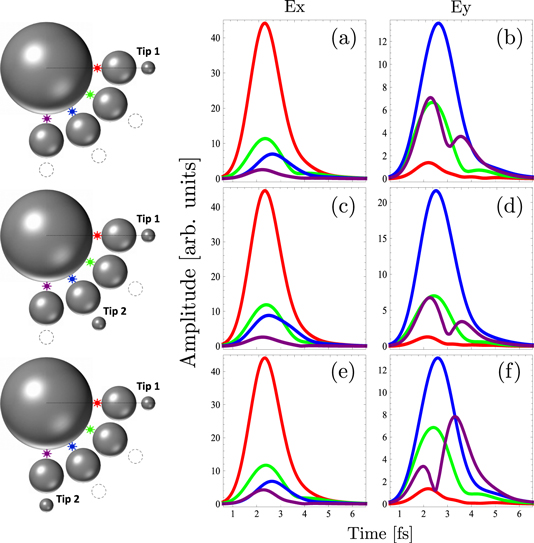
Figure 4. Calculated temporal near field amplitude profiles of the pump/Stokes pulse centered at 440 nm from hot spots 1 (red), 2 (green), 3 (blue), and 4 (purple) without tip 2 (a), (b) and with tip 2 at  (c), (d) and
  (e), (f). The nanostructure geometries are shown in the left column. The x- (a), (c), (e) and y-polarized (b), (d), (f) fields are induced by x-polarized incident Gaussian 6 fs laser pulses. The pulse shapes reveal complex plasmon propagation dynamics which depend on the position of tip 2.
Download figure:
Standard image High-resolution imageA further insight into the complex spatiotemporal dynamics may be obtained by investigating the nanostructure response in the spectral domain. Figure 5 shows the spectral amplitude and phase profiles which correspond to the tensorial profiles in figure 4. These spectral profiles reveal the depolarization effects via amplitudes and the propagation via phases. The depolarization effects arise from the tensonal response of the nanostructure, i.e., excitation by the x-polarized electric field of the incident laser pulse generates x-, y- and z-polarized local fields. For example, the x-polarized amplitudes in figures 5(a), (e) and (i) are strongest in spot 1 (red) and those in figures 5(b), (f) and (j) are strongest in spots 3 and 4, depending on the wavelength and the position of tip 2. This is because dipole antennas formed by two or more spheres are oriented at various angles to the polarization of the incident field and the antennas are coupled via the large sphere. The projection of the induced dipoles onto the y-polarization is strongest for spot 3. Therefore, it shows strong hot spots in figures 4 and 5. The y-polarized field in spot 3 is largest in figure 5(f) because the corresponding nanostructure has an emitting antenna at this spot formed by tip 2. The spot 3 is strongest in figures 4(b), (d) and (f) because of the largest projection of the induced dipoles on the polarization of incident fields.
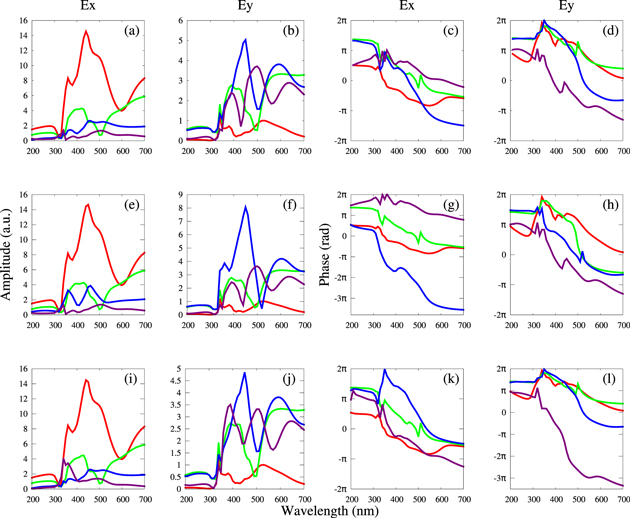
Figure 5. Spectral near field amplitude and phase profiles of the nanostructure responses from hot spots 1 (red), 2 (green), 3 (blue) and 4 (purple) without tip 2 (a)–(d), and with tip 2 at  (e)–(h) and
  (i)–(l). The corresponding nanostructure geometries are shown in figure 4. The first and third columns correspond to the x-polarized fields and the second and fourth columns correspond to the y-polarized fields. These fields are induced by an incident, x-polarized Gaussian 6 fs laser pulse. The profiles give an intrinsic picture of the propagation and depolarization effects.
Download figure:
Standard image High-resolution imageThe analysis of the spectral phase profiles shows that all the phases have slopes that corresponds to various time delays. Therefore, the phases reveal the propagation effects. In particular, the slope of the phases of spots 3 and 4 are the steepest in figures 5(g) and (l), respectively. That means the largest pulse delay in these spots, which reveals that more energy arrives at a later time due to propagation from nearby spots. Also, there is a noticeable nonlinear shape of the phase plots in these spots, which reveals dispersion effects due to plasmon propagation. Such effects can be compensated for by pulse shaping [35, 42]. The emitting antennas in spots 3 and 4 amplify the propagated fields and reveal the dynamics.
Figures 4(b), (d) and (f) show a distinctive two-peak shape for spot 4 (purple), which are different from those of other spots. When tip 2 is positioned at  , the relative ratio of these peaks switches compared to other positions of tip 2. The two-peak temporal shape can be understood using the corresponding spectral profiles in figures 5(b), (f) and (j), which show a double peak spectra for spot 4. The two peaks have asymmetric shapes and form a dip, which is typical of Fano resonances that have been previously investigated in similar nanostructures [43–46].
The near fields are modified by the moving tips of the nanostructure and by laser pulse shaping. This provides several control parameters for manipulating CARS signals. The control knobs allow controlling the spatiotemporal field dynamics, e.g., turning various hot spots on and off at specific times. For example, the polarization control allows separating the excitation spot 1 from the probing spot 3 or 4 by varying the excitation and observation field polarizations. We first use these parameters to isolate CARS nanospectra of DNA nucleobases. In supplementary information, we obtain CARS spectra of pyridine at different spots, and demonstrate that the effects seen are not simply due to different molecular responses. In our work, the third-order nonlinear polarization is modelled by

where  , the resonant third-order nonlinear susceptibility, is given by

and S12 is

Ak
is a constant related to the Raman cross-section,  gives the Raman line halfwidth, and
  gives the kʼth vibrational frequency. In calculations with single broadband pump/Stokes laser pulses, we set
  , with E sufficiently broad to excite the desired vibrations. The non-resonant background was not included in this work. Interference between signal and background is common, but many methods have been developed to minimize the non-resonant background. Our tr-CARS approach is especially useful for background suppression [30, 31]. The CARS signal is given by
  The background can be suppressed by delaying the picosecond probe pulse with respect to the femtosecond pump/Stokes pulses. We have previously shown application of tr-CARS to pyridine molecules on the surface of gold nanoparticles to enhance the Raman signals and to suppress the nonresonant background [33]. Similar effects are expected in the present case of nucleobases on the surface of silver nanoparticles.
Figure 6(d) shows the simulated CARS spectra of cytosine (red), thymine (green), adenine (blue) and guanine (purple) obtained using x-polarized Gaussian 6 fs pump/Stokes (440 nm) and picosecond probe (480 nm) laser pulses without a nanostructure. All the spectra in figures 6 and 7 were normalized to the maximum of the strongest guanine peak at 942  . Figures 6(a)–(c) show CARS spectra of nucleobases placed in the hot spots of the nanostructure described above. Cytosine, thymine, adenine, and guanine were placed in spots 1, 2, 3, and 4, respectively. Figure 6(a) shows the x-polarized CARS spectra from the nanostructure without tip 2. CARS signal of cytosine in spot 1 dominates (red). In figure 6(b), for tip 2 at
  , the y-polarized CARS spectra of cytosine and thymine are suppressed and spectra of adenine (blue) and guanine (purple) dominate, with adenine making the largest contribution. In figure 6c for tip 2 at
  , adenine (blue) dominates (y-polarized). These spectra illustrate the use of tip 2 as a nanocontrol parameter.
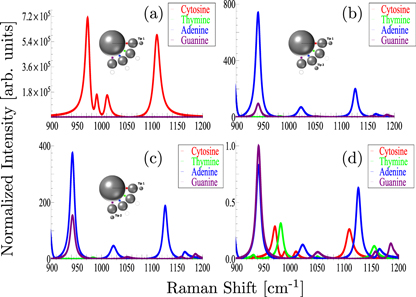
Figure 6. Simulated 2TECARS nanospectra: x-polarized without tip 2 (a) and y-polarized with tip 2 at  (b) and
  (c). (d) CARS spectra of nucleobases without nanostructure. Cytosine, thymine, adenine and guanine are placed in spots 1–4, and marked by red, green, blue and purple, respectively. Tip 2 is a nanoscale control 'knob' for CARS spectra. The intensities are normalized to the strongest guanine peak at 942
  , and represent the enhancement factors.
Download figure:
Standard image High-resolution image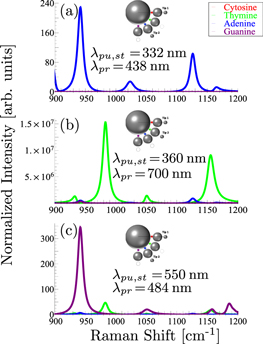
Figure 7. The ratio of y-polarized spectral peaks of adenine to guanine is maximized in (a) and minimized in (c), and of thymine to other nucleobases is maximized in (b) by varying the pump/Stokes and probe pulse center wavelengths and tip 2 position. The intensities are normalized to the strongest guanine peak at 942  in figure 6(d), and represent the enhancement factors.
Download figure:
Standard image High-resolution imageTo investigate the origin of the spatial dependencies of 2TECARS signals in figure 6, we performed similar simulations on pyridine molecules located at every hot spot with the pump/Stokes and probe pulses having the same parameters as in figure 6. Similar effects of tip position seen for the nucleobases were also observed for pyridine (See figure 3 in Supplementary Information). Therefore, the effects are predominantly due to the structure response.
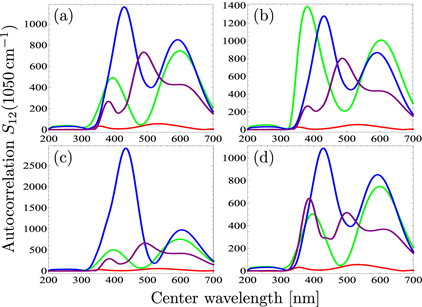
Next, we simulate the spectral control of 2TECARS signals by laser polarization- and pulse-shaping. Laser pulse shaping provides additional 'knobs' for controlling ratios of spectral peaks. We achieved spectral control of CARS signals by varying the center wavelengths of the incident laser pulses in figure 7. Ratios of the y-polarized CARS signals of adenine to guanine, and of thymine to other nucleobases are maximized in figures 7(a) and (b), respectively, by varying both the pump/Stokes and the probe center wavelengths. The y-polarized spectrum of guanine (purple) is amplified using the same strategy in figure 7(c). For analysis, these results can be understood by examining the near field pulse shapes and overlaps via S12 cross-correlation in (3). Figure 8 shows the pump/Stokes pulse  autocorrelation plots as a function of the center wavelength for the nanostructure without tip 2 (8a), and for tip 2 positions at
  (8b),
(8b),  (8c) and
  (8d) from different spots in the nanostructure. The average value
  was chosen to simplify the analysis. Figure 8 reveals the optimal spectral range of the response for controlling CARS spectra by varying the pump/Stokes pulse center wavelength. For example, figure 8(c) can be used to select the suitable wavelength range of the pump/Stokes pulses in order to achieve switching between adenine (figure 7(a)) and guanine (figure 7(c)) signals with tip 2 at
  . Figure 8(c) shows that the intensity (autocorrelation) of the pump/Stokes pulse is larger at spot 3 (adenine) for most of the spectral range, except in the region around 500 nm. Therefore, 332 nm and 550 nm center wavelengths were chosen to achieve the switching. Another control parameter is given by the probe pulse center wavelength and is directly proportional to the nanostructure response. Analysis of these plots allows optimizing parameters to control nanoscopic CARS signals and gives a clear understanding of the control mechanisms.
Figure 8. Autocorrelation  of the y-polarized near field pump/Stokes pulses as a function of their center wavelength without tip 2 (a), and for tip 2 at
  (b),
(b),  (c), and
  (d) from spots 1 (red), 2 (green), 3 (blue), and 4 (purple). These plots are used to optimize ratios of 2TECARS signals from different spots and explain the results shown in figures 6 and 7,
Download figure:
Standard image High-resolution image
The proposed nanostructure provides a nanosphere analogue of the dual-antenna plasmonic circuit [34, 35] as an example of a controllable plasmonic system for space-time-resolved ultrafast nanoscopy. These and other geometries based on optical nanoantennas have been experimentally realized [47–51]. We note that the self-similar nanolens antenna has another resonance in the gap between the 17 and 50 nm spheres which has a larger enhancement [36]. However, we assume that there are no molecules in that hot spot. Experimentally this may be achieved, for example, by coating only the large sphere with molecules. In this work, the primary goal was not the maximization of the signal strength but rather the spatiotemporal selectivity and controllability of the nanostructure response and nanoscopic CARS signals. We chose the simplest nanostructure geometry that would be easiest for experimental fabrication and that would have the required properties for the spatiotemporal control, such as the presence of several spatially overlapping near-field modes. For example, the waveguide made of medium-sized silver spheres provides several modes which interfere and may be controlled by the incident light [42]. Such a waveguide may also be made of the four smallest 17 nm spheres. Then in order to achieve the spatiotemporal control in two coupled self-similar antennas it would be necessary to add one additional medium-sized 50 nm and one large 150 nm sphere using two scanning tips. Moving these two spheres with respect to the small-sphere waveguide would achieve similar effects as presented in this work and possibly a stronger signal enhancement. This configuration will be investigated in more detail in the future. The main advantage of the proposed nanostructure is a compact design of several plasmonic functional elements lumped together in a small region of space. Our nanostructure has truly nanoscale dimensions and allows investigating ultrafast nanoscopic phenomena such as charge and energy transport with ultrashort temporal and spatial resolutions. Also, Fano resonances may provide advantages in light focusing and control [44, 52]. Recently, Fano resonances in plasmonic nanoclusters were used to enhance optical four-wave mixing signals [53].
The unique nanostructure design enables several control knobs such as polarizations and center frequencies of the laser pulses, and the positions of the tips. For example, the curved geometry of the waveguide made of medium-sized spheres connecting two antennas with perpendicular polarizations allows using polarization of incident pulses as a control knob. Such a geometry design is rather general in a sense that it may be possible to use antennas and waveguides with different shapes (made, for example, of different numbers of spheres) to achieve similar effects. Using two scanning tips and pulse shaping, the CARS signal enhancement factors (EFs) of up to 107 were obtained (figure 7(b)). This corresponds to the expectations based on the  near field enhancement in the hot spots using (1)–(3). Here, we focus on separating CARS signals from different hot spots and on increasing the contrast rather that optimizing EFs. In principle, the EF for TECARS can reach
  for the strongest hot spots with the near fields enhanced by
  in the self-similar nanolens antenna [36]. CARS signals may be further increased by coupling two nanolens antennas. In addition, the results presented here can be generalized to remove one or both tips by building the nanostructures with the small spheres on the substrate, with all different arrangements manufactured on one surface.
Coherent control [54, 55] by phase- and amplitude- laser pulse shaping [56] may be used to control spatiotemporal plasmon dynamics in nanostructures [42, 57–60] and may further improve the EFs and performance of ultrafast nanoscopic space-time-resolved spectroscopy [61]. This approach may be applied to other nonlinear optical techniques [62] such as surface-enhanced four-wave mixing [63], and coherent two-dimensional nanoscopy [64]. Thus, multiparameter optimization may improve EFs and contrast of nonlinear signals, and will be considered in future work.
In conclusion, we propose a new approach to probing ultrafast nanoscale phenomena using ultrafast 2TECARS nanoscopy. Dual-tip-enhanced coherent Raman spectra of DNA nucleobases separated on a nanometre scale are obtained using a combination of two scanning tips and laser pulse shaping. This technique provides useful control knobs for manipulating CARS nanospectra and will further advance the field of nanobiophotonics.
Acknowledgments
We acknowledge the support of the Office of Naval Research and the Welch Foundation Grant No. A-1547. We thank Professor Marlan O Scully for helpful discussions. C W B is supported by the Herman F Heep and Minnie Belle Heep Texas A  M University Endowed Fund held/administered by the Texas A
  M Foundation. A V S thanks the National Science Foundation (PHY-1307153).