


Abstract
We report on specific heat and resistivity measurements under hydrostatic pressure on the quasi-one dimensional metal TlxV6S8. We studied the interplay between the low temperature superconducting (SC) ground state and a high temperature charge density wave (CDW) instability. We observed a clear dependency of the physical properties of TlxV6S8 on the Tl concentration x. The CDW anomaly is present in all investigated samples that are strongly enhanced at half Tl filling, x = 0.47. This is also the only composition for which no signature of superconductivity is observed. The specific heat results regarding the SC phase in Tl0.63V6S8 suggest that this compound is a highly anisotropic, weak coupling superconductor. Pressure suppresses both SC and CDW transitions to lower temperatures. Nevertheless, as the CDW gap is closed at a critical pressure pc, the increase in the density of states leads to a small enhancement of Tc suggesting that SC and CDW compete for parts of the Fermi-surface.
Export citation and abstract BibTeX RIS

Content from this work may be used under the terms of the Creative Commons Attribution 3.0 licence. Any further distribution of this work must maintain attribution to the author(s) and the title of the work, journal citation and DOI.
1. Introduction
For systems which display both superconductivity and charge-density wave (CDW) phenomena, superconductivity sets in from an already gapped normal state. It is important to understand whether the electron–hole gapping is detrimental or favorable to the SC state formation. The opening of a partial dielectric gap has been shown to cause destructive effects on Cooper pairing [1–3] and, consequently, a direct way to enhance the superconducting (SC) transition temperature, Tc, would be to avoid the CDW formation. The model of partial gapping [4, 5] explains many of the characteristic features observed experimentally in CDW superconductors. However, there is also an opposite standpoint, according to which Tc is enhanced by the singular electron density of states (DOS) near the dielectric gap edge [6–8]. This latter scenario, based on the model of the doped excitonic insulator with complete gapping [9] has not been verified experimentally so far.
The interplay of superconductivity and CDW instability remains therefore of great importance both theoretically and experimentally. In the recently discovered pnictide superconductors SC also occurs at low temperature from a gapped spin density wave-like state, broadening the interest in this problem.
In this paper we present a thorough investigation of TlxV6S8 at atmospheric pressure employing specific heat, resistivity and magnetization measurements together with a resistivity study under hydrostatic pressure.
TlV6S8 is a metallic system with a quasi-one-dimensional (1D) structure based on hexagonal cells of the Nb3X4-type (P63 space group) [10]. VS6 distorted octahedra are connected by shared edges and faces building up large hexagonal tunnels along the c-axis (figure 1). Tl-atoms are confined inside these tunnels forming quasi 1D chains [10]. In addition, V-atoms are arranged in zigzag chains possessing a rather small inter-atomic distance (0.286 nm) comparable to the one found in the pure vanadium metal (0.261 nm). These zigzag-chains also run along the c-axis and are well separated from each other.
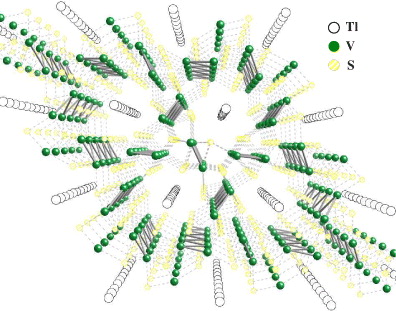
Figure 1. TlV6S8 crystal structure. VS6 octahedra linked together forming large hexagonal tunnels along the c-axis. V–V zigzag chains are well separated from each other.
Download figure:
Standard image High-resolution imageHowever, little is known about the electronic structure of this compound and scarce previous reports regarding its physical properties are often not in good agreement, mainly due to the increased difficulty of growing high quality samples. The electronic 1D character is indicated mainly by the lattice structure and supported by band structure calculations.
A slight upturn of ρ(T) at T = TCDW with 150 K < TCDW < 170 K [11] and a simultaneous drop in the ac magnetic susceptibility χ(T) [12] indicate a loss in DOS. This, coupled to a first-order structural phase transition revealed by x-ray measurements [13] and a sharp anomaly accompanied by latent heat in differential-scanning calorimetry (DSC) [11, 12] in the same temperature range, indicate the possible formation of a CDW instability in this compound. This is corroborated by electronic band structure calculations which indicate nesting conditions for at least four characteristic wave vectors [14]. Preliminary electron diffraction measurements reveal the existence of satellite spots at T < TCDW in addition to the main diffraction spots observed at low-T [11], similar to what was found for the CDW-compounds Nb3Te4 [15] and InNb3Te4 [16]. Moreover, the formation of a CDW state was suggested also for the iso-structural compounds AV6S8 with A = In, K, Rb and Cs and also for V6S8. This is an indication that the CDW instability might be a general feature of the whole sulfide series. An ubiquitous enhancement of ρ(T) upon lowering the temperature in these compounds suggests a reduction in the carrier density. A clear hysteresis of about ΔT ≈ 40 K is found only for the In compound [11].
Despite the partial gapping at T < TCDW, TlxV6S8 adopts a SC ground state at much lower temperatures. The superconductivity at Tc ≈ 3.5 K was initially observed in resistivity measurements on single crystals of Tl0.1V6S8 and Tl0.8V6S8 by Bensch et al [17] and has been confirmed more recently by susceptibility studies on poly-crystalline samples [11, 18]. Similar to the high temperature anomaly, superconductivity is found to be a common feature among the members of the AV6S8 family as it is observed for intercalated Tl, In, K, Rb or Cs and also for the parent compound V6S8. At low temperatures all samples showed perfect diamagnetism and this was taken as an indication that superconductivity is a bulk property in this class of materials [11]. For TlxV6S8, a significant anisotropy is observed for the upper critical field Bc2 determined from resistivity measurements on single crystals [17]. For Tl0.8V6S8 for B∥c, B∥c2(0) ≈ 7 T while for B⊥c, B⊥c2(0) ≈ 2.4 T. The yielded anisotropy is B∥c2(0)/B⊥c2(0) ≈ 2.9. This value seems to decrease slightly upon reducing the Tl content of the crystal [17]. Single crystal x-ray investigations reveal a reduction for the separation of the V–V zigzag chains upon decreasing Tl content [17]. The coherence lengths for the different field orientations are: ξ∥ ≈ 164 Å and ξ⊥ ≈ 60 Å almost unaffected by the amount of the intercalated Tl [17].
2. Experimental setup
Powders of TlxV6S8 (x = 0.1, 0.15, 0.25, 0.47, 0.63 and 1) were prepared by vapor transport deposition. The samples were pressed in pellets and then sintered in closed silica tubes at T = 800 °C for 7 d. A scanning electron microscope image of the powdered TlV6S8 sample shows that the sample consists of small rod-like single crystals with lengths of roughly 0–30 and 2–5 μm in diameter. During the sintering process the size of the crystals increases substantially and they start to merge. The actual sample composition for each nominal concentration was confirmed by x-ray and microprobe analysis.
For the resistivity experiments, the samples were cut in a parallelepiped shape and gold wires were connected with gold paste. Standard four-probe ac resistivity measurements were performed at ambient pressure for all samples (0.35 K < T < 300 K). In addition, for x = 1, 0.15, 0.47 and 0.63, the resistivity, ρ(T), was measured under hydrostatic pressure in a double-wall piston–cylinder type pressure cell at pressures up to p = 2.5 GPa. We used as pressure transmitting medium a mixture of n-pentane and iso-pentane which ensures excellent hydrostatic conditions. The pressure has been determined using a very thin SC Pb manometer placed along the whole pressure cell length. No pressure gradient was observed in the cell as the Pb SC transition width remained narrow (ΔTc ≈ 5 mK) and almost pressure independent. Specific heat measurements employing a relaxation method (Quantum Design PPMS), were carried out at atmospheric pressure for the x = 0.47 and 0.63 concentrations. Moreover, dc magnetization measurements in a superconducting quantum interference device (SQUID) magnetometer (Quantum Design MPMS) and differential scanning calorimetry (DSC) studies were performed for the x = 0.63 sample. All the measurements (resistivity at all pressures, specific heat and magnetization) were done both while cooling down and warming up in order to check for thermal hysteresis.
3. Ambient pressure results
For all Tl compositions studied, the resistivity measurements at ambient pressure showed an anomaly at T = Tl upon cooling down and at T = Th while warming up (figure 2). Tl and Th are defined as relative minima of ∂ρ/∂T while cooling down and warming up, respectively (figure 3). The size of this anomaly varies strongly with the Tl content.
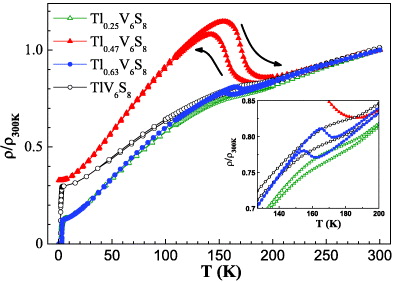
Figure 2. ρ(T)/ρ(300 K) for different Tl concentrations. A clear anomaly and thermal hysteresis (inset) are visible for all the samples in the high temperature range.
Download figure:
Standard image High-resolution image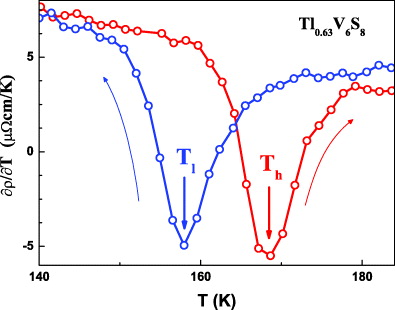
Figure 3. Tl and Th are defined as the temperatures where ∂ρ/∂T(T) has a local minimum. Exemplified for Tl0.63V6S8.
Download figure:
Standard image High-resolution imageIn the warming up temperature sweeps, ρ(T), increases with higher absolute values around Th than during cooling down. A clear thermal hysteresis (inset figure 2) which varies with the composition, is visible for all samples indicating a first-order phase transition. The resistivity measurements in magnetic field (not presented here) showed that both, the size of the transition anomaly and Th are very robust against magnetic field as no effect was observed up to B ≈ 7 T. Tl and Th show a slight dependence on Tl concentration; they are continuously reduced upon increasing x up to x = 0.63 and than enhanced again at x = 1 (table 1).
Table 1. Th and Tl for different Tl concentration.
| x (K) | 0.1 | 0.15 | 0.25 | 0.47 | 0.63 | 1 |
|---|---|---|---|---|---|---|
| Th | 179 | 175 | 172 | 170 | 169 | 178 |
| Tl | 169 | 166 | 165 | 157 | 158 | 170 |
The most pronounced anomaly observed for half Tl filling, x = 0.47, corresponds to an increase in resistivity of about 36%. Remarkably, this is the only composition, which does not display any signature of superconductivity down to the lowest temperature of our investigation. This might be taken as an indication that the gap opened at the Fermi-surface due to the CDW instability is detrimental to SC.
The high temperature anomaly is also clearly evidenced by susceptibility measurements. A significant jump in χ(T) is observed upon cooling (T ≈ Tl) and warming (T ≈ Th) as depicted in figure 4. We define Th and Tl as local maxima in ∂χ(T)/∂T upon cooling down and warming up, respectively (inset figure 4). The yielded values are the same as those found in the resistivity measurements: Tl = 158 K and Th = 169 K.

Figure 4. χ(T) for Tl0.63V6S8. A significant jump in χ(T) is observed upon cooling (T ≈ Tl) and warming (T ≈ Th). Inset: Tl and Th defined as local maxima in ∂χ(T)/∂T upon cooling and warming, respectively.
Download figure:
Standard image High-resolution imageThe high temperature dependence of the susceptibility follows a Curie–Weiss law, above the CDW transition and below T ≈ 140 K the flat susceptibility is dominated by Pauli paramagnetism. The drop in the susceptibility across the phase transition is about 28% for the Tl0.63V6S8 sample. This indicates an important reduction in the DOS at the Fermi-level as the susceptibility is given by  [19], where μB is the Bohr magneton, N(EF) is the DOS at the Fermi-level EF, NA is the Avogadro number and M is the molar mass. Therefore, the DOS reduces by roughly 30% upon opening the CDW gap at Tl. The effective reduction obtained is

It is interesting to remark that the relative change in resistivity is smaller by a factor of roughly 6 for x = 0.63 than the drop in susceptibility. It has been observed in electron diffraction measurements on the iso-structural InxNb3Te4 that two of the three zigzag chains of Nb atoms are responsible for the CDW instability and one chain for the superconductivity [16]. It is likely that a similar scenario is also valid for our samples with the V chains having different contributions to the CDW and SC. Electrical resistivity would therefore be less affected if CDW gaps open more on two of the channels and less (or not at all) on the third. This is also corroborated by the rather week interdependence of superconductivity and CDW as revealed by our pressure studies presented later in this paper.
The high temperature anomaly is detected also in the specific heat measurements. The results obtained for x = 0.63 are presented in figure 5. Similar results, not shown here, are found for the x = 0.47 sample. The Tl and Th temperatures, determined from the resistivity and as well from the susceptibility measurements, are depicted by arrows in figure 5. Th corresponds well to the temperature of the maximum in C/T upon warming up, while Tl is placed at slightly lower T than the corresponding cooling down maximum in C/T situated at T = 161 K. However, in the latter case the anomaly in specific heat is much broader. The size of the anomaly at T = Th is strongly enhanced compared to the one at T = Tl and, upon warming up, the shape of the anomaly is reminiscent of a first-order phase transition. The jump in the specific heat at Th is

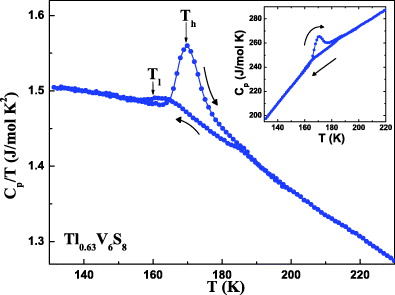
Figure 5. The C(T)/T dependency for Tl0.63V6S8 shows a clear signature of the high-T anomaly. Inset: C(T) for the same Tl content.
Download figure:
Standard image High-resolution imageFurthermore we were able to probe the SC state employing specific heat measurements. The occurrence of two gaps on the Fermi-surface, one SC and the other dielectric, will change the thermodynamic properties of a CDW superconductor compared to the conventional Bardeen–Cooper–Schrieffer (BCS) ones. In the case of CDW superconductors the formation of electron–hole pairs leads to Δ(0)/(kBTc) always smaller than the BCS value of 1.76, where Δ(0) and Tc are the SC energy gap and the SC transition temperature, respectively [20]. The T-dependence of the specific heat for a CDW superconductor is also influenced by the high temperature gap [21, 22]. The specific heat jump at Tc is reduced relative to the BCS relation by a main correction quadratic in Tc/ΔCDW, where ΔCDW is the CDW gap [20]. Cases of CDW superconductors for which the heat capacity reveals no anomaly as the SC state sets in, are not rare. For example the ceramic BaPb1−xBixO3 with x = 0.25 reveals no signature of SC in calorimetric measurements [23] but a partial removal of the CDW gapping in this compound results in the appearance of a jump in the specific heat at Tc [24, 25]. ΔC/(γTc) ratios considerably lower than the correspondent BCS value of 1.43 are found for a vast series of CDW superconductors: Li1.16Ti1.84O4 (ΔC/(γTc) ≈ 0.6) [26], Nb3S4 (ΔC/(γTc) ≈ 1.11) [27], Nb3Se4 (ΔC/(γTc) ≈ 0.66) [27], Nb3Te4 (no trace of SC in specific heat) [27], etc.
Our specific heat study on Tl0.63V6S8 unambiguously reveals an anomaly as the system enters from the normal, but partially gapped state, into the SC phase (figure 6). The SC transition temperature Tc = 3.39 K determined using an equal-area construction, corresponds to the onset of the resistivity drop. The transition width is ΔT ≈ 0.3 K and the magnitude of the normalized jump ΔC/(γTc) estimated also using the equal-area construction has a small value of only

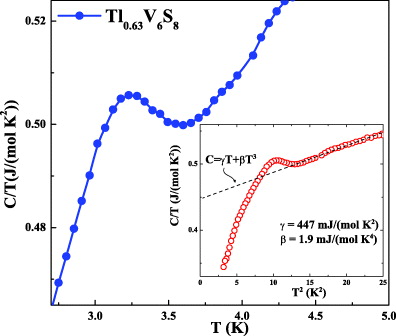
Figure 6. The low temperature C(T)/T dependency in Tl0.63V6S8 revealing the SC phase transition. Inset: C/T as function of T2. A linear fit (dashed line) in the normal state yields the γ = 447 mJ mol−1 K−2 and β = 1.9 mJ mol−1 K−4.
Download figure:
Standard image High-resolution imageIn the normal state, the specific heat is almost linear in temperature up to T = 12 K. Assuming for the low-T normal state C = γT + βT3, C/T is plotted as function of T2 in order to estimate the specific heat electronic (γ) and phononic (β) terms (inset figure 6). The dashed line represents the least-squares fit to the normal state data which yields
- γ = 447 mJ mol−1 K−2,
- β = 1.9 mJ mol−1 K−4.
Using this value for β we estimate a Debye temperature ΘD = 246 K. The value of γ is considerable and might be an indication of strong electronic correlations.
The electron–phonon coupling constant, λ, can be evaluated using the McMillan expression [28]

where μ* is the Coulomb repulsion between electrons. An accurate value of μ* is difficult to obtain. For simple elements it might be determined from the isotope shift. However, it was argued by McMillan [28] that μ* ranges from μ* = 0.1 for nearly free electron metals to μ* = 0.13 for transitional metals. Using this latter value in equation (4) with Tc = 3.39 K, and the experimental ΘD = 246 K we obtain λ = 0.61. This is basically the same to the value of λ = 0.61 estimated for the metallic V and considered to be in the moderate to low coupling limit [28].
The Sommerfeld coefficient γ is related to the electronic DOS at the Fermi-level N(EF) by

This gives N(EF) = 5.9 × 10²⁰ states J−1 mol−1.
Little is known about the symmetry of the gap. However, the low-dimensional structure and the anisotropic gap found in the related compounds Nb3S4 [29] and Nb3Se4 [27] suggest that the gap might be anisotropic in TlxV6S8 as well. When the symmetry of the energy gap is reduced, the thermal selection allows, at low-T, that the states corresponding to the regions on the Fermi-surface with a smaller gap to contribute to the electronic specific heat. The effect of the anisotropy on the thermodynamic properties of superconductors has been analyzed by Clem [30] who has suggested the following modifications to the BCS predictions:


where  is the averaged energy gap at T = 0 K and the mean-squared anisotropy 〈a2〉 is the average over the whole Fermi-surface of the square of the energy gap deviation from its average value. From equation (7) we obtain 〈a2〉 = 0.24, significantly higher than 〈a2〉 = 0.07 for Nb3S4 [27], 〈a2〉 = 0.14 for Nb3Se4 [27] or 〈a2〉 = 0.04 for the layered compound 2H-NbSe2 [31]. With increasing lattice anisotropy, the 〈a2〉 value is enhanced. Therefore, the high value we found might be due to the pronounced 1D character of the electronic structure of TlxV6S8. Replacing 〈a2〉 in equation (6) we estimate an normalized average energy gap of

for Tl0.63V6S8, smaller than the 1.76 value expected for a BCS superconductor. The results obtained from the low temperature specific heat measurements for Tl0.63V6S8 are summarized in table 2. Our results suggest that this compound is a highly anisotropic and weak coupling superconductor.
Table 2. Thermodynamic properties obtained from the specific heat measurements for Tl0.63V6S8.
| Tc (K) | 3.39 |
|---|---|
 |
0.08 |
| γ (mJ mol−1 K−2) | 447 |
| β (mJ mol−1 K−4) | 1.9 |
| ΘD (K) | 246 |
| λ | 0.61 |
| N(EF) (states J−1 mol−1) | 5.9×10²⁰ |
| 〈a2〉 | 0.24 |
 |
1.14 |
4. Influence of pressure on the charge-density wave instability and on the superconductivity
It is of great importance to determine in which way the superconductivity and the CDW instability interfere with each other. Pressure, in general, has an important effect on the CDW state, being an ideal tool to explore the interplay between the two ground states. In the following we will concentrate on the study of resistivity under hydrostatic pressure for the Tl0.63V6S8 compound which displays both CDW and complete SC in our accessible temperature range. The results obtained for x = 0.15 [32] and x = 0.47 under pressure are mentioned only briefly.
Upon applying hydrostatic pressure, the size of the CDW anomaly is gradually reduced together with a decrease of Tl and Th (figure 7). The hysteretic behavior in resistivity is maintained up to p = 1.26 GPa. Above this pressure, which corresponds to a Tl = 95 K, any signature of the anomaly upon cooling down is difficult to resolve unambiguously. However, the anomaly is still visible in the warming up measurements where the CDW formation can be followed up to p = 1.71 GPa corresponding to Th = 67 K. For even higher p, no anomaly is found anymore, leading to the conclusion that the CDW phase transition is suddenly suppressed at elevated p. We estimate a critical pressure for the vanishing of the CDW state of about pc = (1.85 ± 0.12) GPa.
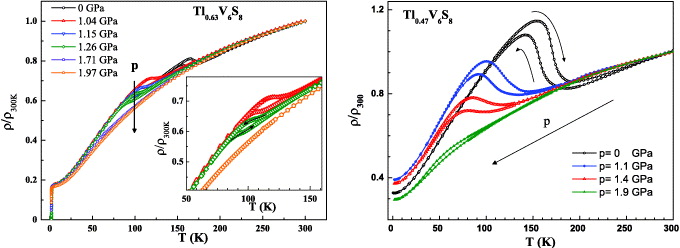
Figure 7. Temperature dependence of the normalized resistivity at different pressures for TlxV6S8. Left: x = 0.63, right: x = 0.47. The size of the CDW anomaly as well as the transition temperature decreases with increasing pressure and is finally completely suppressed for x = 0.63.
Download figure:
Standard image High-resolution imageA similar suppression of the CDW transition temperature is also observed for x = 0.15 (not shown) and x = 0.47 (right panel of figure 7). For x = 0.15 the estimated critical pressure is pc = (1.7 ± 0.2) GPa, while for the x = 0.47 sample the CDW transition is not suppressed up to p = 1.9 GPa, the highest pressure achieved in the employed pressure cell.
Only the onset of the superconductivity is observed for x = 0.15 and its temperature is only slightly decreasing with pressure. For x = 0.47 no signature of superconductivity is observed up to p = 1.9 GPa . The absolute values of the resistivity in the low-T range are strongly influenced by the CDW transition temperature for both x = 0.15 and 0.47.
Zero resistivity is observed for the x = 0.63 sample at all pressures (figure 8). Upon increasing p, the SC transition is moved to lower temperatures from Tc = 3.05 K at atmospheric pressure down to Tc = 1.09 K at the maximum achieved pressure p = 2.5 GPa. Here, Tc is defined as the temperature where ρ(T) drops to zero. The transition width (ΔTc ≈ 0.4) remains unaffected by pressure. A slight decrease with p can be observed for the resistivity value in the normal state, ρ0, immediately above the SC transition. Moreover, an additional tiny anomaly, not present at ambient pressure, starts to be visible around T = 4.5 K, already under a low pressure of p = 0.18 GPa. The temperature where this anomaly occurs changes then slowly with increasing p (inset figure 8). The temperature of the anomaly does not correspond to any of the SC phase transitions at atmospheric pressure in elemental Tl (Tc = 2.3 K [33]) or V (Tc = 5.3 K [34, 35]). In addition, no trace of magnetic order has been revealed by susceptibility measurements at ambient pressure. A similar feature has been reported by Fujii et al [18] and ascribed to different Tc values for the intra-grain and inter-grain superconductivity.
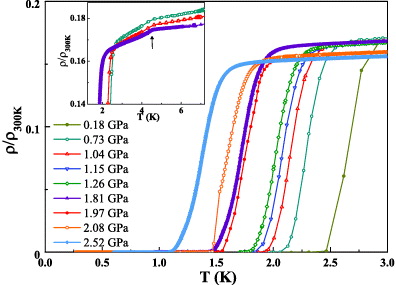
Figure 8. The low-T normalized resistivity showing the SC transition in Tl0.63V6S8 at different pressures. Inset: a small anomaly above T = Tc, depicted by the arrow is visible under pressure
Download figure:
Standard image High-resolution imageThe pressure dependence of Tc, Tl and Th are depicted for the Tl0.63V6S8 sample in the phase diagram shown in figure 9. Tl and Th are decreasing linearly at low p with an initial slope of

The SC transition temperature first decreases suddenly from ambient pressure to p = 0.18 GPa and then, at higher pressures, is further reduced linearly with a slope

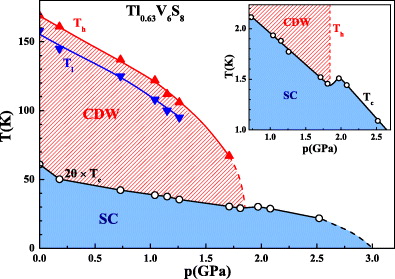
Figure 9. Phase diagram for Tl0.63V6S8. Note that Tc is multiplied by 20. The CDW instability is completely suppressed at a critical pressure pc = (1.85 ± 0.12) GPa and concomitantly Tc is enhanced (inset). The dashed lines are guides for the eye.
Download figure:
Standard image High-resolution imageRemarkably, the complete suppression of the CDW instability at the estimated critical pressure pc = (1.85 ± 0.12) GPa leads to an enhancement of Tc of approximately Tc|p=1.97GPa − Tc|p=1.81GPa ≈ 120 mK (inset figure 9). This is an indication that the relation between CDW and SC gap is antagonistic. However, pressure is strongly detrimental to both of the anomalies therefore the enhancement of Tc at p ≈ pc due to the increase in the DOS is relatively small.
Above p = 2 GPa, Tc starts to decrease again, at an accelerated pace:

A linear extrapolation of Tc(p) would yield, as zero T interception, a critical pressure of about pSCc = 3.9 GPa. However, it is most likely that the SC will be suppressed at significantly lower pressures ( shows already an increasing tendency), as suggested by the dashed line in figure 9.
The interplay of the two types of instabilities, CDW and SC has been also reported on electronically two-dimensional systems as for example NbSe2 [36], 1T-TiSe2 [37, 38] and NbSe3 [39]. In these compounds, the pressure and also the chemical substitution in the case of 1T-TiSe2 lead to the formation of a SC dome with a maximum Tc in the proximity of the critical pressure, pc, where the CDW is suppressed. This is different in Tl0.63V6S8 where Tc and TCDW are both suppressed in the whole pressure range and a small enhancement of Tc is observed only at pc.
The enhancement of the resistivity at Tl and Th results from the decrease of the carrier density as the CDW gap opens at the Fermi-level. The size of the relative resistivity increase can be defined as

where ρCDW is the resistivity value on top of the CDW anomaly while ρn is the resistivity value expected at the transition temperature in the absence of the CDW formation. ρn is determined by extrapolating the high-T ρ(T) curve down to the CDW transition temperature. σCDW and σn are the conductivities corresponding to ρCDW and ρn, respectively. In a metal the conductivity is in general given by

where N(EF) is the DOS at the Fermi-level and vF and τ are the Fermi velocity and the relaxation time of the conduction electrons, respectively [40, 41].
If we assume that the opening of the CDW gap reduces N(EF) without changing vF and τ the relation (12) can be rewritten as

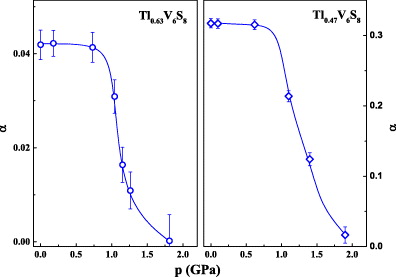
where Nn is the DOS at the Fermi-surface in the absence of the CDW instability and ΔN denotes its reduction after the gap has been opened. Therefore the fractional increase in the resistance, α, would provide information regarding the size of the gapped area of the Fermi-surface.
The pressure dependences of α for x = 0.63 and 0.47 are shown in figure 10. α is almost pressure independent for both compounds up to p ≈ 0.9 GPa, but decreases abruptly above this pressure. The effect of the inter-chain coupling (η) on the CDW transition temperature has been studied theoretically within the mean-field approximation by Horovitz et al [42, 43]. For a given electron–phonon coupling constant, λ, the ratio TCDW/TF with TF the Fermi temperature is almost independent of the inter-chain coupling for η below a critical value ηc. Nevertheless, above ηc, TCDW/TF is suddenly reduced to zero due to a collapse of the nesting of the Fermi-surface. Within this scenario the drastic reduction of α already above p ≈ 0.9 GPa might be a consequence of the inter-chain coupling constant exceeding ηc and precluding the nesting of the Fermi surface, thereby rapidly suppressing the CDW gap. A similar pressure dependence of α(p) has been reported for NbSe3 [39, 44].
Figure 10. α(p) dependence for Tl0.63V6S8 and Tl0.47V6S8 samples. For both compounds, α(p) is almost constant at low pressure but decreases abruptly above p ≈ 0.9 GPa.
Download figure:
Standard image High-resolution image
5. Conclusions
The high temperature anomaly observed in the metallic TlxV6S8 has been attributed to a CDW instability [11]. Its CDW nature is corroborated by band structure calculations which reveal nesting conditions [14]. The first-order character of the high temperature anomaly in TlxV6S8 suggested in [11, 13] is confirmed by the observation of a hysteresis in our resistivity and susceptibility measurements.
Moreover, we report on specific heat evidence of the existence of the CDW (Tl0.47V6S8 and Tl0.63V6S8) and SC transitions (Tl0.63V6S8) in the TlxV6S8 family. A clear hysteresis is as well observed at the high temperature transition in the specific heat data.
We observed a strong correspondence of the physical properties of TlxV6S8 on the Tl concentration x. Each sample showed a clear CDW anomaly which is strongly enhanced at half Tl filling, x = 0.47. This is also the only composition for which no signature of superconductivity is observed. The specific heat probing the SC phase in Tl0.63V6S8 suggests that this compound is a highly anisotropic, weak coupling superconductor.
The study of resistivity under pressure revealed a rapid suppression of TCDW upon increasing p for all samples investigated. For x = 0.63 also the evolution of the SC transition with p was followed by resistivity. Pressure is also detrimental to the SC phase with Tc being reduced with increasing p. Nevertheless, as the CDW gap is closed at the critical pressure pc, the increase in the density of stated leads to a clear enhancement of Tc suggesting that SC and CDW compete for parts of the Fermi-surface.
Future systematic studies on single crystals of TlxV6S8 under pressure in a magnetic field will shed more light on the physical properties in this already very interesting quasi 1D class of materials.
Acknowledgments
We acknowledge support from UEFISCDI, project RP-10, contract 8/2010 and PN-II-ID-PCE-2011-3-1028.