


Abstract
We reveal surprisingly high kinetic energy release in the intense-field fragmentation of D3+ to D+ + D+ + D with 1016 W cm−2, 790 nm, 40 fs (and 7 fs) laser pulses. This feature strongly mimics the behaviour of the D+ + D+ + D+ channel. From the experimental evidence, we conclude that the origin of the feature is due to frustrated tunnelling ionization, the first observation of this mechanism in a polyatomic system. Furthermore, we unravel evidence of frustrated tunnelling ionization in dissociation, both two-body breakup to D + D2+ and D+ + D2, and three-body breakup to D+ + D + D.
Export citation and abstract BibTeX RIS

Content from this work may be used under the terms of the Creative Commons Attribution-NonCommercial-ShareAlike 3.0 licence. Any further distribution of this work must maintain attribution to the author(s) and the title of the work, journal citation and DOI.
GENERAL SCIENTIFIC SUMMARY Introduction and background. Laser-driven electron recollision phenomena have fascinated strong-field physicists over the past two decades and have led to the emergence of new research fields including attosecond science. The recent discovery of frustrated tunnelling ionization (FTI), a new phenomenon linked to electron recollision, exemplifies that there is still much to be explored and understood about ultrafast intense laser–matter interactions. The mechanism of FTI refers to the capture of an electron wavepacket, following strong-field tunnelling, to a Rydberg state of the parent system—in essence 'frustrating' the ionization process.
Main results. Having already been demonstrated to occur for neutral atoms and diatomic molecules, we present the first evidence for FTI in a polyatomic molecule. Our study is unique not only for this reason, but also because we use a molecular-ion beam target. Using a crossed-beams coincidence 3D momentum imaging setup, we report clear signatures of FTI in various fragmentation channels of D3+ subjected to intense 40 fs and 7 fs infrared laser pulses. We support the systematic experimental measurements with a classical simulation illustrating how FTI proceeds during D3+ breakup.
Wider implications. This work on the benchmark D3+ molecule cements the current understanding of FTI and sheds new light on it for different systems. While the full potential of FTI is still to be exploited, we expect that in time exciting broad applications will emerge, such as using it as a means to accelerate neutral atoms, as recently reported.
 Figure. Kinetic energy release distributions for the three-body breakup of D3+ in 1016 W cm−2, 790 nm, 7 fs laser pulses. The high energy peak in the D+ + D+ + D channel, that resembles the D+ + D+ + D+ channel, is believed to be caused by FTI.
1. Introduction
Intense ultrashort laser pulses have a propensity to cause unexpected nonlinear behaviour in atoms and molecules. An example is electron recollision phenomena [1–5], where a laser-ionized electron wavepacket is steered by the intense time-varying electric field of the laser to return to its parent ion core. Upon its return it can recollide and trigger different processes involving either elastic scattering [6–8], inelastic scattering [9, 10], or electron–ion recombination [11]. These phenomena have led to the birth of new areas of research such as high-harmonic generation and attosecond science [12–15], laser-driven electron diffraction imaging [5–8], molecular orbital tomography [16, 17] and electron wavepacket probing of molecular dynamics [18–21]—naming only a few.
Related to the electron recollision process, recently Nubbemeyer et al [22] reported a new phenomenon dubbed frustrated tunnelling ionization (FTI). Demonstrated originally in strong-field ionization of helium, Nubbemeyer et al showed that an electron wavepacket that starts to tunnel away from the core in an intense laser field, but fails to acquire sufficient drift momentum to escape the attractive potential of the remaining He+ ion, can be captured into an excited Rydberg orbital of the He atom—in effect 'frustrating' the tunnel ionization process. This process must occur during the laser pulse to conserve energy and momentum, most likely during the trailing edge, as the electron is gently decelerated over many laser cycles before being pulled into orbit.
The same mechanism has been observed in the dissociative ionization of a few diatomic molecules (H2 [23], D2 [24], O2 [25] and Ar2 [26–28]). For such molecules, following ionization, an electron that is excited to the continuum and driven by the laser field tends to be captured to a Rydberg orbital of one of the two 'Coulomb-exploding' fragment ions. The signature of frustrated tunnelling in molecules is that, counterintuitively, the final kinetic energy release (KER) is similar to that of a Coulomb explosion event even though only one product fragment is charged while the other fragment is neutral [23].
This description of FTI uses language, such as electron capture, that is usually reserved for discussions involving ionization. Throughout the paper we use this language for convenience. However, it does pose an interesting question in relation to the actual mechanism for FTI, that is, is electron ionization accompanied by recapture to a Rydberg state distinguishable from excitation directly to the Rydberg state through the strong-field interaction? While it is unclear how one should define the difference between these processes, the final outcome is certainly the same—the electron involved remains bound in an excited Rydberg state of the system.
Central to the FTI mechanism, as with all electron recollision events, is the ellipticity  of the laser polarization [1]. Should = 0 (linear polarization), then, depending on the time of electron release, the electron wavepacket can efficiently return to or stay in the vicinity of the ion core. At the other extreme, if = 1 (circular polarization), the electron wavepacket typically escapes from the ion core. This leads to the suppression of FTI and, in general, electron recollision events when elliptically or circularly polarized pulses are used [1].
In this paper we report the observation of a surprising high-KER feature in the dissociative ionization of a D3+ beam with intense 40 fs (and 7 fs) laser pulses. Our evidence suggests that the mechanism responsible is FTI—and would therefore be the first observation of this process in a polyatomic molecule and, furthermore, the first starting with a molecular ion target. Moreover, the probability of FTI is substantial, particularly for longer pulses. Indeed, the study of the intense field fragmentation of D3+ (H+3) is a substantial achievement in itself as this milestone has only recently been reached [29–32]. The large interest in H+3 stems from the fact that it is the simplest stable polyatomic molecule, is of fundamental interest [33, 34], and is viewed by many as a gateway to better understanding the dynamics of multi-centre systems in intense lasers (for some theoretical H+3 and H2+3 strong-field studies, see [35–46]). On a broader level, H+3 is considered very important for astrophysical studies [47–53], as it plays a key role in the chemistry of the universe, and has been subject to various other laboratory measurements [54–57].
2. Experimental method
The experiments are carried out using the Kansas Light Source laser [58], which is a Ti:sapphire multipass chirped-pulse amplifier system that delivers linearly polarized 30 fs, 2 mJ pulses at 1 kHz repetition rate. Accounting for dispersion the on-target pulses are 40 fs (full-width at half-maximum) duration. Optionally, the pulses can be compressed to 7 fs using a neon-filled hollow-core fibre and chirped mirrors. Using a f = 203 mm off-axis parabolic mirror the laser pulses are focused onto the D3+ ion-beam target with the laser and ion beams crossing at 90° to one another, as shown in figure 1(a). The polarization of the laser is oriented perpendicular to the propagation direction of the laser and ion beams.

Figure 1. (a) Schematic of the coincidence three-dimensional momentum imaging setup. (b) Calculated vibrational, v, population of D3+ (from [59]). (c) Cut of the D3+ ground and first excited state potential energy surfaces in D3h configuration (from [60]). The inset shows a projection of the vibrational population onto the D3+ ground state. The population peaks around r ∼ 2.5–3.0 au, marked by the downward arrow (internuclear distance r is defined in the triangle alongside).
Download figure:
Standard imageThe D3+ ions are produced in an electron–cyclotron resonance ion source via the production reaction D2 + D2+ → D3+ + D. This populates the D3+ in a range of vibrational states [59], shown in figure 1(b). The ions are accelerated from the source to 10 keV, momentum selected by electromagnets, then steered and focused with electrostatic deflectors and lenses. A pair of four-jaw slits ensures the beam is reasonably collimated to a cross-sectional size of ∼0.6 × 0.6 mm2 at the interaction region. We estimate the ion-beam target density to be only ∼4 × 10⁵ molecules cm−3 for a beam current of 10 nA at 10 keV, while the residual gas density is ∼107 molecules cm−3 at an ultra-high vacuum pressure of 3 × 10⁻¹⁰ Torr, thus making all measurements challenging.
After D3+ fragmentation by the laser, the charged fragments are accelerated in the direction of ion-beam propagation over a small region using a coaxial electrostatic spectrometer with an applied electric field strength of 400 V cm−1—see figure 1(a). This separates the D, D+ and D2+ fragments by their time-of-flight, and they are measured in coincidence using a time- and position-sensitive delay-line detector. The primary D3+ beam is collected in a small on-axis Faraday cup. See [61–63] for a general description of the imaging method. The possible D3+ reaction channels involve:
dissociation
single ionization

and double ionization

where nω denotes the interaction with the strong laser field. In our measurements the two-body fragmentation channels require a two-particle coincidence and the three-body fragmentation channels require a three-particle coincidence. The electrons are not detected, thus our measurements are only kinematically complete for the nuclear dynamics. From the information collected, event-by-event, we obtain the three-dimensional momentum vectors of all coincident fragments allowing us to view the KER and angular distributions of all reaction channels.
3. Results and discussion
3.1. Observation of high-kinetic energy release (KER) feature
In a recent letter, we reported the first observation of D3+ dissociation and ionization in an intense laser pulse [29]. From those measurements we deduced that three-body breakup of D3+ leading to D+ + D+ + D via reaction channel (2) results predominantly from ionization plus excitation to the repulsive first-excited potential energy surface (PES) of D32+. This conclusion was based on the fact that dissociation on this PES was kinematically consistent with our measurements. The kinetic energy released in this process is peaked at 10 eV with a high energy tail falling off rapidly above 15 eV as shown in figure 2(a). From the energies involved and the topology of the PES, we could conclude that D3+ breaks up predominantly from an internuclear separation r ∼ 3.5 au, where r is the deuteron–deuteron distance as defined in figure 1(c). Moreover, double ionization to D+ + D+ + D+ via reaction (3) peaks at KER = 25 eV as seen in figure 2(b). By assuming direct Coulomb explosion via the repulsive 3/r (in atomic units) potential, this gives a similar r ∼ 3.2 au for breakup. This r value is roughly consistent with the approximate initial vibrational distribution of D3+(∼2.5–3.0 au) predicted by Anicich and Futrell [59] (see figures 1(b) and (c)) and would thereby indicate only a little stretching of the D3+ ion during dissociative single and double ionization with 7 fs pulses. While this is an informative result, as it seems to rule out charge-resonance enhanced ionization of D3+ or D32+ at large r (r ∼ 7 au at 1064 nm) as suggested in [39], it is not altogether that surprising as direct ionization has been observed to dominate in other small molecules, particularly for few-cycle laser pulses (e.g. [20, 64]).

Figure 2. KER distributions for the three-body breakup of D3+ at 1016 W cm−2, 790 nm. Fragmentation with 7 fs pulses for (a) D+ + D+ + D and (b) D+ + D+ + D+ channels (inset of (a) shows an expanded vertical scale of the high-KER range). Fragmentation with 40 fs pulses for (c) D+ + D+ + D and (d) D+ + D+ + D+ channels. Note the high-KER feature between 15 and 30 eV in panel (c), the main subject of discussion.
Download figure:
Standard imageWhat is unexpected is that for 40 fs pulses one observes an additional high-KER feature centred at 22 eV in the D+ + D+ + D breakup channel shown in figure 2(c). For 40 fs pulses, since there is more time for the D3+ ion to stretch before being ionized to the repulsive D32+ potential, one would expect if anything that the KER distribution would be shifted to lower energy than for 7 fs pulses (see, for example, D2+ experiments [65]). Indeed, we do detect a small shift in the lower KER D+ + D+ + D peak from 10 eV for 7 fs to 8 eV for 40 fs. Remarkably, however, the high-KER peak at 40 fs has almost the same energy as the Coulomb explosion peak (at 23 eV) in the D+ + D+ + D+ channel at 40 fs (figure 2(d)). On reflection, this is the first clue to the origin of the mysterious high-KER feature.
To probe the nature of this high-KER feature further, we considered its ellipticity dependence. This is plotted in figure 3 as the ratio of the integrated number of events above 15 eV to the number of events below 15 eV in the D+ + D+ + D channel for 40 fs pulses. For each ellipticity value, the laser intensity has been set to match the peak electric field used for linear polarization (with intensity 5 × 10¹⁵ W cm−2). For example, for circular polarization twice the laser power was used than for linear polarization. While the number of events for KER < 15 eV remained relatively unchanged with (see inset), for KER > 15 eV the number diminished, resulting in the decrease of the ratio in figure 3 with increasing . As was discussed in the introduction, this decrease is strong evidence for some form of electron recollision process being responsible for the high-KER feature.

Figure 3. Ellipticity dependence of the ratio of integrated events with KER > 15 eV to KER < 15 eV for the D+ + D+ + D channel with 40 fs pulses. Note that = 0 denotes linear polarization while = 1 denotes circular. Intensities have been matched to have the same peak electric field as the linear polarization at an intensity of 5 × 10¹⁵ W cm−2. Inset shows KER distributions for linear and circular polarization.
Download figure:
Standard image3.2. Possible mechanisms for the high-KER feature
At first, it is reasonable to consider the high-KER as arising from excitation induced by electron recollision. That is, when D3+ is ionized to D32+ the ejected electron returns to recollide with the parent D32+ core. Upon colliding, it induces excitation to a highly excited repulsive state of D32+ that then decays to energetic D+ + D+ + D fragments. However, we consider this mechanism unlikely on the basis that at the intensity studied (1016 W cm−2) the scattering cross-section for this should be extremely small, for the following reason: it is well documented, for both atoms and molecules (including polyatomics [66, 67]), that electron recollision contributions are only prominent in the non-sequential ionization intensity regime (see e.g. figure 3 of [68]). Generally, when the laser intensity is sufficient to sequentially ionize an atom or molecule, electron recollision contributions to excitation or ionization are heavily out-weighed by the direct tunnel ionization of an electron in the strong laser field. For D3+, an intensity of 1016 W cm−2 is in the sequential double ionization regime as evidenced by the large D+ + D+ + D+ yield (cf figure 6(b) that shows that the D+ + D+ + D+ channel dominates over the D+ + D+ + D channel at intensities above 5 × 10¹⁵ W cm−2 for 40 fs). Thus, any non-sequential recollision excitation contribution in the single ionization channel would be small and unable to explain the large magnitude of the high-KER D+ + D+ + D peak observed in figure 2(c).
Rather, previous experimental work for H2 [23] and D2 [24], simulations for D3+ [35, 36], as well as evidence that we gather here, would suggest that the mechanism instead involves FTI. What is truly remarkable though, is the large amplitude of the process. At 1016 W cm−2, 40 fs, the number of events in the D+ + D+ + D channel with KER above 15 eV is 29% larger than below 15 eV, and is as much as 13% of the D+ + D+ + D+ channel, showing that this certainly is not a minor process.
We expect that FTI in strong-field fragmentation of D3+ proceeds as follows. When subjected to an intense laser, an electron is first ejected from D3+ to form the intermediate D32+ complex, followed by the ejection of a second electron, forming the transient D3+3 ion. The similarity of the KER distributions for the D+ + D+ + D+ channel at 7 and 40 fs (peaked at 25 and 23.5 eV, respectively) suggests that both electron ejection steps occur within a relatively short time interval of one another (≲3 fs from a classical estimate of the nuclear motion on the PES). Upon the temporary production of D+ + D+ + D+, the three deuterons mutually repel one another and start moving apart, the so-called 'Coulomb explosion'. At the same time, the two electrons that were born into the continuum still feel the influence of the strong laser field which drives their subsequent motion. Depending on the phase of the linearly polarized laser cycle at which they are released, they will either acquire enough momentum to escape the deuterons' attraction, or fail to gain sufficient momentum and stay in the vicinity of the deuterons. If the latter occurs, the deuteron–electron attraction can lead to an electron being captured to an orbital of the deuteron and remaining bound as an excited D* Rydberg fragment, i.e. overall the D3+ ion undergoes single ionization accompanied by excitation of D32+, rather than double ionization. As the capture process (recombination) requires the conservation of energy and momentum, the general understanding of FTI is that the electron gradually exchanges its momentum with the laser field as it is gently decelerated over many cycles on the trailing edge of the pulse, before being attracted by the deuteron. In molecules, however, the excess energy and momentum could alternatively be exchanged with one of the other nuclei, if the nuclei are close enough.
3.3. Simulation of the frustrated tunnelling ionization (FTI) mechanism
It has been proposed that the FTI process can be modelled using classical trajectory calculations [23, 69, 70], as a full quantum-mechanical calculation is theoretically challenging due to the nuclear degrees of freedom and electron dynamics. Indeed, it has recently been demonstrated by Lötstedt et al [35, 36] that the laser-driven dynamics of D3+ are depicted quite well by classical calculations. These classical calculations, however, are based on a Hamiltonian substantially modified with non-trivial momentum-dependent and many-body potentials to mimic essential quantum mechanical properties. Those authors even report signatures of the FTI mechanism in their simulations. Thus, to illustrate the FTI process for D3+, we will also employ a classical model. Since our goal is merely qualitative, we use a simple approach with only the usual pairwise Coulomb interactions rather than the more sophisticated Hamiltonian of [35, 36]. However, we do note that the qualitative behaviour of our simulations is consistent with the more complete treatment in [35, 36].
In our simulations, initially the D+ nuclei are located on an x–y grid in the geometry of an equilateral triangle with a nuclei–nuclei spacing of r = 3.2 au and the electrons at the centre. The electrons are assumed to be ejected from the D3+ molecule near the peak of a 40 fs, 790 nm, 1015 W cm−2 pulse, with each electron released in consecutive half-cycles of the pulse. In the case of linearly polarized light, the polarization vector is along the x-coordinate (coinciding with one side of the triangle) and the electrons are released with a small lateral momentum (0.1 au), while for circularly polarized light the polarization is in the x–y plane of the molecule. Figure 4 displays example trajectories of the deuterons and electrons for one combination of electron release times, for linearly (panels (a) and (b)) and circularly (panels (c) and (d)) polarized light. For the linearly polarized case, in the plot of the x-coordinate of the particles as a function of time (figure 4(a)), one observes that after the rapid oscillations of the electrons due to the laser influence ceases, electron 1 (e1) drifts free while electron 2 (e2) is captured into a periodic orbit of one of the deuterons. The timescale for the capture event is large, more than one hundred femtoseconds, allowing the deuterons to spread apart. This is clearer when viewed in the x–y plane in figure 4(b), where evidently the captured electron follows a large elliptical orbit in what is effectively a Rydberg state of the atom. Thus, instead of both electrons escaping leading to double ionization, D+ + D+ + D+, the final products resulting from FTI are D+ + D+ + D. We note that, from our simulations, FTI is very sensitive to the timing of the electron release. That is, there is typically only a small window of electron release times near the peak of a laser cycle that leads to electron capture. This can be understood since electrons released at times significantly offset from the peak of a laser cycle generally acquire a large drift momentum in the direction of polarization that drives them far from the nuclei such that they cannot be captured. As a comparison, we show in figures 4(c) and (d) the same calculation but for circular polarization. In this case both electrons are driven far from the deuterons within the first few oscillations of the laser (on the order of 10 fs) and are never captured. This scenario occurs for effectively all electron release times using circular polarization. Hence, FTI is suppressed with circularly—or substantially elliptically—polarized laser pulses.
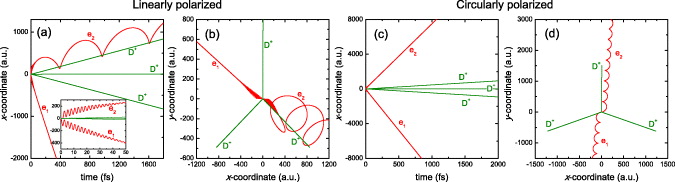
Figure 4. Classical simulation of the trajectories of electrons and deuterons in an intense laser field (1015 W cm−2, 40 fs, 790 nm) illustrating the FTI mechanism, for an example combination of electron release times. Plots (a) and (b) show trajectories for linearly polarized pulses, with (a) showing the x position of the particles as a function of time, and (b) the trajectories in the x–y plane—demonstrating that electron 2 (e2) is captured into a Rydberg orbital of a deuteron. Plots (c) and (d) are the same as (a) and (b), respectively, for circularly polarized pulses where neither electron is captured. Note that in the case of linearly polarized light, the polarization vector is along the x-coordinate while for circularly polarized light, the polarization is in the x–y plane of the molecule.
Download figure:
Standard image3.4. Similarity of FTI and double ionization features
If the production mechanism for the high-KER D+ + D+ + D fragments does involve FTI, then one would expect this channel to bear many of the signatures of the D+ + D+ + D+ channel in addition to an almost-matching KER spectrum, as observed for D2 [24]. To determine whether our expectation is true, we look at the energy (or momentum) sharing of the KER between the different fragments. A convenient method of doing so for a three-body system is using a Dalitz plot [72], sometimes referred to as a ternary plot. Through the choice of axis scaling, a Dalitz plot maps the energy sharing of the fragments onto different positions within a circle as shown in figure 5(a), the edge of which is confined by momentum conservation. A detailed explanation of Dalitz plots can be found elsewhere [55, 71, 73, 74]. For the purposes of interpretation, an event that maps to the centre of the circle (denoted by the equilateral triangle) indicates that the three fragments share the final energy equally. In contrast, an event that maps to the edge of the circle (denoted by the linear line) indicates the breakup of the fragments along a linear axis. In the case of linear breakup, in the molecular frame one would observe one slow (or stationary) fragment along with two fast fragments (top-left, top-right, and bottom edges of the circle) or one fast fragment along with two slower fragments (top, bottom-left and bottom-right edges of the circle). Positions in between the circle centre and edge indicate some mixture of these configurations as denoted by the sketches.

Figure 5. Dalitz plots of the energy sharing in the breakup of D3+ at 1016 W cm−2, 790 nm. For each Dalitz plot the x-axis is defined by E1 − E2/(KER × √3) and the y-axis as  ), where E1, E2 and E3 are the kinetic energies of the fragments (see [71]). For the D+ + D+ + D channel, we define E1 and E2 as the energies of the respective D+ ions, and E3 as the energy of the D atom. For the D+ + D+ + D+ channel, E1, E2 and E3 are the energies of the indistinguishable D+ ions. Plot (a) is a diagram showing the different energy sharing configurations after breakup. For example an equilateral triangle (centre) denotes equal energy sharing whereas a linear line denotes breakup in a linear geometry (see text). Plot (b) shows experimental data for the D+ + D+ + D channel, 40 fs, for KER <15 eV, and plot (c) for KER > 15 eV. Plot (d) is also for the D+ + D+ + D channel but for 7 fs. Plot (e) shows data for the D+ + D+ + D+ channel for 40 fs.
Download figure:
Standard imageThe interesting behaviour we are looking for is to compare the measured distributions of the D+ + D+ + D channel at 40 fs below 15 eV (figure 5(b)) and above 15 eV (figure 5(c)). At first sight the distributions are starkly different reaffirming the stance that the fragmentation mechanisms are different. If we compare the D+ + D+ + D channel below 15 eV at 40 fs with the 7 fs results (figure 5(d)), these distributions are similar. Indeed the fact that the distributions peak in the lower portion of the plot shows that on average the two D+ ions take away higher energy than the D fragment. In a simplistic picture one would expect this since the D+ ions feel additional Coulomb repulsion from one another that the neutral D atom does not experience. In contrast, the D+ + D+ + D+ channel at 40 fs in figure 5(e) (and 7 fs not shown) is predominantly peaked near the centre of the circle showing that all fragments share approximately equal energy. The D+ ions mutually repel one another, and since they begin as an equilateral triangle in the ground state configuration of D3+, the final energy is about equally apportioned.
The remarkable likeness of the D+ + D+ + D KER > 15 eV channel in figure 5(c) to the D+ + D+ + D+ channel is compelling evidence in itself for FTI. The capturing of an electron by one D+ ion at a later time does not significantly affect the early repulsion of the three D+ ions; this is apparent in our classical simulations. Hence, although an electron is reattached to form an excited D* atom, the D+ + D+ + D channel already bears all the characteristics of the D+ + D+ + D+ channel—that is, similar high-KER and near-equal energy sharing of the fragments.
3.5. Further signs of FTI
One question that still remains is why does the FTI mechanism seemingly not appear in the D+ + D+ + D channel at 7 fs (no distinct high-KER peak in figure 2(a)) despite being so prominent at 40 fs (figure 2(c)). In fact, our classical trajectory calculations would suggest that FTI is more probable at 7 fs as an electron is recaptured for more release phases. The answer to this apparent puzzle is found in figure 6 which shows the measured rates of the various channels for different intensities. At 7 fs the rate of the D+ + D+ + D+ channel is small. Thus, since FTI emanates from this channel it is not surprising that the FTI rate is also small. Coupled with the fact that the D+ + D+ + D rate (below 15 eV) is very large for 7 fs, the relative FTI contribution is barely visible in figure 2(a). On closer inspection, the inset of figure 2(a), which is an expanded vertical scale, shows that there are counts where FTI is expected to appear. Indeed the fraction of FTI events for 7 fs is ∼20% of the D+ + D+ + D+ events, higher than the 13% observed for 40 fs. The correlation in exhibited behaviour of the high-KER D+ + D+ + D events and the D+ + D+ + D+ events lends further credence to the conclusion that they are due to FTI as one expects FTI and D+ + D+ + D+ to be closely linked.
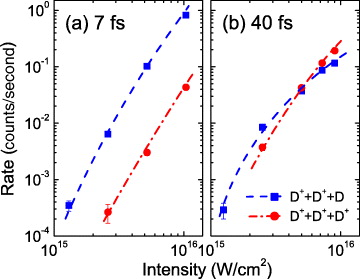
Figure 6. Rates of D3+ fragmentation normalized to the ion-beam current (i.e. the measured counts/second per nA of ion-beam current) and corrected for the detection efficiency for the D+ + D+ + D and D+ + D+ + D+ channels at (a) 7 fs and (b) 40 fs, as a function of laser intensity.
Download figure:
Standard imageFinally, one may question whether FTI is visible in the dissociation channels. To answer, we first examine two-body breakup, i.e. the D+ + D2 and D + D2+ channels. In these cases, D3+ may be excited to the transient D32+ which then breaks via the two-body reaction path to D+ + D2+. As the D+ and D2+ repel apart, either fragment may capture the originally ejected electron, forming excited D* or D*2. To look for evidence of this process we survey the KER distribution for each of these channels. Unfortunately for 40 fs there are insufficient statistics in our data for these channels to be conclusive. Not to be deterred, the equivalent data for 7 fs, 1016 W cm−2 is plotted in figures 7(a)–(c). Noticeably, a small number of high KER fragments between 4 and 12 eV are visible for both D+ + D2 and D + D2+, reflecting the distribution of fragments for the D+ + D2+ channel suggesting that FTI is also present in these channels (though a much smaller contribution in comparison with the D+ + D+ + D breakup at 40 fs (figure 2(c))).

Figure 7. Plots (a)–(c): KER distributions for the two-body breakup of D3+ in linearly polarized 1016 W cm−2, 7 fs, 790 nm pulses; (a) D+ + D2, (b) D + D2+ and (c) D+ + D2+ channels. Plots (d)–(f): same as (a)–(c) but for linearly (shaded area) and circularly (square data points) polarized pulses, with intensities of 5 × 10¹⁵ and 1016 W cm−2, respectively (i.e. the same peak electric field strength for linearly and circularly polarized pulses).
Download figure:
Standard imageAs before, the true test if the high-KER events are due to FTI is if they disappear using circular polarization. These data, at the same peak electric fields (linear 5 × 10¹⁵ W cm−2, circular 1016 W cm−2), are shown in figures 7(d)–(f). The KER distributions for linearly and circularly polarized pulses are the same for the D+ + D2+ channel, as expected, since no recollision process is involved for this channel. Tellingly, the high-KER peaks in the D+ + D2 and D + D2+ channels are absent for circular polarization, strongly supporting the supposition that they are from FTI.
Since FTI is present for two-body dissociation, it can also be expected for the three-body channel D+ + D + D. Despite the poorer statistics for this channel due to the low three-body dissociation rate (see [29, 32]), the KER distribution in figure 8 for linearly polarized 7 fs pulses displays an unmistakable peak at large KER around 10 eV that resembles the D+ + D+ + D channel (note the peak at lower KER around 2 eV is likely to be from regular dissociation pathways by multiphoton excitation). As indicated by the inset, the high-KER peak for D+ + D + D seems to be suppressed using circularly polarized pulses consistent with its origin arising from FTI.

Figure 8. KER distribution for the three-body dissociation (shaded area) of D3+ leading to D+ + D + D in linearly polarized 1016 W cm−2, 7 fs, 790 nm pulses. For comparison, the D+ + D+ + D channel (solid line), scaled in amplitude to the D+ + D + D channel, is shown. Inset: comparison of the D+ + D + D channel for linearly and circularly polarized pulses with the same peak electric field strength, at a linearly polarized intensity of 5 × 10¹⁵ W cm−2.
Download figure:
Standard imageWe speculated earlier on the possibility of electron-recollision excitation being responsible for the surprising high-KER peak in the D+ + D+ + D channel (instead of FTI) but excluded it on the basis that the intensity used is within the sequential tunnelling ionization regime (rather than the non-sequential recollision regime). The observation of equivalent high-KER peaks in the two- and three-body dissociation channels is further evidence to support this assertion. That is, any explanation based on electron-recollision excitation suggests an initial ionization step to create the recolliding electron wavepacket. Since the dissociation channels do not entail ionization then electron-recollision excitation must be ruled out for dissociation. It should be noted that such an argument is only valid assuming that the initial electron that tunnels out does not recombine upon recollision. If instead the tunnelling electron recombines upon recollision, while exciting a secondary electron to the Rydberg state, then the result could still lead to dissociation (without ionization).
3.6. Limit on Rydberg states detected
Before summarizing, we reflect on the possible principal quantum number, n, of the Rydberg states produced by FTI. Simulations for He [22] suggest an n distribution peaked around n = 8 and dropping off rapidly for higher n. Experiments on N2 [25] attempted to directly measure the n distribution and found that states with n > 45 are hardly populated, those with 23 < n < 45 make up over 50% of the population, and those with n < 23 the remainder. The authors also noted that atoms with n ≲ 15 were likely to have decayed in their experiments and may not have been recorded. In our experiments, we did not attempt to measure the n distribution. Nevertheless, it is important to bear in mind that in our spectrometer setup we applied a static electric field of strength 400 V cm−1 for both the 7 and 40 fs experiments—sufficient to field ionize high-lying Rydberg states. From the saddle point field strength relation,  , relating the applied field strength to the lowest n state that can be field-ionized [25], we estimate that only neutral fragments with n ≲ 30 would have survived without being field-ionized by our spectrometer. This number is a little higher, n ≲ 35, if instead one uses the diabatic field ionization formula,
  [25]. Our experiments are, however, fortunate not to suffer from a limitation on the lowest n state that may be detected as the neutral fragments are moving with high energy in the laboratory frame. Thus, even atoms or molecules that have decayed to lower n before reaching the detector will also be recorded.
4. Summary and perspectives
To summarize, we have uncovered for the first time compelling experimental evidence for FTI in a polyatomic molecule—indeed, the benchmark D3+ system. FTI, involving the capture of a continuum electron that has begun to tunnel free, has only recently been discovered as a new mechanism in atoms [22] and diatomic molecules [23–28]. We observe evidence for FTI in the three-body dissociative ionization channel of D3+ leading to D+ + D+ + D, where this channel strongly resembles the Coulomb explosion channel D+ + D+ + D+ from which FTI emerges. We also find weaker signatures of FTI in the two-body D+ + D2 and D + D2+ dissociation channels, as well as a sizeable peak in the three-body D+ + D + D dissociation channel.
The method that we have used to detect FTI is unique compared to recent measurements. Other observations of FTI [22–28], starting from neutral gas targets, have relied on the neutral fragments being produced in an excited state with sufficient internal energy (≳5 eV) to overcome the work function of the microchannel-plate detector, i.e. to trigger a signal. If the excited atoms decay to, for example, their ground state before reaching the detector over typically microsecond flight times, then FTI is undetected. Furthermore, those measurements can only detect the neutral fragments that drift towards the detector limiting the overall collection efficiency. Our novel approach uses a fast molecular ion-beam of several keV energy. By this method we equally collect and detect all neutral fragments (4π solid angle) as well as ionic ones irrespective of their internal energy, measured by two-particle or three-particle coincidence. Since FTI naturally leads to the production of neutral particles, the molecular ion-beam approach has proven an efficient detection scheme.
Our results show that FTI is a universal mechanism that can occur in many-body systems as well as single atoms and diatomic molecules. In fact, one may speculate that FTI should be even more prominent in systems where there are many centres since it provides more opportunity for an electron to be captured. With the ongoing attention directed towards laser-driven electron phenomena including recollision, FTI is likely to be an important process that can be exploited in the future, as exemplified in [75].
Acknowledgments
We thank Z Chang and his group members and C W Fehrenbach for assistance with the laser and ion beams, respectively. JMK acknowledges interesting discussions with E Lötstedt. Supported by the Chemical Sciences, Geosciences, and Biosciences Division, Office of Basic Energy Sciences, Office of Science, US Department of Energy.