

Abstract
Energy harvesting (EH) technologies to power small sized electronic devices are attracting great attention. Wasted energy in a vehicle's rotating tire has a great potential to enable self-powered tire pressure monitoring sensors (TPMS). Piezoelectric type energy harvesters can be used to collect vibrational energy and power such systems. Due to the presence of harsh acceleration in a rotating tire, a design tradeoff needs to be studied to prolong the harvester's fatigue life as well as to ensure sufficient power generation. However, the design by traditional deterministic design optimization (DDO) does not show reliable performance due to the lack of consideration of various uncertainty factors (e.g., manufacturing tolerances, material properties, and loading conditions). In this study, we address a new EH design formulation that considers the uncertainty in car speed, dimensional tolerances and material properties, and solve this design problem using reliability-based design optimization (RBDO). The RBDO problem is formulated to maximize compactness and minimize weight of a TPMS harvester while satisfying power and durability requirements. A transient analysis has been done to measure the time varying response of EH such as power generation, dynamic strain, and stress. A conservative design formulation is proposed to consider the expected power from varied speed and stress at higher speed. When compared to the DDO, the RBDO results show that the reliability of EH is increased significantly by scarifying the objective function. Finally, experimental test has been conducted to demonstrate the merits of RBDO design over DDO.
Export citation and abstract BibTeX RIS
1. Introduction
Use of wireless sensor applications is rapidly increasing from distributed sensing to continuous structural health and machine functionality monitoring. Many of these sensors are powered by conventional batteries of which the maintenance is cumbersome because of the time and cost of regular replacement [1–4]. Also, battery disposal may have a negative impact on the environment. Vibrational energy harvesters (EHs) that convert mechanical motions into electrical power could be a potential alternative to batteries to resolve the issues of disposable batteries [5]. In such EHs, mechanical energy (e.g., dynamic acceleration or strain) can be converted to electrical energy using piezoelectric materials or electromagnetic induction with permanent magnets and coils [6].
A number of previous studies have shown the capability of vibrational EHs as a sustainable power source for tire pressure monitoring systems (TPMS) [1, 5, 7, 8]. Common EHs suitable for installation inside tires are classified into an acceleration type and a deformation type. The main energy source utilized by acceleration-type EHs is the acceleration change that is originated from the contact between tires and road surface. This acceleration amplitude highly depends on the magnitude of driving velocity (or speed) [8, 9]. For deformation-type EHs [1], a larger elastic deformation is required because the energy generation highly relies on the applied strain.
Geometrical and electrical parameters of these harvesters need to be properly optimized in order to achieve efficient energy generation. Several prior studies have addressed deterministic design optimization (DDO) of piezoelectric EHs [10–17]. However, variety of uncertainties—geometrical dimensions, material properties due to manufacturing tolerances, and vibrational loading—results in a stochastic nature of the performance of vibrational EHs (e.g., power output, mechanical stress) and makes it hard to guarantee reliable and satisfactory performance. Optimization under uncertainty can be done using a variety of formulations including minimization of cost, minimization of deviations from goals, and optimization over soft constraints which are discussed in more details in [18]. A few recent studies have addressed optimization under uncertainty in the field of energy harvesting [19, 20]. Hosseinloo and Turitsyn [19] performed design optimization considering parametric uncertainty for a single-degree-of-freedom linear piezoelectric EH. The simulation results from their study demonstrated that, for both harmonic and random excitations, the optimized EH with the consideration of the parametric uncertainties is more robust in terms of the worst-case power compared to the deterministically optimized harvester. They did not conduct RBDO, but just considered uncertainty of the variables in their system. Seong et al [21] optimized the performance of a vibration EH to satisfy the target reliability on power generation under various sources of uncertainties. Franco and Varoto [22] studied deterministic and stochastic optimization of a cantilever-type EH. The direct Monte Carlo simulation (MCS) was employed for uncertainty propagation that evaluated the effect of parametric uncertainty on the dynamic responses of the EH. Ali et al [23] investigated the effect of uncertainty on the performance of a vibrational EH and found the mean harvested power decreases with the increase in uncertainty of the EH. Godoy and Trindade [24] investigated the effect of parametric uncertainty on the performance of a cantilever-type EH. In their study, piezoelectric and dielectric constants of active layers and inductances of electric circuits were considered as stochastic parameters when estimating the mean and confidence intervals of the electric output. Gurav et al [25] investigated design optimization under uncertainty for a micro EH device. Their study considered uncertainties in geometrical parameters as well as material properties. They concluded that accounting for uncertainties would sacrifice 20% of the power output compared to deterministic optimization results. Mann et al [26] studied uncertainty propagation for a nonlinear electromagnetic EH. They used the approximate nonlinear frequency response to compare hardening, softening, and bi-stability cases with a linear EH. Madankan et al [20] estimated probability density functions (PDFs) of power measurements in a nonlinear piezoelectric EH and characterized these probability distributions as functions of excitation frequency, excitation amplitude, initial deflection, and design parameters. They used unscented transformation methodology, in conjunction with the principle of maximum entropy, to compute the probability distributions.
This paper presents a design optimization study on acceleration-type EHs that power TPMSs, and the design problem takes into consideration various uncertainty factors including geometrical parameters, material properties, and loading conditions (time-varying car speeds). This study introduces a novel formulation of the design problem that ensures reliable performance in terms of power generation at varied car speeds and structural stability at high speeds, accounting for stochastic nature of random parameters using RBDO formulation. The purpose of the RBDO study is to optimize the performance of the EH while increasing the reliability of the system despite the presence of structural uncertainty. A surrogate model technique called univariate dimension reduction (UDR) is applied to estimate the performance functions in an efficient manner. This paper is organized as follows. Section 2 explains the design configuration of a TPMS harvester and the governing equations of an EH analysis model. Section 3 presents the formulations and implementations of DDO and RBDO for optimization of the TPMS EH. In section 4, the DDO and RBDO results are presented and compared, and the merit of RBDO is elaborated through the experiments in section 5.
2. Analysis model for piezoelectric harvester
2.1. Design configuration of TPMS harvester
The TPMS EH considered in this study is configured as a beam that is clamped at both ends with the PZT material attached on the top surface (figure 1(a)). The design parameters for the EH are shown in figure 1(b) and table 1. The EH module is encased in a housing and is attached to the inner surface of tire (figure 1(c)). For the sake of electrical power increment, a seismic mass is attached to the lower surface of substrate. This model for EH is initially proposed by Keck [27] and investigated in more details by Eshghi et al [10]. The model used in this study has several advantages over the cantilever beam that is fixed at one side and the seismic mass is attached to the other end. First, it is a more robust and durable design by restraining excessive deformation. Second, due to reduced vibrational amplitude, compact integration into the housing is possible (e.g., no need of stopper). A finite element analysis (FEA) model is implemented using ANSYS to evaluate the performance of the EH design. Four types of elements are used to model the EH: (1) SOLID226 (a second order brick element for piezoelectric analysis) for the piezoelectric material, (2) SOLID186 (a second order brick element for elastic analysis), for the substrate (3) MASS21 (a point mass element) for the seismic mass, and (4) CIRCU94 (a two node circuit element for use in piezoelectric-circuit analyses) for the external resistor where power is evaluated. The resistor is connected between top and bottom electrode of PZT patch. Overall, the FEA model contains 3237 nodes and 1456 elements.
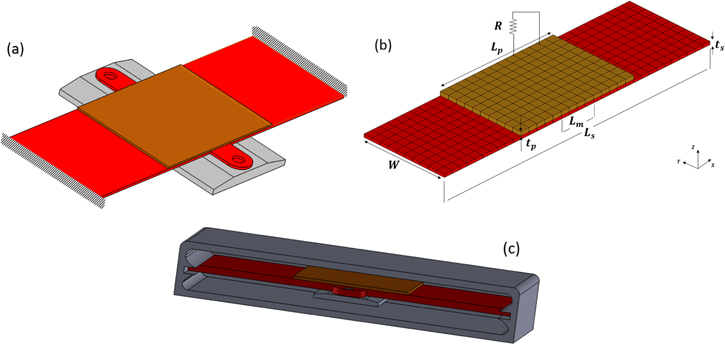
Figure 1. (a) Conceptual design of TPMS EH (fixed at both ends). (b) Design parameters for the EH (c) EH housing.
Download figure:
Standard image High-resolution imageTable 1. Design parameters for the energy harvester.
| Parameter | Description | Value | |
|---|---|---|---|
| Design variable | d1 = Ls | Length of the beam | 20–30 mm |
| d2 = Lp | Length of the PZT | 8–18 mm | |
| d3 = W | Width of the beam | 8–15 mm | |
| d4 = R | Resistance | 1.0–1.0 × 10+6 Ω | |
| d5 = m | Seismic mass | 0–6 g | |
| Constant parameter | ts | Thickness of the beam | 0.267 mm |
| tp | Thickness of the PZT | 0.2 mm | |
| Lm | Length of seismic mass attached to the substrate | 6 mm | |
Table 1 summarizes the design variables d = [d1, d2, ... d5] and constant parameters in the design optimization study. The design variable set consists of three geometrical design variables, the load resistance, and the seismic mass. The thicknesses of both substrate and PZT layers are considered as constants due to the limited standard dimensions from manufacturers. A preliminary parametric study found that the length of seismic mass (Lm: length of the mass in contact with the substrate) has the negligible effect on the EH performance. Hence, it is also defined as a constant parameter and the mesh in the seismic mass area (Lm × W) does not change during the optimization process.
In the simulation model, blue steel and PZT-5H is considered as the substrate and the piezoelectric material, respectively. The material properties are provided in table 2 including transverse strain constant (d31) that indicates how effectively bending strain along direction '1' (or x) is converted to electrical voltage along direction '3' (or z).
Table 2. Material properties [28].
| Material | Description | Symbol | Value |
|---|---|---|---|
| SUS304 | Density | ρs | 8000 kg m−3 |
| Young's modulus | Es | 193 GPa | |
| Poission's ratio | νs | 0.29 | |
| Yield stress | σYs | 220 MPa | |
| PZT-5H | Density | ρp | 7800 kg m−3 |
| Yield stress | σYp | 45 MPa | |
| Compliance | s11 | 16.5 × 10⁻¹² m2 N−1 | |
| s12 | −4.78 × 10⁻¹² m2 N−1 | ||
| s13 | −8.45 × 10⁻¹² m2 N−1 | ||
| s33 | 20.7 × 10⁻¹² m2 N−1 | ||
| s44 | 43.5 × 10⁻¹² m2 N−1 | ||
| s66 | 42.6 × 10⁻¹² m2 N−1 | ||
| Piezoelectric coupling coefficient | d15 | 815 × 10−10 C N−1 | |
| d31 | −320 × 10−10 C N−1 | ||
| d33 | 650 × 10−10 C N−1 | ||
| Relative permittivity | ε11 | 3130 | |
| ε33 | 3400 | ||
2.2. Radial acceleration for a rolling tire
The contact between a rotating tire and road surface generates a complex dynamic acceleration in three different directions: circumferential, lateral, and radial. The focus of this study is on the radial acceleration, which has the largest magnitudes among those. Several previous studies have investigated the acceleration characteristics in a rotating tire in contact with the road surface [8, 29–31]. In this paper we use the input radial acceleration model in [29]. Figure 2 depicts the radial acceleration for a single rotation of tire. 'a' is the radial acceleration in steady-state conditions, and can be expressed as a function of the speed (v) of the vehicle and radius (r) of the tire, i.e., a = v2/r. The acceleration will suddenly increase (a + b) at the moment before the tire contacts the ground and it gets to zero when in contact with the ground. Then the acceleration instantly increases by 'c' because the radius of curvature increases when the tire becomes flat, but this amount is less than 5% of the peak acceleration (a + b). 'd' is the duration between two instants when there is a significant acceleration change due to the tire deformation right before and after the contact. 'e' denotes the duration when the tire is in contact with the ground and is flat.
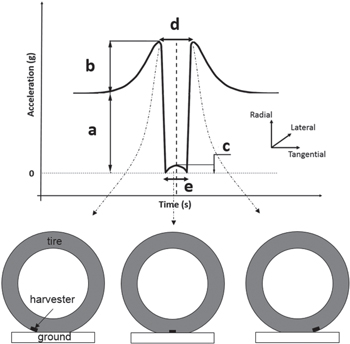
Figure 2. Radial acceleration for a rotating tire in the vicinity of the contact area.
Download figure:
Standard image High-resolution image2.3. Transient FE analysis and performance evaluation
This dynamic acceleration is used as a transient loading in ANSYS to estimate the electrical power and mechanical stresses in the EH. The loading acceleration varies depending on the car speed (velocity) as demonstrated in figure 3 which shows two examples when V = 50 and 100 km h−1. Given an input car speed, the acceleration loading history is updated accordingly and the transient analysis calculates dynamic response of the EH (power and stresses) in time domain.
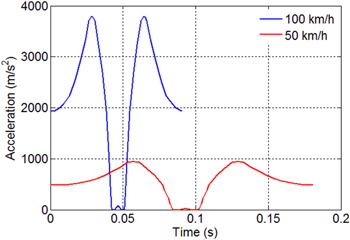
Figure 3. Acceleration input for two different velocities.
Download figure:
Standard image High-resolution imagePower requirement varies depending on the amount of transmitted information needed per wheel revolution, so it usually increases proportional to the car speed. We will use energy per revolution (in J/rev) as an energy requirement measure [32], which is an appropriate choice to define the energy requirement per rotation regardless of time-varying speed. Energy per revolution is a normalized measure of power by tire angular velocity (W/(rev s−1) = J/rev). Table 3 summarizes the minimum requirements for energy per revolution based on a data transmission rate of 15 bytes per revolution at different car speeds.
Table 3. Minimum energy requirements for different vehicle speeds [32].
| Tire speed (mph) | Time for one revolution (s) | Number of data samples acquired per revolution (sample frequency = 10 kHz) | Minimum energy required per tire revolution (μJ/rev) |
|---|---|---|---|
| 10 | 0.529 | 5290 | 8.374 |
| 30 | 0.176 | 1760 | 6.256 |
| 45 | 0.117 | 1170 | 5.902 |
| 65 | 0.0813 | 813 | 5.680 |
In this study, the average energy demand is estimated based on the US federal drive cycles [33] representing the vehicle speed profiles under two driving conditions: (i) Urban dynamometer driving schedule (city driving conditions), and (ii) highway fuel economy driving schedule (highway driving conditions). Figure 4 shows the histogram of the vehicle speed data. By combining the data for both urban and highway cases using the same weights, the PDF of speed, f(V), is estimated using a normal kernel function and is evaluated at equally spaced points as shown in figure 5.
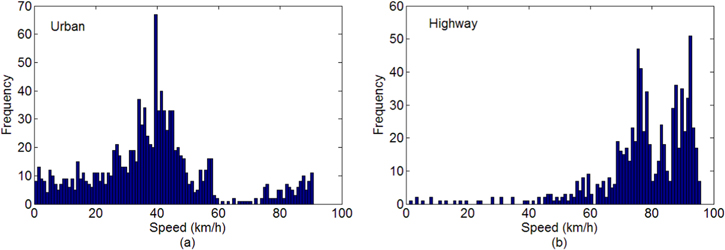
Figure 4. Histograms of car speeds for the urban (a) and highway (b) driving schedules.
Download figure:
Standard image High-resolution image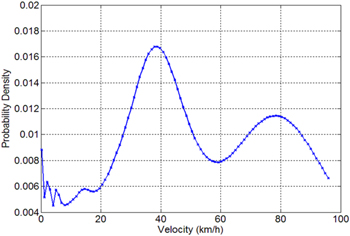
Figure 5. Empirical PDF estimated based on normal kernel function.
Download figure:
Standard image High-resolution imageBased on this PDF, the energy per revolution is calculated from equation (1):
where Pmin(V) is the energy requirement at car speed V, P(d, V) is the energy per revolution for a certain EH design (d) at car speed V, and ΔV = 1 km h−1 is the speed increment for numerical integration. Based on the data in table 3, Pmin(V) can be approximated as a forth order polynomial and Preq is calculated as 6.1 μJ/rev Pave calculation in equation (1) is done similarly as Preq, after obtaining another forth order polynomial for P(d, V). Figure 6 demonstrates the examples of power profile per revolution at 50 km h−1 and 100 km h−1, respectively. We evaluate the energy per revolution at four different speeds and build the polynomial for P(d, V). Equation (1) is used to obtain Pave which is considered in the optimization formulation (section 3).
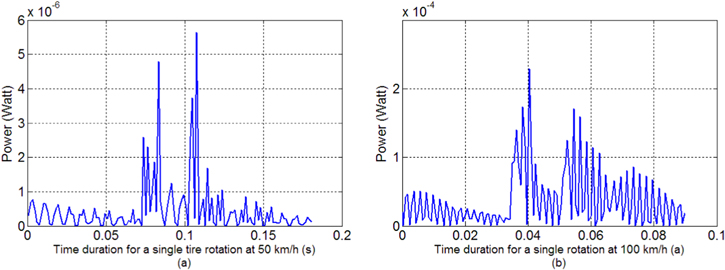
Figure 6. Time variant response for power: at 50 km h−1 (a), 100 km h−1 (b).
Download figure:
Standard image High-resolution imageA conservative stress evaluation concept is used in this paper, by considering the maximum stresses at the highest speed of vehicle speed profile. That is, the stresses are evaluated at the highest speed in f(V) (100 km h−1) and the maximum stress values (from substrate and PZT) in one rotation cycle are figured out as shown in figure 7. We use these maximum values in the design formulation, constrained to be less than the yield stresses of substrate and PZT material.
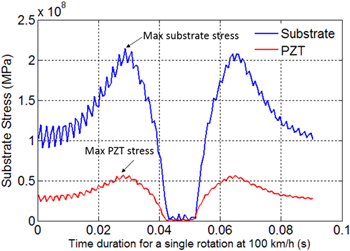
Figure 7. Time variant response for stresses at the highest speed (100 km h−1).
Download figure:
Standard image High-resolution image3. Optimization
This section explains the optimization process. First, the traditional DDO is applied to obtain the EH design that minimizes an objective function and satisfies three deterministic constraints. Then, we will explain the details of reliability-based design optimization (RBDO) and its merits over DDO. In both cases, the varied loading condition (varied vehicle speed) is considered. Equation (1) is used to evaluate the energy per revolution. Also, time variant stresses profile are measured at the highest speed of vehicle (100 km h−1) and the maximum values are used in the optimization formulation.
3.1. Deterministic design optimization (DDO)
This subsection explains the formulation of the DDO. This method is a typical optimization process where the design variables are found to minimize (or maximize) the objective function while satisfying the constraints. The objective function is chosen to be the envelope volume of EH which is defined as the total length of harvester multiplied by the width and its overall thickness. The envelope volume indicates the smallest box volume that includes the harvester, and it is considered as the objective function for the compactness of the harvester design. Since the design should satisfy minimum power requirement and also durability, three constraints are defined in the DDO formulation as:
where vector d represents the design variable set as described in table 1. Also,  and
and  are the lower and upper bounds for each design variable. Three geometrical design variables—length of substrate (Ls), length of PZT (Lp), and width of harvester (W)—in addition to load resistance (R) and seismic mass (m) are considered in the DDO. As mentioned in section 2.1, it is not practical to consider the thickness as a continuous design variable, so both substrate and PZT thicknesses are considered to be constant. A formulation in equation (2) considers two kinds of constraints. G1 and G2 are the stress constraints where the maximum stresses
  are evaluated at the highest speed of vehicle. G3 is the constraint on the energy per revolution (Pave) where Preq is set as 6.1 μJ/rev as described in section 2.3.
3.2. Reliability-based design optimization
The dynamics of most vibration harvesters is sensitive to the uncertainty of physical parameters such as geometry and material properties. Even though some studies have been conducted on quantifying the effect of uncertainties in the physical parameters (e.g. manufacturing, materials, and operations) on the power generation of the EH [23, 24, 26, 34, 35], little to no EH design study has been conducted to consider the uncertainties. This has become the motivation of this study to address a question how to design an EH with reliable power generation despite the uncertainties that cannot be handled using classical DDO methods. RBDO, which accounts for the stochastic nature of an engineered system, is considered in this study as a potential solution to the question. In general, RBDO integrates the techniques of reliability analysis and design optimization that offer probabilistic approaches to engineering system design [36–43]. RBDO attempts to find the optimum design that minimizes the cost (e.g. volume, mass, or price), with the consideration of reliability with respect to system performance (e.g., durability, power output) while accounting for various sources of uncertainty (e.g. material properties, geometric tolerances, and loading conditions).
In RBDO, reliability is defined as the probability that a system performance meets its specification limit under various sources of uncertainty. Reliability analysis, as a critical element of RBDO, has a significant impact on the accuracy and efficiency of an RBDO solution. Mathematically, reliability analysis entails the computation of a multi-dimensional integration of a joint PDF over a reliable domain, expressed as  where Rel is the reliability, X = [X1, X2, ..., XN]T is a N-dimensional vector of random variables that models sources of uncertainty such as material properties, loads, and geometric tolerances,
 is the joint PDF of X, and
  is the reliable (or safe) domain and can be defined in terms of a system performance function G(X) as
  It is noted that, in this paper, a random variable used in RBDO is denoted by the upper-case letter X, and particular realization of the random variable are denoted by the lower-case letter x. In the context of EH design, the performance function G is defined as the predefined power requirement (Preq) of a TPMS sensor subtracted by the output power (Pave) of the EH design, i.e. G = Preq − Pave. Then, it becomes obvious that G(X) < 0 represents the reliable domain where the output power is larger than required. Also, two other performance functions have been defined to ensure that maximum stresses in the PZT and substrate do not exceed the yield stresses.
Both DDO and RBDO try to minimize the objective function while satisfying the constraints. DDO deals with deterministic design constraints while RBDO converses with probabilistic constraints that accounts for various sources of uncertainty. The difference between DDO and RBDO is graphically shown in figure 8 in a two-dimensional design space, where X1 and X2 are random design variables. DDO usually pushes the optimum point to the boundaries of reliable domain, i.e. G(X) = 0, and it leaves small room for uncertainty in the design variables (shown as small red dots around the DDO point). That means, a small design perturbation of the DDO design will move the design into the failure region and violate design constraint(s). However, in RBDO, the DDO point is pushed to the reliable region, G(X) < 0. Figure 8 shows the true limit state function (G(X) = 0, solid line) as well as its approximated one (dashed line). Also, the concentric ellipses around the RBDO mean design point d =  illustrates the contours of the joint PDF of the two design variables. And the scattered points around the mean design are random design points which are generated based on the joint PDF.
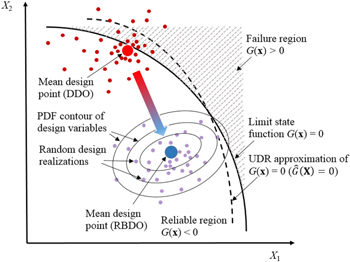
Figure 8. Schematic comparison between DDO and RBDO.
Download figure:
Standard image High-resolution imageDepending on how reliability analysis is performed, existing RBDO methods can be categorized into two groups: (i) the first- or second-order reliability method (FORM/SORM), or FORM/SORM-based methods [36–43], and (ii) dimension reduction (DR) based methods [44–46]. The FORM/SORM-based RBDO methods employ the FORM/SORM to perform reliability analysis. The FORM/SORM uses the first- or second-order Taylor expansion to approximate the limit state function (G = 0) at the most probable point (MPP), where the limit state function separates the reliable region (G < 0) from the failure region (G > 0). Some major challenges of the FORM/SORM include: (i) iterative sensitivity analyses are required for identifying the MPP; and (ii) the high nonlinearity of the limit state function or the existence of multiple MPPs could result in a relatively large error in the reliability estimate. These challenges have stimulated a large amount of research on the so-called DR method. This method approximates a multi-dimensional response function as a hierarchical superposition of low-order component functions so that it enables an efficient yet accurate formulation of this response function. A specialized version of this method is called the UDR method, which simplifies one multi-dimensional response function to multiple one-dimensional component functions [21, 44, 45]. Recent RBDO studies [44, 45] reported superior efficiency and satisfactory accuracy of the UDR method in solving RBDO problems. The next section describes UDR method which has been used to estimate where G(X) = 0.
3.2.1. Univariate dimension reduction
DR is a widely used method for reliability analysis. UDR is a special case of DR which additively decomposes a multi-dimensional performance functions into a finite set of one-dimensional component functions [46]. A univariate approximation of the performance function G(X) with the mean vector of the input random variables  excluding Xi, N-dimensional random vector X = [X1, X2, ..., XN]T can be expressed as:

To appraise the accuracy of univariate decomposition method, we can expand the univariate function using Taylor series. Therefore, the Taylor expansion of the ith univariate function  at
at  can be obtained by:

where  is the jth partial derivative of
  with respect to
  evaluated at the mean vector μ. Hence, the Taylor series of the univariate decomposition at the mean point (equation (4)) can be rewritten using equation (5):

And the Taylor series expansion of the performance function  can be expressed as:
It should be noted that the univariate decomposed response contains univariate terms of any order in the Taylor series expansion. Hence, there is no limitation in UDR to represent the order of nonlinearity in the performance function. In equation (6), ε refers to the residual error from ignoring the second- and higher-order expansion terms which is far less than the second order Taylor expansion error for reliability analysis [46]. ε has a negligible effect in most engineering applications in which  is sufficiently smooth, so is ignored in this paper.
3.2.2. Interpolation method for performance function evaluation
Reliability analysis requires large number of function evaluation to approximate  In order to reduce the computational cost, it is important to obtain performance function values at any arbitrary point efficiently. For the univariate function
  in equation (3), function values are evaluated at n + 1 sample points
  per each Xi, and nN + 1 sample points for a general N variable case. Cubic spline interpolation (CSI) is used in this paper to estimate performance function values at any arbitrary point. This interpolation evaluates function values accurately at n + 1 sample points and its first and second-order derivatives are continuous. The CSI formulation can be expressed as:

where Yi is an arbitrary function to be interpolated, ![${X}_{i}\in [{x}_{i}^{j},{x}_{i}^{j+1}],$](https://content.cld.iop.org/journals/0964-1726/26/10/105037/revision2/smsaa8886ieqn20.gif) and
and  also
also  are the coefficient of the polynomial for the jth interval, which can be determined by solving four independent linear conditions [47]. Therefore, we can measure the performance function values at any point using equation (7).
3.2.3. Uncertainty quantification
UDR and CSI construct the approximated function  of the original performance function G as it is shown in figure 8. Now, it is essential to estimate any probabilistic characteristic of
  including PDF, statistical moments, and reliability. This estimation is validated by comparing them with MCS. As aforementioned the approximation of the reliable domain for the performance function is defined as
  Hence, reliability can be quantified using MCS as the following:
where ns is the number of samples used in the MCS and  is the indicator function for the safe or fail situation as it is described below:

We used 100 000 samples points in the MCS study that employs the explicit interpolation of  instead of real function evaluation G, so the computational cost is not significant.
3.2.4. RBDO formulation
In this paper, RBDO is used to optimize design variables and improve the reliability for EH, while accounting for the uncertainty in geometric tolerances. In order to observe how RBDO approach improves DDO design, its formulation is done based on the DDO formulation in equation (2). That is, the objective function is defined identically to minimize the envelope volume while three performance constraints are revised as follow:
In the above equation, vector ![${\bf{X}}=[{X}_{1},{X}_{2},{X}_{3}]$](https://content.cld.iop.org/journals/0964-1726/26/10/105037/revision2/smsaa8886ieqn28.gif) is the random design variable and
is the random design variable and ![${\bf{d}}=[{d}_{1},{d}_{2},{d}_{3}]={\boldsymbol{\mu }}({\bf{X}})$](https://content.cld.iop.org/journals/0964-1726/26/10/105037/revision2/smsaa8886ieqn29.gif) is the mean design vector;
is the mean design vector;  and
and  are the lower and upper bounds on
  for
for  Each G demonstrates the performance functions which enables the definition of reliability constraints; Φ is the cumulative distribution function of the standard normal distribution to a target reliability index βt(=3), Rt is the corresponding target reliability level (99.87%). Minimum power requirement is equal to the DDO case. Three design variables are assumed to have normal distributions with their standard deviations listed in table 4.
Table 4. Random design variables for the EH design.
| Design variable | Description | Distribution type | Standard deviation 
|
|---|---|---|---|
| X1 | Length of substrate | Normal | 5% of DDO point |
| X2 | Length of PZT | ||
| X3 | Width of harvester |
For solving DDO and RBDO problems (equations (1) and (10)), the sequential quadratic programming (SQP) algorithm is used which can start from infeasible domain where all of the constraints are not satisfied; maximum stresses exceed their yield stresses and/or the generated power is less than required.
4. DDO and RBDO results and their comparison
4.1. DDO results
In the DDO case the optimization history is converged after 16 iterations. Tables 5 and 6 demonstrate the comparison between the results for the start point and optimum point in the DDO study. Since the maximum stress exceeds the yield stress in the PZT layer (45 MPa in table 2) at the initial point, the harvester width has increased to reinforce the structure and reduces the stresses. The increase of PZT area (12.4 × 12 to 10.29 × 15.52), even though its length decreases, contributes to the power increase by 1.5 times.
Table 5. Comparison between the initial and optimum designs in DDO study.
| Design variables | Substrate length (mm) | PZT length (mm) | EH Width (mm) | Resistance (Ω) | Seismic mass (gr) |
|---|---|---|---|---|---|
| Initial | 24.8 | 12.4 | 12 | 1.00E + 3.6 | 3.3 |
| Optimal | 25.77 | 10.29 | 15.52 | 1.00E + 3.8 | 3.53 |
Table 6. Comparison between the initial and optimum performance in DDO study.
| Performance | Maximum substrate stress (MPa) | Maximum PZT stress (MPa) | Generated power (J/rev) | Objective function (volume, mm3) |
|---|---|---|---|---|
| Initial | 184.7 | 49.1 | 5.47 | 138.9 |
| Optimal | 183.0 | 45.0 | 8.38 | 186.8 |
4.2. RBDO results and comparison with DDO
Since RBDO requires uncertainty quantification and reliability analysis every iteration, its computational cost is more expensive compared to DDO. To save computational cost, the RBDO study in this paper uses the DDO optimum point as an initial guess in using the same optimization algorithm (SQP). The uncertainty of geometrical tolerances due to manufacturing error is considered for the first three design variables—the length of substrate (Ls), length of PZT (Lp) and the overall width of harvester (W). Resistance and seismic mass are fixed at the DDO optimum point. In the RBDO case, it took 78 iteration to obtain the converged result which means that RBDO requires nearly five times of computational cost compared to the DDO case. Tables 7 and 8 demonstrate the results for the RBDO study compared to the DDO. Three constraints in table 8 indicates the value at the mean design point (μ).
Table 7. Results comparison for the RBDO study and DDO.
| Design variables | Substrate length (mm) | PZT length (mm) | EH Width (mm) |
|---|---|---|---|
| DDO optimum | 25.77 | 10.29 | 15.52 |
| RBDO optimum | 25.14 | 11.63 | 16.31 |
Table 8. EH performance evaluation for RBDO case.
| Performance | Maximum substrate stress (MPa) | Maximum PZT stress (MPa) | Generated power (J/rev) | Objective function (volume, mm3) | Average system reliability |
|---|---|---|---|---|---|
| DDO | 183.0 | 45.0 | 8.38 | 186.8 | 73.67% |
| RBDO | 159.6 | 41.2 | 6.62 | 191.5 | 99.17% |
Figure 9 demostrates the sequence of EH design variation from initial point to the DDO and RBDO. Transition from DDO to RBDO means getting a more conservative design due to the presence of uncertainties (detail discussion is available in section 4.2.1). That is, the RBDO design is reinforced compared to the DDO design and less flexible. This change is consistently observed in figure 10 that shows the transient response of EH at the highest car speed (100 km h−1). The stress waveform is very similar that of the input acceleration. In both figures one can observe the high frequency vibration of which the frequency corresponds to the resonant frequency of the DDO (740 Hz) and the RBDO (880 Hz) design, respectively.
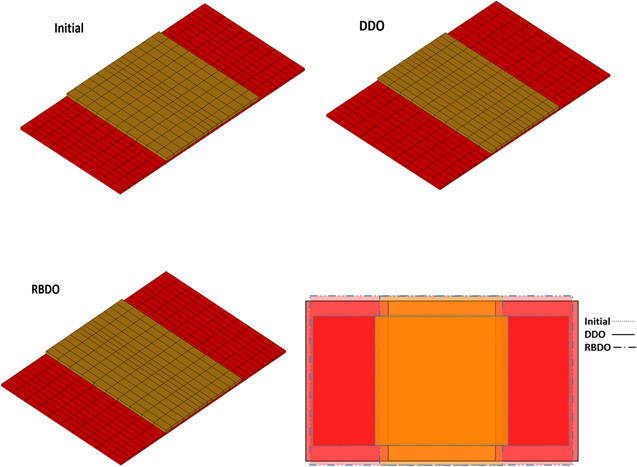
Figure 9. EH design comparison between initial model, DDO, and RBDO.
Download figure:
Standard image High-resolution image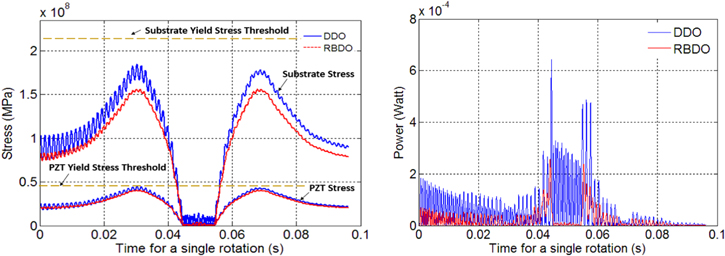
Figure 10. Transient response results for the substrate stress, PZT stress, and power at the highest speed.
Download figure:
Standard image High-resolution imageOne can observe from figure 10 that that the stresses values for both the DDO and RBDO case are lower than the yield stresses. But, the magnitude of stresses for the RBDO case is less than the DDO due to the increased width (W) and decreased substrate length (Ls). Obviously the amount of generated power is reduced campared to the DDO case. However, the RBDO process finds a satisfactory trade-off point to satisfy the power generation requirement by increasing PZT length (Lp).
Figure 11 depicts the corresponding stresses contours in the FEA model for the substrate and PZT. The maximum stress for the DDO case happens at the both ends of substrate and PZT. Therefore the increased width (W) and the decreased length (Ls) reduce the stresses.
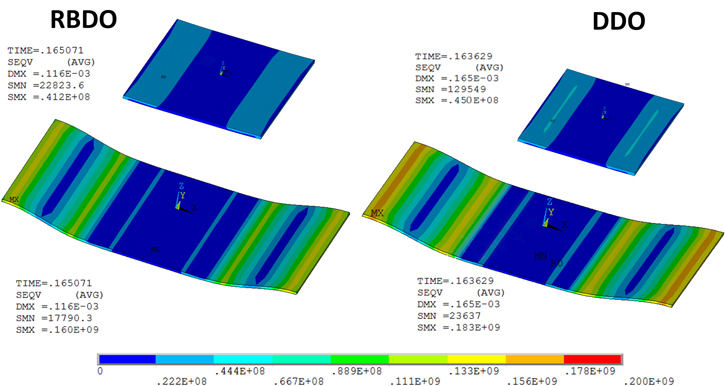
Figure 11. Comparison of stress contour for the substrate and PZT at the highest speed in DDO and RBDO cases.
Download figure:
Standard image High-resolution imageBased on the uncertainty study results, RBDO study increases the system reliability by 25.5% (from 73.67% to 99.17%) resulted from the satisfactory reliability constraints (Rel1 to Rel3 in equation (10)). This increment in the reliability has sacrificed the objective function by only 2.5% which is acceptable. Figure 12 shows the comparison on the PDFs between the RBDO and DDO optimum point which is computed from univariate response surface. In these figures, the area under a PDF curve for  represents the probability that each performance function is satisfied. For the first (G1, substrate stress) and second performance functions (G2, PZT stress), reliability has been increased drastically. The reliability for the third performance function (G3, power) reduces from Rt = 100% to Rt = 97.53%. However, the minimum power requirement is still satisfied for the RBDO design.
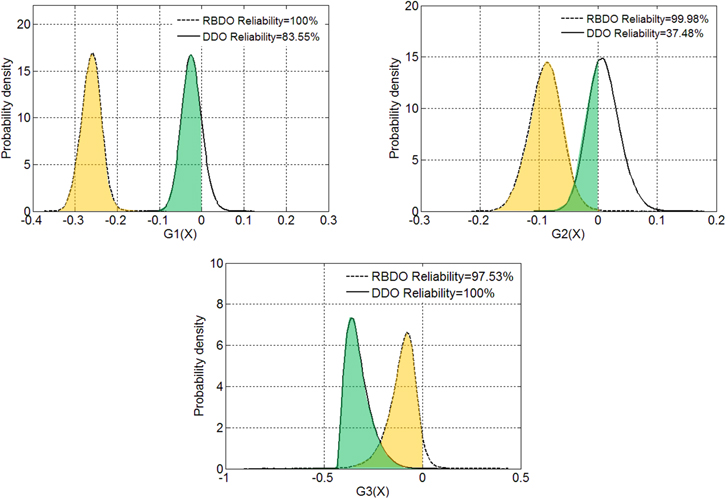
Figure 12. PDF of performance functions obtained from univariate response surface.
Download figure:
Standard image High-resolution image4.2.1. Interpretation of RBDO results
In order to understand the physical implication of the RBDO result compared to the DDO, it is essential to investigate the behavior of performance functions (G) in more details. In this section, the variation of three performance functions is further investigated around the DDO optimum point. Figures 13–15 demonstrate the 3D contour plots of performance functions with the first three design variables (Ls, Lp, W). Each plot is centered at the DDO optimum point, and two parameters vary in a span of  to construct the 3D contour plot while the other parameter is fixed at the DDO optimum. The border for the limit state function (G(X) = 0) is shown with a black solid line. From these figures, the critical performance function is G2 as its infeasible region is found (G2 > 0). Therefore, RBDO tries to evolve the design to move into the safe domain of G2. Based on these plots, it is obvious that decreasing Ls and increasing W can improve the design to get into the feasible domain and satisfy the reliability constraints for G2. Moreover, it can be observed from G3 contour plot in figure 15 that increase of Lp improves power reliability (Rel3). This observation from the 3D contour plots justifies the results in tables 7 and 8. To summarize, the merits of RBDO design can be distinguished from DDO design as it reduces the stresses magnitude for both PZT and substrate layers and increases the reliability drastically. Also, the power reliability, even slightly reduced from the DDO, still exceeds its requirement.
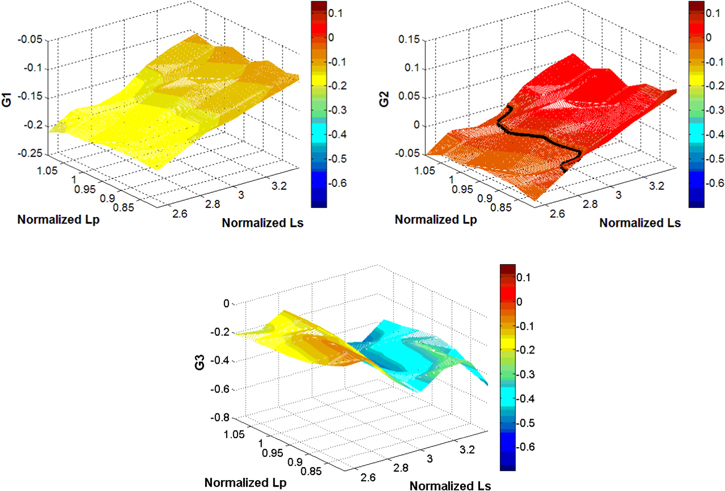
Figure 13. Sensitivity of performance functions with respect to Ls and Lp.
Download figure:
Standard image High-resolution image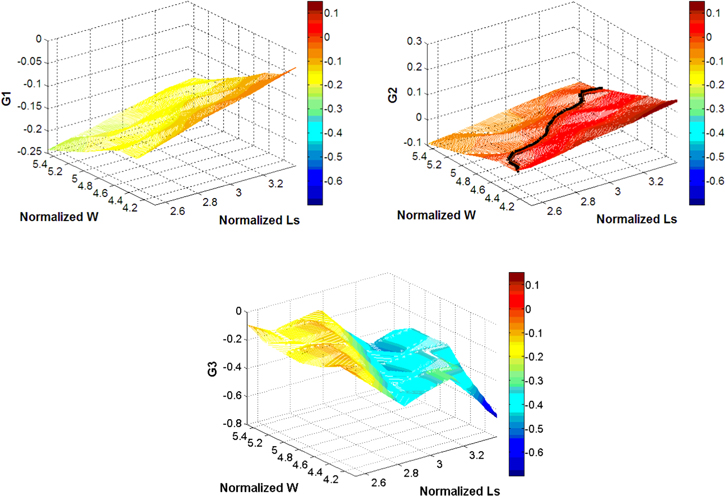
Figure 14. Sensitivity of performance functions with respect to Ls and W.
Download figure:
Standard image High-resolution image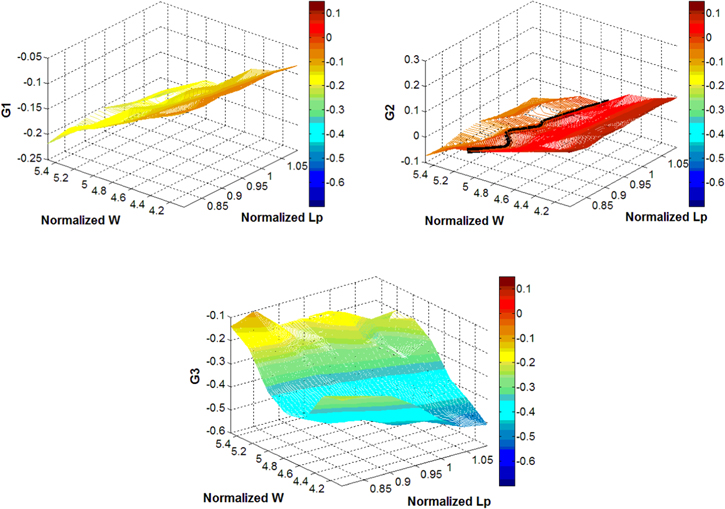
Figure 15. Sensitivity of performance functions with respect to Lp and W.
Download figure:
Standard image High-resolution image5. Experimental verification
5.1. Sample preparation
The optimized EHs for DDO and RBDO cases in the section 4 was manufactured for the experimental evaluation. Precise and careful machining is required because the dimensional precision is in the order of 0.01 millimeter, and PZT is very brittle. We used laser cutting to manufacture all the pieces. The electric potentials (or voltage) of the substrate and the PZT electrode facing the substrate are all identical. Therefore, a conductive epoxy (8331 s-Silver Conductive Epoxy, MG chemicals) is used to attach the PZT layer to the substrate. The conductive epoxy is spread on the substrate in a very thin layer and the PZT layer is put on the top, and cured using a heavy mass on top of it in the room temperature for 24 h. After curing the epoxy, the proof mass is glued to the bottom layer of substrate using super glue (E-120HP, Loctite). Also, a very thin electric wire is soldered to both substrate and the top electrode of PZT layer for the electrical wiring. The prototyping process is shown in figure 16.
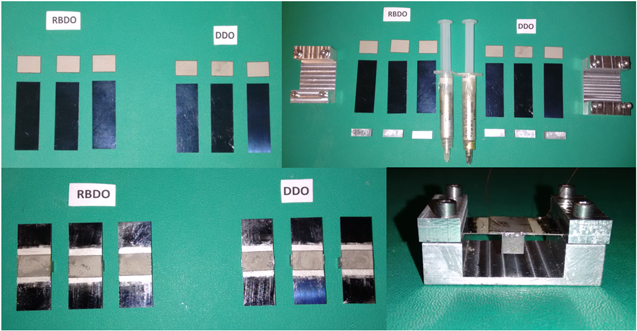
Figure 16. Energy harvester preparation for the experiment.
Download figure:
Standard image High-resolution image5.2. Testing set-up
The prototyped harvesters are glued on the inner surface of the tire as shown in figure 17; DDO and RBDO harvesters are attached 180° apart from each other. Two different jigs for both DDO and RBDO are manufactured and glued using epoxy and cured for another 24 h for secure attachment. After mounting both harvesters to the corresponding jigs, the tire is assembled with the rim.
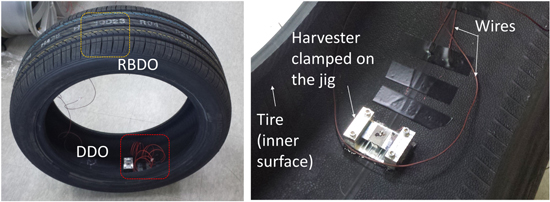
Figure 17. Harvester installation on the inner surface of the tire.
Download figure:
Standard image High-resolution imageFigure 18 shows the entire test setup where the tire is in contact with the roller which is belted to the motor. The spinning speed is detected by the laser speedometer as shown in figure 18(a). A special attention should be paid on wiring and signal acquisition from the harvesters which spins with the tire in a high speed. We use a wireless signal transmitter mounted on the rim depicted in figure 18(b). The external loads (resistors) are connected to the both ends of the wires from each harvester. This way we can prevent wire entangling during the experiment.
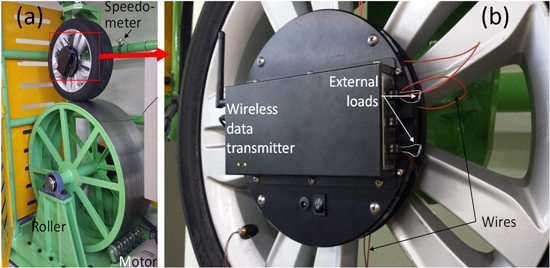
Figure 18. Data transmission during tire operation.
Download figure:
Standard image High-resolution image5.3. Experiment results
Experimental tests has been done to demonstrate the differences in the performance of two designs (DDO and RBDO). We measured the output voltage of EH for both DDO and RBDO case at two different velocities (10 and 20 km h−1). These measurements are conducted for seven consecutive runs. Figure 19 shows the typical output voltage for the DDO and RBDO samples. Two harvesters are glued at the opposite position in the tire, so the voltage peaks are found 180° apart from each other, and these are the moments when each harvester hits the ground.
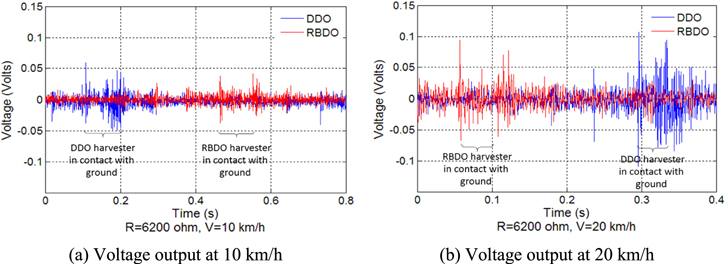
Figure 19. Experimental output voltage comparison for DDO and RBDO cases at two different velocities.
Download figure:
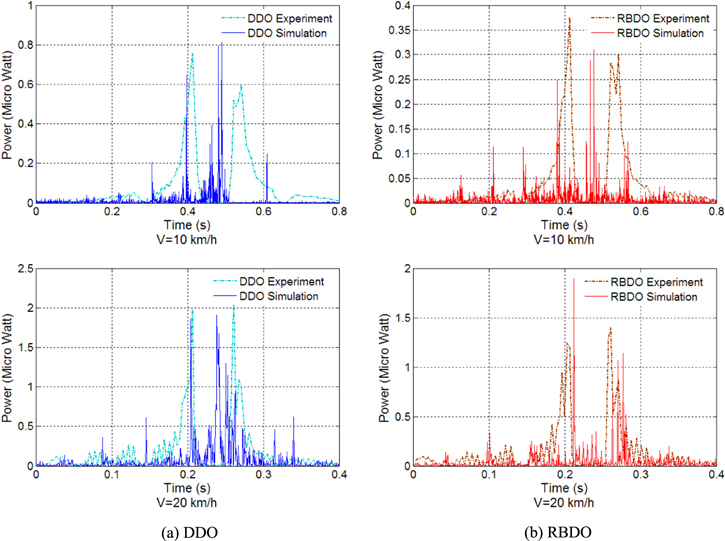
Standard image High-resolution imageFigure 20 compares the output power between the simulation and experimental results for both DDO and RBDO cases at 10 and 20 km h−1. Due to complex vibration loading not explained in the simulation, the experimental voltage waveform is different from the simulation. Table 9 demonstrates the amount of energy per revolution by integrating power over time per one revolution cycle. As one can review, the energy from the experiment is smaller than the simulation. But one can observe the high impact region of voltage when the tire hits the ground, commonly from simulation and experiment. Also the table shows that the power ratio between DDO and RBDO is very similar between simulation and experiment—RBDO cases show about 40%–50% of power compared to DDO cases. On the other hand, RBDO case has a very satisfactory performance in comparison with DDO. Although we did not have the facility to measure the stress magnitude during the test, we observed that the DDO samples failed (PZT is cracked) as we increased the velocity above 20 km h−1 while the RBDO samples were not broken at higher velocities up to 60 km h−1. To summarize, the benefit of RBDO design is consistently observed in the experiment—excellent durability by lowering power generation to the required value.
Figure 20. Comparison between the simulation and experimental results.
Download figure:
Standard image High-resolution image
Table 9. Comparison of energy per revolution.
| Energy per revolution (μJ/rev) | ||||
|---|---|---|---|---|
| Velocity | Experiment | Simulation | ||
| DDO | RBDO | DDO | RBDO | |
| 10 km h−1 | 0.119 | 0.0638 | 0.237 | 0.108 |
| 20 km h−1 | 0.38 | 0.163 | 0.622 | 0.239 |
6. Conclusion
In this paper, we investigate a reliable design for a vibration based piezoelectric EH implemented in a rotating tire. Due to the dynamic operation conditions in a rotating tire, it is crucial to construct a high-fidelity analysis model that considers transient response of EHs such as time varying power generation and dynamic stress/strain. Radial acceleration in a rotating tire is considered as the vibrational energy source and used in the transient analysis. This paper firstly tries DDO using this high-fidelity analysis model. Since the compactness of the EH is very important to maintain the weight balance of the tire, the design problem is formulated to minimize the volume. Predetermined power requirement and the yield stresses for EH material parts are considered in the design formulation as the constraints. The DDO starts at a point in the infeasible domain (all the constraints are not satisfied), but ended at the optimum point to the boundaries of feasible domain (G2 = 0). RBDO is then exploited to improve the reliability of EH in the presence of uncertainties from manufacturing and operating conditions. The DDO point is used to initiate RBDO study. As a result, the reliability of EH is increased significantly by 25.5% while sacrificing the objective function only by 2.5%. Comparing the results of the DDO and RBDO, it could be understood that DDO merely seeks a deterministic optimum design that achieves a minimum volume while satisfying the deterministic constraints. However, RBDO obtains a probabilistic optimum design for a minimum volume while satisfying the reliability requirement on the power and stresses. Also, experiment test has been done to compare the performance of EH for both DDO and RBDO optimum designs. What is claimed in this paper is that RBDO is a valuable tool and a practical solution to obtain a reliable design of vibration energy harvesters despite the presence of various uncertainties.
In this paper, UDR method is used to estimate the performance functions. Exploiting other surrogate models rather than UDR such as kriging, polynomial chaos expansion, and neural networks to enable precise performance evaluation with reduce computational cost could be proposed for the future works.
Acknowledgments
This research was supported by Sponsored Research Grant from Korea Institute of Machinery and Materials (KIMM, 2015). The authors appreciate Potomac Photonics (Baltimore, MD) for their professional support on prototyping.