
Abstract
Objectives. Clinical assessment of skin perfusion informs prognosis in critically ill patients. Video camera monitoring could provide an objective, continuous method to monitor skin perfusion. In this prospective, interventional study of healthy volunteers, we tested whether video camera-derived photoplethysmography imaging and colour measurements could detect drug-induced skin perfusion changes. Approach. We monitored the lower limbs of 30 volunteers using video cameras while administering phenylephrine (a vasoconstrictor) and glyceryl trinitrate (a vasodilator). We report relative pixel intensity changes from baseline, as absolute values are sensitive to environmental factors. The primary outcome was the pre- to peak- infusion green channel amplitude change in the pulsatile PPGi waveform component. Secondary outcomes were pre-to-peak changes in the photoplethysmographic imaging waveform baseline, skin colour hue and skin colour saturation. Main results. The 30 participants had a median age of 29 years (IQR 25–34), sixteen (53%) were male. A 34.7% (p = 0.0001) mean decrease in the amplitude of the pulsatile photoplethysmographic imaging waveform occurred following phenylephrine infusion. A 30.7% (p = 0.000004) mean increase occurred following glyceryl trinitrate infusion. The photoplethysmographic imaging baseline decreased with phenylephrine by 2.1% (p = 0.000 02) and increased with glyceryl trinitrate by 0.5% (p = 0.026). Skin colour hue changed in opposite direction with phenylephrine (−0.0013, p = 0.0002) and glyceryl trinitrate (+0.0006, p = 0.019). Skin colour saturation decreased with phenylephrine by 0.0022 (p = 0.0002), with no significant change observed with glyceryl trinitrate (+0.0005, p = 0.21). Significance. Drug-induced vasoconstriction and vasodilation are associated with detectable changes in photoplethysmographic imaging waveform parameters and skin hue. Our findings suggest video cameras have great potential for continuous, contactless skin perfusion monitoring.
Export citation and abstract BibTeX RIS

Original content from this work may be used under the terms of the Creative Commons Attribution 4.0 licence. Any further distribution of this work must maintain attribution to the author(s) and the title of the work, journal citation and DOI.
1. Introduction
Changes in skin colour, temperature, or overall appearance (e.g. mottling) are associated with increased mortality and worsening organ failure (Ait-Oufella et al 2012). Currently, skin changes are detected solely through clinical examination, are subjective and not easily quantified. Digital video cameras could provide an objective tool to monitor visible skin changes.
Reliable physiological measurements can be obtained from video camera monitoring. Video cameras can provide accurate heart and respiratory rate measurements, both in controlled settings (Harford et al 2019) and in clinical areas such as the neonatal intensive care unit (Villarroel et al 2019), renal dialysis unit (Tarassenko et al 2014), and adult critical care unit (Rasche et al 2016, Jorge et al 2022), over protracted time periods. Camera-based heart rate monitoring usually involves analysis of the photoplethysmography imaging (PPGi) signal (Hu et al 2008). The PPGi signal is similar to the contact photoplethysmography (cPPG) signal used in pulse oximeters. The cPPG waveform has been shown to capture several haemodynamic parameters relevant to skin perfusion (Reisner et al 2008, Sun and Thakor 2016). The cPPG waveform contains two key components: the AC component captures pulsatile fluctuations in arterial flow with each cardiac cycle, while the DC component captures baseline light absorption (Chan et al 2013). The amplitude of the AC component changes in line with skin perfusion caused by central blood pressure changes or local vasoconstriction (Tusman et al 2019). In combination, analysis of the PPGi AC and DC components could provide an objective measurement of peripheral skin perfusion.
In this prospective, interventional study of healthy volunteers, we tested whether video camera-derived PPGi and colour measurements could detect drug-induced changes in skin perfusion. We measured outcome variables at baseline and after inducing peripheral vasoconstriction and vasodilation using intravenous phenylephrine and glyceryl trinitrate (GTN) respectively.
2. Methods
We reported the methods in accordance with the Standard Protocol Items: recommendations for Interventional Trials (SPIRIT) 2013 guidelines (Chan et al 2013).
2.1. Eligibility criteria
We recruited healthy adult participants aged 18 or over.
We excluded participants with: anatomical reasons for not being able to use reference monitors including pulse oximeter and thoracic bioimpedance monitors, lower limb amputation, previous lower limb surgery (except knee arthroscopy), allergy to electrocardiogram (ECG) sensor adhesives, hyperthyroidism, regular cardio- or vaso-active drug therapy except oral contraceptive pills, pregnancy/breastfeeding, known peripheral vascular disease, and frequent headaches (more than one episode per month). We did not exclude participants based on sex or skin colours/types.
2.2. Interventions
We administered one infusion of phenylephrine followed by one infusion of GTN to all participants to induce peripheral vasoconstriction and vasodilation respectively. Phenylephrine is a selective alpha-1 adrenergic agonist with potent vasoconstrictive effects. We chose phenylephrine as a vasopressor with selective effect on vessels without significant inotropy (Sniecinski et al 2007, VanValkinburgh et al 2018). GTN is a vasodilator whose active metabolite nitric oxide causes hypotension and tachycardia (Sniecinski et al 2007). The effects and safety of both drugs (at infusion rates used in this study) in healthy volunteers are well documented (Bashir et al 1982, Schmetterer et al 1996, Moppett et al 2008, Stewart et al 2016, Vargas Pelaez et al 2016).
2.3. Outcomes
The outcomes were:
Primary outcome:
- Change in the peak-to-trough amplitude of the pulsatile component of the PPGi waveform (AC component, AC in figure 1).
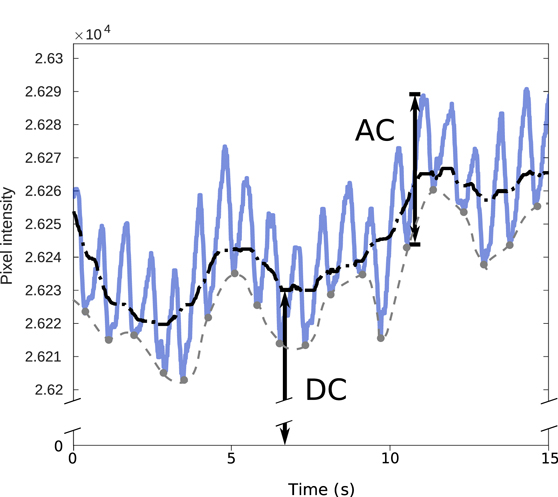
Figure 1. AC and DC components of the photoplethysmographic imaging (PPGi) waveform, using example data from the study. The AC compoment amplitude is the peak-to-trough amplitude of the pulsatile AC waveform, taken from a trough to the next peak as demonstrated (labelled 'AC'). There are two definitions of the DC component commonly used in the literature—the mean value of the overall waveform may be computed (black dash-dotted line, labelled 'DC'), or the baseline of the pulsatile waveform (grey dashed line) may also be computed using a trough detection algorithm. We used the mean pixel intensity as the DC component in our study, corresponding to the first definition (there is very little difference in practice between the two definitions, as the AC component amplitude is of the order of 0.1% of the DC component, as shown here). The lighting was controlled and movement limited in our experimental design to minimise the environmental effects on the DC component.
Download figure:
Standard image High-resolution imageSecondary outcomes:
- Change in the baseline amplitude of the PPGi waveform baseline (DC component, DC in figure 1).
- Change in colour hue and saturation of the skin (indicating the colourfulness of skin).
We measured all amplitudes in units of 16 bit pixel intensity for each colour channel (red/green/blue). We computed the outcome variables from a skin region of interest (ROI), selected manually over the participants thigh using the first video frame of each session. The ROI consisted of the largest rectangle comprised in the anterior thigh. We left an edge of at least 20 pixels along all sides to ensure the entire ROI remained in frame and unobstructed throughout the experimental period (allowing for small involuntary rotational or axial movements of the leg). We used the Kanade–Lucas–Tomasi algorithm for feature tracking (Lucas and Kanade 1981, Tomasi and Kanade 1991) to track the position and shape of the ROI throughout each session.
Intensity changes in a single colour channel reflected changes centred at the channel wavelength, rather than skin colour changes. To test whether any observed changes indicate skin colour change, we converted the RGB pixel intensity values to hue/saturation/value (HSV) colour model which has been shown to best indicate skin colour changes independent of ambient luminance (Chaves-González et al 2010). We used the originally described model for the conversion (Smith 1978, Pearl and Dorothy 2022). We used the Matlab HSV colourmap that standardises hue and saturation components to a range from 0 to 1 (unitless). The hue corresponds to the colour's position on a wheel, and is a circular scale where 0 and 1 both represent the colour red. A decrease in colour saturation represents a change towards white. The HSV colour space and the conversion algorithm used are described in supplemental file 1.
2.4. Participant timeline
The study consisted of a single visit for each participant. Each participant underwent two sessions: session A with phenylephrine infusion, and session B with GTN infusion. Both sessions lasted 28 min and consisted of 4 phases: rest, infusion rate escalation, peak infusion and washout. The sessions were separated by a 15 min unmonitored break.
Each session began with a 5 min rest period to collect baseline data. We then administered the drug infusion over 15 minutes according to the escalation protocol (available as supplemental file 2). We increased the infusion rates in pre-defined steps over the first 10 min. The phenylephrine infusion started at rate of 0.2 mcg.kg−1.min−1 and peaked at 2 mcg.kg−1.min−1. The GTN infusion started at rate of 0.15 mcg.kg−1.min−1 and peaked at 1.5 mcg.kg−1.min−1. We gave a 5 min stable infusion at the peak rate. We then stopped the infusion and monitored the participants for a further 8 min washout period. We determined the washout monitoring duration by the time taken for haemodynamic parameters to normalise in pilot cases. We positioned the participants semi-recumbent throughout.
2.5. Sample size
We chose a convenience sample size of 30 participants as this was a pilot/proof-of-principle study.
2.6. Data collection methods
2.6.1. Demographics and patient measurements
We collected the following background data on each participant:
- Age (years).
- Sex (m/f).
- Height (cm).
- Weight (kg).
- Skin colour/type using the Fitzpatrick scale (I–VI) and Von Luschan's chromatic scale (1–36).
- Smoking status.
Prior to the start of the experiment, we recorded participants baseline heart rate (beats per minute or bpm) and systolic, diastolic and mean arterial blood pressure (millimetres of mercury, mmHg). We used the baseline mean arterial pressure to calculate the maximum allowed deviation (30%) during drug infusions.
During the experimental period, we recorded the following reference variables:
- Heart rate, electrocardiogram (ECG), and finger cPPG: continuously measured using Philips IntelliVue MX800 patient monitor (Philips Healthcare, Amsterdam, Netherlands);
- Non-invasive blood pressures (systolic, diastolic, and mean arterial pressure): measured at one-minute intervals using Philips IntelliVue MX800 patient monitor;
- Cardiac output (CO): continuously measured using Cardioscreen thoracic bioimpedance monitor (Medis, Germany);
- Thigh skin perfusion: continuously measured (5 frames per second) using commercial laser speckle monitor (moorFLPI-2, Moor Instruments, Axminster, UK). Laser speckle contrast imaging has been used for perfusion monitoring in both research and clinical settings (Briers 2001, Millet et al 2011, Heeman et al 2019), as well as providing reference measurements of cutaneous perfusion (Rasche et al 2020).
2.6.2. Equipment and software
We recorded all outcome measurements using a visible spectrum RGB video camera (Grasshopper3 GS3-U3-51S5C, Point Grey Research, FLIR Systems, Oregon, USA). We collected data for all sessions using three-colour video (red, green, blue), with a resolution of 1280 × 960 pixels, at a rate of 60 frames per second (fps). We placed the camera 70 cm directly above the skin surface of the right knee (supplemental figure S1).
The right leg images included the frame area of the thigh, from at least 20 cm above the knee to at least 5 cm below the knee.
We used the ceiling fluorescent lighting and a dedicated 5600 K LED mosaic panel (Limelite 30 cm Mosaic Panel, Bowens, London, UK) for ambient illumination.
We time-synchronised all devices to a central computer connected to the Philips IntelliVue monitor.
2.7. Statistical methods
2.7.1. Identification of periods of interest
We defined rest as the 2 min period between minutes 2 and 4 of each session, allowing for the participant settling into the routine prior to the start of drug infusion at t = 5 min. We defined peak as the 2 min period between minutes 17 and 19 of each session. We chose this period to avoid any signal noise from the preparation to stop the drug infusion between minutes 19 and 20.
Where a participant was unable to tolerate peak drug infusion but was able to complete the full experimental period with lower infusion rate (highest infusion rate tolerated without side-effect), we used the same periods as the peak period.
2.7.2. AC analysis
Previous work has shown pulsatile PPGi signals in all three channels of the RGB camera (Tarassenko et al 2014, Villarroel et al 2019). The green channel provided the strongest signal, due to the spectral proximity of this wavelength range to the absorption peak of oxyhaemoglobin (Verkruysse et al 2008, Poh et al 2010). We used the green channel for the primary outcome analysis (results from other channels reported in supplemental table S1).
The raw PPGi signal is affected by respiratory movements, motion artefact, and environmental noise (e.g. shadows or light artefacts) (Sun and Thakor 2016). We removed the DC offset and frequency components outside the physiological cardiac range (Villarroel et al 2019). Further description of the analysis steps is included as supplemental file 3.
We defined the PPGi amplitude as the height or peak-to-trough displacement of the pulsatile component of the PPGi signal, measured in 16 bit pixel intensity units. We calculated the mean PPGi amplitude for each period of interest for each participant.
2.7.3. DC analysis
We computed the non-pulsatile DC component of the PPGi waveform mean value of raw intensity of all pixels within the tracked ROI (DC, figure 1), and used the median value for each period of interest as the DC measurement.
2.7.4. Colour analysis
We analysed colour hue and saturation (i.e. the colourfulness) so that colour content could be analysed with relative independence from ambient luminance levels. Skin baseline hue and saturation are known to vary depending on the skin and lighting colours (Nikolskaia et al 2018). For each period of interest (rest or peak) we computed the mean colour hue, saturation, and value (HSV) (Smith 1978, Chaves-González et al 2010) for all video images from the ROI used for the AC/DC analysis.
2.7.5. Variables
We reported measured variables in the following format as appropriate: mean (SD), median (IQR).
2.7.6. Before-after statistical testing
We computed paired values ('rest' and 'peak') of the following variables from the same tracked ROI:
- Amplitude of PPGi waveform (AC).
- Baseline of PPGi waveform (DC).
- Hue.
- Saturation.
For each participant, we computed rest/peak paired values corresponding to the above parameters for session A (phenylephrine) and session B (GTN).
We used the two-tailed Wilcoxon signed-rank test to test baseline to peak drug effect changes for significance. We measured the effect of both infusions on each outcome as the relative mean difference between the rest and peak periods. We report relative changes rather than absolute changes as the absolute pixel intensity value is sensitive to environmental factors such as the ambient light level.
We used Matlab (R2020b, Natick, Massachusetts, USA) for all analyses.
3. Results
3.1. Participants
We recruited 30 participants. All 30 participants underwent the drug infusions, 28 as planned to full pre-set infusion rates. Two participants reported mild nausea during GTN dose escalation, which was stopped at level 9 and level 7 respectively. As per protocol, we reduced the infusion rate to the prior rate. Symptoms settled in both participants, and they were able to complete the experimental timeline. As per the study protocol, we included these two participants in the final analysis, with the highest asymptomatic rate considered as the peak dose.
Participants had a median age of 29 years and BMI of 21.7 kg.m−2. Sixteen (53%) were male. The summary demographics of included participants are shown in table 1.
Table 1. Summary demographics of included participants. Values are absolute numbers or median (IQR).
| Age (years) | 29 (25–34) | |
| Sex (M/F) | 16/14 | |
| Weight (kg) | 67 (56–75) | |
| Height (cm) | 171 (162–177) | |
| BMI (kg.m−2) | 21.7 (20.3–25.1) | |
| Fitzpatrick | I | 9 |
| II | 10 | |
| III | 6 | |
| IV | 3 | |
| V | 2 | |
| VI | 0 | |
| Von Luschan | 8 (7–10) | |
3.2. Change in reference variables
The infusions caused detectable changes in heart rate, blood pressure, and cardiac output in all participants. The changes in reference vital sign measurements are shown in figure 2 and fully reported in supplemental file 4.

Figure 2. Changes to reference haemodynamic variables during the phenylephrine (a)–(d) and GTN (e) (h) infusion protocol. For each minute of the experimental period, the mean deviation from rest period is shown as solid line with error bars indicating standard error of the mean. Heart rate: (a) and (e); mean arterial pressure: (b) and (f); cardiac output: (c) and (g); flux measured by laser speckle contrast imager: (d) and (h). The periods of interest are highlighted as follows: rest period from minutes 2 to 4 (yellow), peak phenylephrine effect from minutes 17 to 19 (blue), peak GTN effect from minutes 17 to 19 (pink).
Download figure:
Standard image High-resolution imageTable 2. Comparison of rest and peak periods for phenylephrine and GTN sessions using the Wilcoxon sign rank sum test. Outcome variables: amplitude of PPGi waveform, PPGi baseline, and colour (hue and saturation) changes.
| Outcome variables | Phenylephrine | GTN | ||
|---|---|---|---|---|
| Primary | PPGi waveform | Percentage change | −34.7 | +30.7 |
| outcome | amplitude (AC) | (p value) | (0.0001) | (0.000 004) |
| Secondary | PPGi baseline (DC) | Percentage change | −2.1 | +0.5 |
| outcomes | (p value) | (0.000 02) | (0.026) | |
| Colour hue | Change | −0.0013 | +0.0006 | |
| (p value) | (0.0002) | (0.019) | ||
| Colour saturation | Change | −0.0022 | +0.0005 | |
| (p value) | (0.0002) | (0.21) | ||
The reference median skin perfusion (measured using the laser speckle contrast imager) at rest in session A was 117.5 (IQR 103.2–145.3) flux units. At peak phenylephrine effect, this decreased by 14.0 (9.8–23.8) flux units. The median skin perfusion at rest in session B was 115.1 (97.0–128.4) flux units. At peak GTN effect, this increased by 17.8 (8.9–25.9) flux units (figure 2, panels d and h).
3.3. Primary outcome
3.3.1. Change in pulsatile PPGi waveform amplitude (AC)
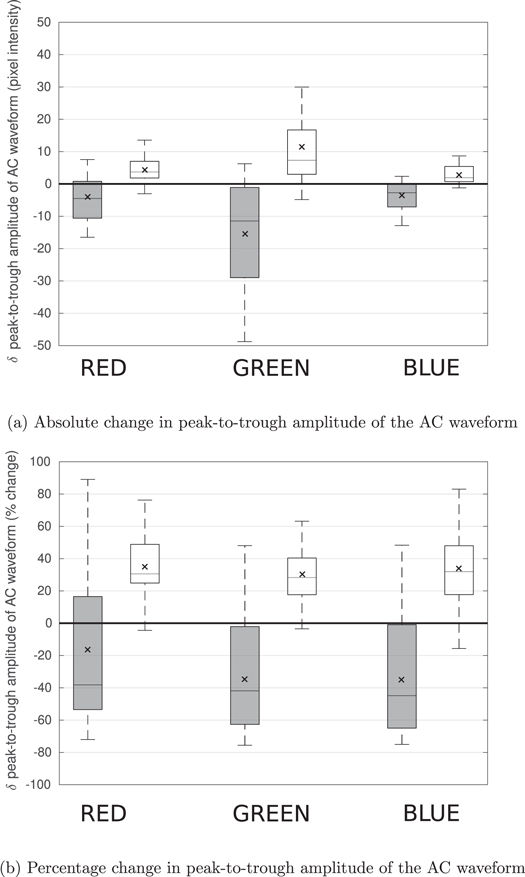
During peak phenylephrine effect, the PPGi amplitude decreased by 34.7% (95% CI 22.5–46.9) (p = 0.0001) in the green channel. During peak GTN effect, the amplitude increased by 30.7% (21.8–39.5) (p = 0.000 004) in the green channel (table 2). Change in PPGi amplitude in red/blue channels are shown in figure 3 and included in supplemental table S1. We performed a subgroup analysis of male and female participants according to the SAGER guidelines (Heidari et al 2016). The results are included as supplemental file 5. We found no significant differences between the male and female cohorts.
Figure 3. Rest-to-peak effect drug effect change in the amplitude of the pulsatile (AC) component of the PPGi waveform for the three colour channels. (a) Absolute change in amplitude across the three colour channels. (b) Percentage change in amplitude across the three colour channels. Responses to phenylephrine and GTN are shown in grey and white respectively. The mean changes are shown by an x inside each box. (a) Absolute change in peak-to-trough amplitude of the AC waveform. (b) Percentage change in peak-to-trough amplitude of the AC waveform.
Download figure:
Standard image High-resolution image
In all participants and across both infusions, we observed the greatest absolute change in PPGi amplitude for the green wavelength (figure 3(a)). The percentage changes in PPGi amplitude in response to the two drugs were comparable across the three colour channels (figure 3(b)).
The correlation between the drug-induced changes in macrohaemodynamic parameters and the changes in the peak-to-trough amplitude is further explored in supplemental file 6.
3.4. Secondary outcomes
3.4.1. Change in PPGi baseline (DC)
During the peak phenylephrine effect, the PPGi baseline decreased by 2.1% (1.2–3.0) (p = 0.000 02). During the peak GTN effect, the PPGi baseline increased by 0.5% (0.1–1.2) (p = 0.026).
3.4.2. Skin colour changes (hue and saturation)
During peak phenylephrine effect, colour hue decreased by 0.0013 (0.0008, 0.0018) (p = 0.0002) and saturation by 0.0022 (0.0011, 0.0033) (p = 0.0002). During peak GTN effect, colour hue increased by 0.0006 (0.00014, 0.0011) (p = 0.019) but there was no significant change in saturation (+0.0005, 95% CI −0.0001, 0.0012) (p = 0.21). Although the p-values for the computed changes in hue and saturation are very small, these changes would not be visible to a clinician monitoring the colour images of the patient's skin.
Further description of changes in skin hue and saturation is included as supplemental figure S2 and supplemental file 1.
4. Discussion
We detected significant changes in the PPGi waveform induced by phenylephrine and GTN, consistent with vasoconstriction and vasodilation. During peak vasoconstriction, all PPGi amplitude measurements (AC amplitude, DC pixel intensity) and colour measurements (hue and colour saturation) decreased significantly. During peak vasodilation, all but one (colour saturation) PPGi amplitude measurements increased significantly.
4.1. Main findings and implications
To the best of our knowledge, this is the first study to demonstrate that drug-induced changes using central (rather than local) administration can be detected in the PPGi waveform from a skin region. Our systematic review of published video camera studies (Harford et al 2019) reports the use of exercise and the Valsalva manoeuvre to induce haemodynamic changes (Sugita et al 2015, Jeong and Finkelstein 2016, Secerbegovic et al 2019). Movement associated with these methods can impede the analysis of PPGi waveform amplitude, and these previous studies were not able to demonstrate changes to the PPGi waveforms. Our study induced the perfusion changes pharmacologically while limiting movement, demonstrating that PPGi waveform changes are measurable. However, movement artefact outside of controlled conditions remains a significant factor to resolve. Settings where patient movement is limitedsuch as critical care units or operating theatresmay permit perfusion monitoring using the methods described here. Our results suggest that PPGi waveform analysis may offer a sensitive tool to monitor within-patient changes in skin perfusion.
Previous studies have shown that direct heat application can increase the peak-to-trough AC amplitude of the PPGi waveform (Kamshilin et al 2016, Volynsky et al 2019). Topical administration of capsaicin (which induces local vasodilation) has also been shown to increase the peak-to-trough AC amplitude of the PPGi waveform (Kamshilin et al 2018). The latter study reported a reduction in the DC component of the PPGi waveform with the administration of capsaicin alongside the increase in the AC amplitude. This is in contrast to the results we observed, where GTN-induced vasodilation led to an increase in both the AC and DC components. The differences may be due to several factors. Capsaicin and GTN have differing mechanisms of action (Roberts et al 1992). The differences may also be attributed to the topical delivery of capsaicin in the previous study which may have had secondary effects caused by skin reaction to the adhesive patch and the co-administered lidocaine. A strength of our study is the opposite response in both the AC and the DC components in response to centrally administered phenylephrine (a vasoconstrictor) and GTN (a vasodilator).
PPGi waveform analysis has several advantages over cPPG for haemodynamic/perfusion monitoring. The pulse oximeter probe position can affect the accuracy of a single spot cPPG reading (Chan et al 2013). Several probes would be required to compute cPPG from more than one site, which is cumbersome for patients. Pulse oximeter probes can exert pressure on the skin, which may affect the local perfusion measurements. In contrast, we can derive multiple regional PPGi concurrently using a contactless video camera. Our approach using PPGi to estimate skin perfusion may have wider clinical application beyond the current clinical use of cPPG, largely limited to pulse oximetry.
The human eye cannot detect the small fluctuations in reflected light that underlie the PPGi signal. The use of video cameras therefore allows sensitive detection of perfusion changes. The significant changes in colour hue and saturation in response to phenylephrine and the change in colour hue in response to GTN indicate that the changes in PPGi baseline (DC) are subclinical skin colour changes. When greater disturbance in perfusion occurs, these changes become clinically detectable as pale or hyperaemic skin. As a decrease in skin perfusion tends to occur in the earlier stages of physiological deterioration (Lima and Takala 2014), our results suggest that earlier detection of haemodynamic compromise may be possible.
4.2. Limitations
Our study has several limitations. We used drugs to induce changes in skin perfusion. How skin perfusion changes differ from those seen in acute illness, not driven by medication (for example, low blood pressure and peripheral vasoconstriction in hypovolaemic shock, compared to high blood pressure and peripheral vasoconstriction induced by phenylephrine) requires further work.
We followed a standard weight-based dosing regimen (up to tolerance by participants due to side effects, with maximum 30% variation in mean arterial pressure allowed for safety). We designed the dosing regimen based on prior healthy volunteer studies (Schmetterer et al 1996, Moppett et al 2008, Stewart et al 2016, Vargas Pelaez et al 2016) and with guidance from the pharmacy review during the ethics approval process. We did not aim to titrate drug dose in real time to achieve target blood pressure variation, as this would have been difficult to achieve (due to the limitations in the frequency of non-invasive blood pressure measurements, set at one-minute intervals). The pre-set drug doses also standardised the session timelines which is advantageous for image analysis. As expected, participants showed differing degrees of response, although the direction of physiological changes was consistent. Further work is required to understand how the changes observed compare with other clinical measures (e.g. changes in blood pressure) and whether the degree of physiological change can be quantified from changes in PPGi measurements. We measured cuff blood pressure as clinical gold standard. Future studies could consider the use of continuous non-invasive blood pressure monitors (Raggi and Sakai 2017).
Tissue perfusion index—the ratio between the AC and DC components (Hales et al 1989)—has been shown to reflect peripheral perfusion (Lima et al 2002). The evidence for tissue perfusion index is strongest from finger PPG (Lima et al 2002, Høiseth et al., 2015). The pulse oximeter encases the finger and both the light source and the detector are in direct contact with the skin. This eliminates a large proportion of potential environmental noise. In our study design, we suspected that environmental factors may affect the AC and DC components differently. Therefore, we considered the AC and DC components independently rather than examine the tissue perfusion index.
We conducted this study in healthy volunteers with a median age of 29 years. Changes in vessel compliance occur with ageing (Thijssen et al 2016) which will likely affect the use of the same techniques in an older population. In addition, we did not use skin colours/types for recruitment, and Fitzpatrick skin type VI was not represented in the dataset. Studies including these populations are required to further understand the utility of PPGi waveform analyses.
4.3. Future directions
We have demonstrated that high-quality PPGi waveform measurements allow amplitude changes to be used as a potential marker of vasodilation and vasoconstriction in healthy individuals. Our next steps are to perform further analysis of the PPGi waveforms in this controlled dataset for features that may contain useful haemodynamic information. We have observed that in light- and movement-controlled settings, both the AC and DC components change with drug-induced variation in skin perfusion. We aim to explore the use of video cameras for monitoring both components in clinical settings in future studies of skin perfusion changes.
5. Conclusion
We demonstrate that the amplitudes of both baseline and pulsatile components of the photoplethysmographic imaging (PPGi) waveform are altered in opposite directions by phenylephrine (a vasoconstrictor) and GTN (a vasodilator) infusions. The baseline changes were associated with opposite changes in hue with the two agents. Further work is needed to discover whether these changes translate into useful perfusion monitoring in clinical practice.
Acknowledgments
The authors would like to thank the participants who took part in the study and the research staff who helped in the running of the MOLLIE study, with specific thanks to Carlos Areia and Louise Young.
Ethical statement
We prospectively registered the study on the ISRCTN registry (ISRCTN 10417167). The Oxford University Research and Ethics Committee and Clinical Trians and Research Governance teams reviewed and approved the study (R63796/RE001). The research was conducted in accordance with the principles embodied in the Declaration of Helsinki and in accordance with local statutory requirements. All participants gave written informed consent to participate in the study.
Funding
This study was funded by the National Institute for Health Research (NIHR) Oxford Biomedical Research Centre and the Wellcome Trust. Specifically, MH, MV, JJ, SD, and PW were funded by the Oxford BRC.
Conflicts of interest
LT works part-time for Sensyne Health. PW was Chief Medical Officer for Sensyne Health until March 2020. LT and PW hold share options in the company. JJ is a Senior Research Fellow at Oxehealth Ltd since August 2021.
MH, MV, OR, SD, EF and DY: no competing interests declared.
Supplementary data (1.1 MB DOCX)