

Abstract
Acute respiratory distress syndrome (ARDS) is associated with a high rate of morbidity and mortality, as patients undergoing mechanical ventilation are at risk of ventilator-induced lung injuries. Objective: To measure the lung heterogeneity and deadspace volume to find safer ventilator strategies. The ventilator settings could then offer homogeneous ventilation and theoretically equalize and reduce tidal strain/stress in the lung parenchyma. Approach: The inspired sinewave test (IST) is a non-invasive lung measurement tool which does not require cooperation from the patient. The IST can measure the effective lung volume, pulmonary blood flow and deadspace volume. We developed a computational simulation of the cardiopulmonary system to allow lung heterogeneity to be quantified using data solely derived from the IST. Then, the method to quantify lung heterogeneity using two IST tracer gas frequencies (180 and 60 s) was introduced and used in lung simulations and animal models. Thirteen anaesthetized pigs were studied with the IST both before and after experimental lung injury (saline-lavage ARDS model). The deadspace volume was compared between the IST and the SF6 washout method. Main results: The IST could measure lung heterogeneity using two tracer gas frequencies. Furthermore, the value of IST ventilation heterogeneity in ARDS lungs was higher than in control lungs at a positive end-expiratory pressure of 10 cmH2O (area under the curve = 0.85,  ). Values for the deadspace volume measured by the IST have a strong relationship with the measured values of SF6 (9 ml bias and limits of agreement from −79 to 57 ml in control animals). Significance: The IST technique has the potential for use in the identification of ventilation and perfusion heterogeneity during ventilator support.
Export citation and abstract BibTeX RIS

Original content from this work may be used under the terms of the Creative Commons Attribution 4.0 license. Any further distribution of this work must maintain attribution to the author(s) and the title of the work, journal citation and DOI.
Abbreviations
| ARDS | Acute respiratory distress syndrome |
| ELV | Effective lung volume measured by the IST (l) |
| fp,i | Perfusion fraction to the lung compartment i |
| fv,i | Ventilation fraction to the lung compartment i |
Q
| Blood flow measured by the IST (l min–1) |
| VT | Tidal volume (ml) |
| VA | Alveolar lung volume (l) |
| VDIST | Deadspace volume measured by the IST (ml) |

| Deadspace volume measured by the SF6 (ml) |
| PEEP | Positive end-expiratory pressure |

| Ventilation (l min–1) |

| Perfusion (l min–1) |
1. Introduction
Acute respiratory distress syndrome (ARDS) is characterized by pulmonary inflammation and carries significant morbidity and mortality (Summers et al 2016). The prognosis of ARDS has improved within the past decades, with in-hospital mortality rates decreasing from 90% in the 1970s to approximately 30% in a recent study (de Prost et al 2011). Guidelines for mechanical ventilation have probably contributed to this result by reducing ventilator-induced lung injury. The mainstay of ventilator treatment is a reduction in tidal volume (VT ) and inspiratory and driving pressures, thereby reducing the stress and strain applied to the lungs. But there is currently no conclusive way to determine optimal ventilation for an individual patient at the bedside.
In ARDS the lung is mechanically very heterogeneous, causing heterogeneous and harmful ventilation. However, if lung mechanics could be homogenized [such as by positive end-expiratory pressure ( PEEP) titration and lung recruitment], the result could be more homogeneous, and thus less harmful, lung ventilation. Lung heterogeneity is the unequal distribution of airflow (ventilation) relative to the size of the lung regions to which it is distributed or to gas exchange to the bloodstream (perfusion) (West 2012). There are no simple methods that can be used at the bedside to evaluate lung heterogeneity or to quantify the effect of different manoeuvres and ventilator settings on lung homogeneity (Stahr et al 2016, Mountain et al 2018). The measurement of lung homogeneity could potentially benefit ventilated patients.
The inspired sinewave test (IST) was introduced as a non-invasive test which requires no cooperation from patients being tested and does not involve ionizing radiation. The IST applies a forced oscillation of a low dose of N2O tracer gas with a sinusoidal period which can be determined by the user. The results of the IST provide lung function parameters including deadspace volume (VD), effective lung volume (ELV) and pulmonary blood flow (Qp ) (Phan et al 2017b, Crockett et al 2019, Bruce et al 2018, Hahn and Farmery 2003, Clifton et al 2013). The IST results, including VD and ELV, provide suggestions for optimizing the ventilator setting. Furthermore, it is proposed that by using two tracer gas frequencies, the IST can quantify the ventilatory heterogeneity of the lung. In a previous study, the IST in combination with data from another lung function test (plethysmography) was able to detect changes in ventilatory heterogeneity which occur normally with age in healthy participants (Bruce et al 2018). In other research in simulated patients, the IST showed the potential to identify that simulated patients had emphysema (ventilation heterogeneity) and pulmonary embolism (perfusion heterogeneity) (Tran et al 2020). There is thus the possibility of developing the IST such that lung heterogeneity could be determined solely from the IST data without recourse to other techniques.
We therefore developed a model to quantify the degree of lung heterogeneity using the IST. We then performed experiments in anaesthetized piglets using only the heterogeneity obtained using the IST. The experiments included measurements before and after the lung was damaged by following the saline lavage protocol (ARDS model). We also compared the absolute VD measured by the IST with that obtained by SF6 washout.
2. Materials and methods
2.1. Measurement protocol
We developed a two-compartment lung simulation to provide a theoretical framework for understanding the ventilation and perfusion heterogeneity values measured by the IST. Then the IST was performed in animal models before (control) and after lung injury (ARDS). After that, the IST heterogeneity indices were calculated and compared with the PaO2:FiO2 ratio (or PFR; the ratio of partial pressure of oxygen in arterial blood and the fraction of inspired oxygena clinical indicator showing hypoxaemia). Additionally, VD measured by the IST was compared with the values measured by SF6 washout.
Animals were anaesthetized and instrumented; table 1 summarizes baseline data. Thirteen pigs were mechanically ventilated (volume-control ventilation) at 20–25 breaths min–1, with a VT of 10 ml kg−1 and an inspiratory/expiratory ratio of 1:2 (Servo-I, Maquet, Rastatt, Germany). The right internal jugular vein was cannulated and a pulmonary artery catheter was inserted and used to measure pulmonary artery pressure continuously and cardiac output via thermodilution intermittently.
Table 1. Animal baseline characteristics for n = 13 animals.
| Parameters | Control | Injured | p |
|---|---|---|---|
| Weight (kg) | 29 (2) | – | – |
| Heart rate (bpm) | 86 (12) | 85 (11) | 0.42 |
| CO (l min–1) | 3.4 (0.8) | 3.2 (0.4) | 0.26 |
| pH | 7.38 (0.07) | 7.25 (0.08) | 0.0004 |
| PaO2 (mmHg) | 144 (119–161) | 96 (85–195) | 0.39 |
| FiO2 | 0.4 (0.3–0.4) | 0.8 (0.7–0.9) | 0.0002 |
| PFR | 377 (304–513) | 128 (101–248) | 0.0002 |
Mean (SD) or median (95% confidence interval) for non-parametric data are shown. CO, cardiac output calculated by thermodilution; PaO2, arterial O2 partial pressure; FiO2, fraction of inspired O2; PFR, PaO2:FiO2 ratio.
During the IST, N2O tracer gas, added to the inspired air, was oscillated with periods of 60 and 180 s. PEEP levels were incrementally changed from 5 through 10, 15 and 20 cmH2O. The PaO2:FiO2 ratio and paired measurements of VD by the IST and SF6 washout test (VDIST and VDSF6) were recorded at each PEEP level. The SF6 washout test is a technique for measuring lung volume and VD using SF6 tracer gas (Larsson et al 1987). After measurements in the control group, lung injury was induced as described below, and the same measurements were repeated in the injured state.
2.2. Inspired sinewave test heterogeneity indices
In the IST analysis the VD inside the lung, VDIST, was first measured using the modified Bohr method (Phan et al 2017a). Secondly, ELV and Qp were calculated from a model assuming one well-mixed lung compartment (Bruce et al 2018).
Theory dictates that in a completely homogeneously ventilated and perfused lung, the values of ELV and Qp recovered from the IST are independent of the tracer gas period used. The IST accuracies of ELV and Qp values are published elsewhere (Bruce et al 2019, Crockett et al 2020). However, as the degree of heterogeneity increases, the ELV and Qp values (based on the assumption of perfect homogeneity) begin to diverge from true values; moreover, those values recovered from periods of 60 s and 180 s also diverge from each other. Consequently, the ratio of these latter values provides an index of the degree of heterogeneity. The IST ventilatory and perfusion heterogeneity ratio of the lung are given by the following expressions:


where  are the effective lung volumes measured by IST with tracer gas periods of 180 s or 60 s, and similarly for Qp
.
are the effective lung volumes measured by IST with tracer gas periods of 180 s or 60 s, and similarly for Qp
.
2.3. Lung heterogeneity simulation model
A heterogeneous lung was simulated by compartments, including three serial deadspace compartments (Harrison et al 2017), two alveolar compartments (tidal compartments) (Hahn and Farmery 2003, Whiteley et al 2003, Whiteley et al 2001) and five compartments to present the whole body (lung, viscera fast, viscera liver, lean and fat) (Baker and Farmery 2011). All compartments were linked together by conservation of mass equations. The significance of this simulation was as a suitable test for the IST and it also had clear settings in two tidal lung compartments to quantify lung heterogeneity. The simulated patient weighs 70 kg, with a lung volume of 2.5 l and pulmonary blood flow of 5.0 l min–1.
The volume fractions of the two tidal lung compartments were fixed at 0.1 and 0.9. Ventilation and perfusion fractions to the first lung compartment (0.1 fraction of volume) were changed to fv and fp . The ventilation and perfusion fractions to the second compartment (0.9 fraction of volume) were calculated by 1 − fv and 1 − fp .
Due to the model setting, the lung was homogeneous when fv 1 = 0.1 and fp 1 = 0.1. An increase in value of fv 1 caused the mismatch of the ventilation and higher lung ventilation heterogeneity. Similarly, when fp 1 increased, the lung perfusion heterogeneity also increased. A schematic diagram of the lung simulation is presented in figure 1. The full process of model development and the modelling parameters are described in Appendix A.

Figure 1. Panel (a) shows a schematic diagram of the two-compartment tidal lung simulation. The fraction of lung volume is set at 0.1 and 0.9. The ventilation heterogeneity is controlled by parameter fv 1 and the perfusion heterogeneity is fp 1. Panel (b) shows a flow diagram for the experiment on IST heterogeneity ratios using the lung simulation. Panel (c) shows the example of the IST-measured and simulated exhaled (FE ) signals in response to the 180 s period input tracer gas (FI ) at a PEEP of 10 cmH2O.
Download figure:
Standard image High-resolution image2.4. Ethical approval
This study adhered to the in vivo experiments (ARRIVE) guidelines (Kilkenny et al 2013). In the Hedenstierna Laboratory, Uppsala University, Sweden, 13 pigs were studied under the auspices of the regional animal welfare and ethics committee (ref. C98/16).
2.5. Lung injury
Lung injury replicated the ARDS conditions in the animal model. Lachmann' s method was applied to induce lung injury (Lachmann et al 1980). The ventilator was disconnected and 0.9% saline solution (at 37 °C) was instilled into the lungs via the endotracheal tube. The saline was drained out of the lungs after 30 s. The protocol was repeated until PaO2:FiO2 was less than 300 mmHg.
2.6. Statistical analysis
We used the Student's t-test to compare two parametric data groups and the Wilcoxon signed-rank test for non-parametric data. We then analysed the area under the receiver operating characteristic (ROC) curve (AuC) to show the degree or measure of separability between control and injured animals (Fawcett 2006). The linear regression and Bland–Altman plots were used to analyse the relationship between paired measurements from the IST versus the SF6 results (Bland and Altman 2007). Lung simulations were developed and validated in Matlab (MathWorks, USA; www.mathworks.com). Statistical tests were performed in Graphpad Prism v.8.1.2 (GraphPad Software, USA; www.graphpad.com).
3. Results
The ability to measure lung heterogeneity in the IST was assessed using the simulated heterogeneous lungs (figure 2). The difference between control and ARDS lungs in the IST ventilation and perfusion heterogeneity ratios was analysed by statistical tests (figure 4). Six of the 13 animals had measurements at PEEP 15 and 20 cmH2O. Additionally, a total of n = 72 paired VD measurements in 13 pigs at four different PEEP levels were analysed. Statistical analyses revealed that VDIST and VDSF6 was not different in both control and ARDS lungs.
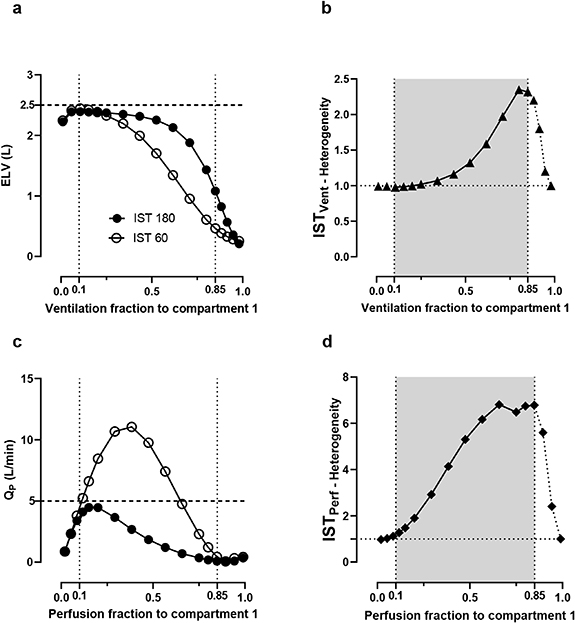
Figure 2. The divergences of the IST recovered values and IST heterogeneity indices in simulated heterogeneous lungs. Panels (a) and (b) show the IST values for different variations in ventilation heterogeneity and panels (c) and (d) show the changes in perfusion heterogeneity. The lung is assumed to be homogeneous when the ventilation fraction to compartment 1 (x-axis) is 0.1 (fv 1 = 0.1, the first vertical dotted lines). Each point on the x-axis presents one lung condition with the heterogeneity increased from 0 to 1. In panels (b) and (d), the simulation would break down beyond the grey regions.
Download figure:
Standard image High-resolution image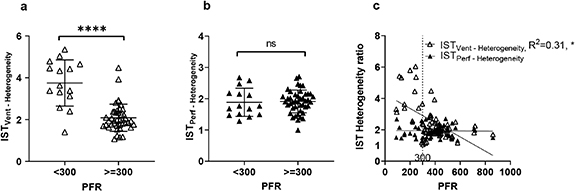
Figure 3. Validation of the IST heterogeneity ratios. Panels (a) and (b) show comparisons of IST heterogeneity indices with the PaO2:FiO2 ratio (PFR). A Student's t-test comparison of the IST heterogeneity indices between two groups (PFR  300 mmHg and PFR
  300 mmHg) was performed. Panel (c) shows the linear relationship between IST heterogeneity indices and PFR. ****
  ; ns, non-significant.
Download figure:
Standard image High-resolution image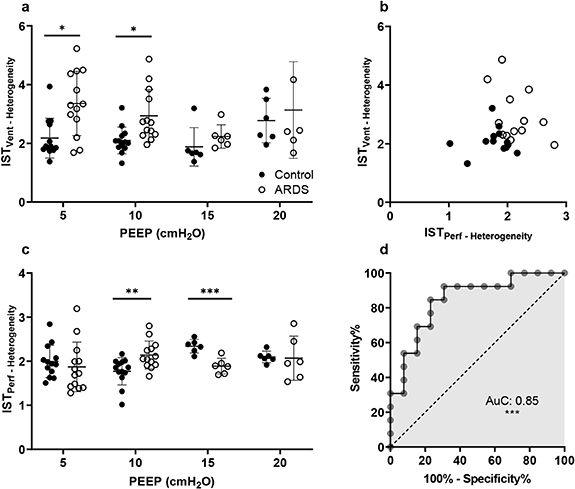
Figure 4. IST heterogeneity ratios in control and ARDS animals at different PEEP levels. Panel (a) shows IST ventilatory heterogeneity and panel (c) shows perfusion heterogeneity. A scatter plot in panel (b) shows the IST ventilation against perfusion heterogeneity indices at a PEEP of 10 cmH2O. Panel (d) is the receiver operating characteristic curve between ARDS and control at a PEEP level of 10 cmH2O (AuC, area under the curve). Student's t-tests were performed. ***  , **
, **  and *
and *  .
.
Download figure:
Standard image High-resolution image3.1. IST lung heterogeneity values in simulated data
Figure 2 shows the IST results in the simulated heterogeneous lungs. Theoretically, in a homogeneous or healthy lung the IST results do not depend on any sinewave period. As the heterogeneity value increases, the ELV and Qp values for the 60 s and 180 s sinewave periods start to diverge (figure 2(a)). Tracking the degree of divergence could provide the index of lung heterogeneity in panel (b).
When the ventilatory fraction assigned to compartment 1 (which comprises 10% of the lung volume) is 0.1 (fv
1 = 0.1), the lung is assumed to be entirely homogeneous. Thus, ELV values at both 60 s and 180 s were recorded at approximately 2.46 l (98% similar to the set value of 2.5 l) in figure 2(a). When fv
1 increased from 0.1 to 0.9, the heterogeneity of the lung was progressively increased. As a result, ELV values declined in both frequencies (panel a) and, moreover, the decrease in ELV at 60 s was greater than at 180 s. This divergence, represented as a ratio of  , is shown in panel (b).
Values outside the grey region (0.1–0.85) introduce more complexity to the model so were not included. When ventilation heterogeneity increases to such a level that 100% of ventilation is delivered to compartment 1, then ventilation would by definition return to being fully homogeneous, albeit very maldistributed (the lung just becomes a single, small compartment). Similar to the ventilation, when the perfusion fraction to compartment 1 is 0.1 (fp
1 = 0.1, perfect perfusion homogeneity), the ratio of these values predicts the degree of perfusion heterogeneity ( in panel (d)). A healthy lung should have heterogeneity ratios of about 1. The homogeneity of the lung will become worse the further away the ratios are from 1.
3.2. IST heterogeneity indices: a comparison between control and injured animals
Figure 3 shows the relationship between the IST heterogeneity indices and the PaO2:FiO2 ratio. This ratio is used clinically as a broad indicator of dysfunction of gas exchange (Rice et al
2007, Ferguson et al
2012). PaO2:FiO2
 300 mmHg indicates significant impairment of gas exchange (Rice et al
2007). Figures 3(a) and (b) compare the IST heterogeneity values between animals with PaO2:FiO2 <300 mmHg and >300 mmHg. The PEEP values used are not specifically controlled in this comparison. In panel (a) there is a significant difference in the IST ventilatory heterogeneity value between PFR
300 mmHg indicates significant impairment of gas exchange (Rice et al
2007). Figures 3(a) and (b) compare the IST heterogeneity values between animals with PaO2:FiO2 <300 mmHg and >300 mmHg. The PEEP values used are not specifically controlled in this comparison. In panel (a) there is a significant difference in the IST ventilatory heterogeneity value between PFR  300 mmHg and PFR ≥300 mmHg (mean value of 3.9 versus 2.1,
  ). Panel (c) shows a linear regression analysis of the IST heterogeneity ratios versus the PFR. There is a linear relationship of the PFR with the IST ventilation heterogeneity ratio (
 ) but not with the IST perfusion ratio.
The IST heterogeneity indices in control and injured groups at different levels of applied PEEP are shown in figures 4(a) and (c). At low PEEP levels (5 and 10 cmH2O) the mean heterogeneity indices in the injured lungs were higher than in controls (3.4 versus 2.2 at a PEEP of 5
cmH2O, and 2.9 versus 2.1 at a PEEP of 10 cmH2O,  for both). The injured group at low PEEP also shows a greater scatter of IST heterogeneity values. The application of PEEP from 5 through 15 cmH2O reduced mean heterogeneity within the injured group and also reduced data scatter, indicating a stabilizing effect of PEEP. In figure 4(c), the IST perfusion heterogeneity ratio shows significant differences at PEEP = 10 cmH2O (
 ) and 15 cmH2O (
 ). In panel (b), a clear scatter plot shows the significant difference between control and injured animals at PEEP = 10 cmH2O. Control animals have IST heterogeneity values of less than 2.1 and the values for the injured animals are higher.
Additionally, the ROC curve was used to classify control versus ARDS animals at a PEEP of 10 cmH2O. The AuC was 0.85 ( ) with a 95% confidence interval from 0.69 to 0.99.
3.3. Deadspace volume: a comparison of IST with SF6
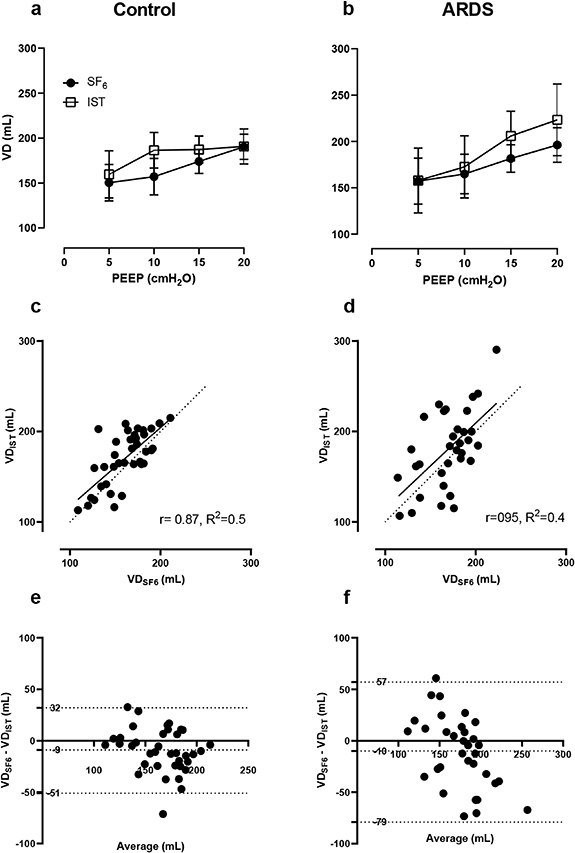
Figure 5 shows the relationship and correlation between VD measured by the IST and the SF6 test. In general, VD increased when the PEEP was raised, and the ARDS group had larger VDs than controls (panels (a) and (b)). SF6 measurements showed smaller variations than IST ones. There was a robust relationship between  and
and  : the linear regression slope was 0.87 with R2 = 0.5 in the control group (panel (c)). The volume bias was 9 ml (limits of agreement −79 to 57 ml) in controls and similarly 10 ml (limits of agreement −51 to 32 ml) in ARDS lungs (figures 5(e) and (f)).
Figure 5. Comparison of VD between the IST and the SF6 washout test. Panels (a) and (b) show paired VDIST and VDSF6 measurements in control (pre-injury) and ARDS lungs (post-injury). Panels (c) and (d) show linear regressions of absolute VD measured by the IST and SF6 test. The continuous lines are regression lines and dashed lines are the reference lines. Panels (e) and (f) show Bland–Altman plots: the bias lines are the central horizontal dotted lines and the top and bottom dotted lines are the limits of agreement.
Download figure:
Standard image High-resolution image
4. Discussion
This research shows the ability of the IST to measure lung heterogeneity and absolute VD in uninjured lungs and the ARDS model of lung injury compared with the 'gold standard' SF6 washout technique. The IST heterogeneity indices have the potential to identify ARDS from control subjects with reasonable diagnostic accuracy; the AuC being  at a PEEP of 10 cmH2O. Additionally, VD measured by the IST had a small bias (10 ml) compared with values measured by the SF6 technique.
A previous study of lung heterogeneity in human patients measured by the IST did not achieve any significant results because of the wide variability in the severity of conditions in the study population. Our research in animals, in which we were able to standardize and control the degree of lung injury more reliably, proved more insightful. Bruce et al showed that ventilation heterogeneity could be determined using the IST values in combination with plethysmography results (Bruce et al 2018). However, in this study, for the first time, we used only the IST to measure the heterogeneity of the lung without the need for plethysmography. We implemented a simulation model and used it to understand the IST heterogeneity indices and their boundaries. Healthy simulated lung should have an IST heterogeneity ratio of 1, although healthy human subjects would not quite achieve this.
The IST has shown potential strengths, including working as a bedside monitor and diagnostic tool. Firstly, it can be used with spontaneously ventilating subjects. In this research, mechanically ventilated animals were investigated. Further study in ventilated patients could improve development of the IST. The IST also can measure the size of a 'baby lung' (equivalent to a small well-ventilated compartment) and results compare well with SF6 and CT scan data in ventilated animals (Crockett et al 2020). We show that the heterogeneity of the lung changes with applied PEEP; this is of potential interest to the bedside clinician seeking to optimize ventilator settings. Secondly, at the appropriate ventilator setting significant differences between control and ARDS conditions were distinguishable (AuC = 0.85). The results of this study could pave the way for study of disease classification at the bedside using lung heterogeneity. Patients could benefit as a result of better-informed ventilation settings and the reduction of ventilator-induced lung injury (Nieman et al 2017, Brochard et al 2017).
In addition, this study reveals the ability of the IST to measure the absolute VD; it compares well with the SF6 wash-in–washout method. The correlation between the two methods had a slope of 0.87 (R2 = 0.5) and the limits of agreements were from −51 ml to 32 ml in control lungs. Clinically, deadspace volume has a strong association with mortality risk in patients with ARDS, wherein the risk of death increased by 22% for every 0.05 increase in VD:VT (Kallet et al 2017).
We implemented a lung simulation to show how lung heterogeneity can be captured by the IST. However, the simulation and our work contain limitations. A lung simulation with two alveolar compartments may not be enough to represent the complexity of real-life lung heterogeneity. In figure 2, the heterogeneity index is only valid between certain limits of ventilatory misdistribution (within the grey zone) Outside this region, the simulations break down as described above (in the results, section 3). Of note, whereas in the simulation perfect homogeneity gives a heterogeneity index of 1, healthy subjects do not achieve this value (it being closer to 2). This is not surprising given that even in healthy people ventilation is not perfectly uniformly distributed. A better simulation including the effects of hypoxic pulmonary vasoconstriction could be developed in the future (Whiteley et al 2003, Alford et al 2010). Furthermore, only six animals were studied at PEEP 15 and 20 cmH2O because, in two cases, the pigs were too unstable to tolerate such high levels of PEEP and these experiments were undertaken in parallel with the collection of data for other studies. Further research could explore IST heterogeneity indices at higher PEEP levels.
The IST is a potentially translatable research tool. This research examined the utility of the IST in measuring lung heterogeneity and VD in ventilated lungs at the bedside. Accurate measurement of VD could help in the prognostication of acute lung injury/ARDS. Furthermore, measurement of the heterogeneity of the lung might be used to quantify the extent of lung injury and inform ventilatory therapy. Our results support further development of these IST heterogeneity indices and their translation to classify lung diseases.
5. Conclusion
A quantitative method for measuring lung heterogeneity was introduced and explored in animal models. The IST ventilation and perfusion heterogeneity ratios have the potential to inform and optimize mechanical ventilation strategy at the bedside in real time. This work provides a fundamental foundation for the study of lung heterogeneity in clinical trials. The IST can also measure VD with small bias compared with the values measured by the SF6 technique. Further research is required to determine how the IST could be used to inform mechanical ventilation.
Acknowledgment
The authors are grateful for the important contribution from veterinary anaesthetists Christian Dancker and William McFadzean, and for the technical assistance by Hanne McPeak and Kristina Britchford.
Funding
This project was funded by the National Institute for Health Research, grant number II-LA-0214-20 005.
: Appendix A
The lung simulation consisted of three space compartments, two tidal lung compartments and five body compartments with a shunt block. In the two tidal lung compartments, the fraction of lung volume was fixed at 0.1 and 0.9. Parameters for the lung simulation are summarized in table A1. This lung simulation has been described and validated elsewhere (Tran et al 2020).
Table A1. Simulation parameters for the tidal lung simulation. fv is the ventilation fraction to the first lung compartment and fq is the perfusion fraction to the first compartment.
| Parameter | Value |
|---|---|
| Deadspace volume (VD) (ml) | 150 |
| Alveolar volume (l) | 2.5 |
| Pulmonary blood flow (l min–1) | 5 |
| Shunt (l min–1) | 0 |
| Tidal volume (l) | 0.5 |
| Ventilation fraction | [fv , 1 − fv ] |
| Alveolar volume fraction | [0.1, 0.9] |
| Perfusion fraction | [fq , 1 − fq ] |
| IST forced time period (s) | 180 s and 60 s |
| Respiration rate (breaths min–1) | 12 |
| Inspiration time (s) | 1.5 |
The ode45 solver and Simulink Matlab were chosen for simulation. Ten mixing compartments of deadspace are included in this model. The equation for each deadspace compartment during inspiration is

where i is the number of deadspace compartments (from 1 to 10) and  and
and  . VM,i
is the VD of compartment i and
. VM,i
is the VD of compartment i and  is the ventilation at time t. The equivalent equation during expiration is

where i is from 1 to 10 and  and
and  . FI
, FIA
and FE
are the fractional concentrations of the tracer gas coming into the deadspace compartment, coming out from the deadspace compartment to the lung compartment and exhaled from the deadspace to the environment, respectively.
. FI
, FIA
and FE
are the fractional concentrations of the tracer gas coming into the deadspace compartment, coming out from the deadspace compartment to the lung compartment and exhaled from the deadspace to the environment, respectively.
The deadspace compartments are serially connected with two parallel lung blocks. These lung blocks are generated from physiological equations of the tidal lung (Hahn and Farmery 2003) as follows. Inspiration:

Expiration:

where γ is the rate constant of expiratory flow, VA
(t) is the alveolar volume, VT
is the tidal volume and ti
is the inspiration starting time.  is end-expired alveolar volume. In the first compartment
  and in the second compartment fVolume = 0.9.
All the compartments are linked together by governing equations which represent the equilibrium of the mass concentration of the tracer gas.  and Ca
are the mixed venous and pulmonary end-capillary gas concentrations, respectively. In the first lung compartment inspiration is
and Ca
are the mixed venous and pulmonary end-capillary gas concentrations, respectively. In the first lung compartment inspiration is

and expiration

Each compartment has its own fraction of ventilation fv and fraction of perfusion fp (table A1). The body compartments of a standard human consist of five different tissues inside the human body with different tissue gas coefficients (Hahn et al 1993, Baker and Farmery 2011):

where  , Ci
and
, Ci
and  are the equivalent blood volume, concentration of the tracer gas and blood flow rate of i compartment. Vi
is given by the following equation, where V(b,i) and V(t,i) are the blood and tissue volumes of each body compartments and λ(t,i) is the Ostwald tissue gas coefficient of each compartment (these values are given in Farmery (2008)):
are the equivalent blood volume, concentration of the tracer gas and blood flow rate of i compartment. Vi
is given by the following equation, where V(b,i) and V(t,i) are the blood and tissue volumes of each body compartments and λ(t,i) is the Ostwald tissue gas coefficient of each compartment (these values are given in Farmery (2008)):

The Ostwald coefficient is the relation between the concentrations of the tracer gas in the blood to the fractional concentration in the lung. λ is the blood-gas partition coefficient. The body temperature is assumed to be constant (37°C), so the Ostwald coefficient is stable:

Since,  . The mixed arterial concentration
  is given below with
  being the shunt flow rate,
  the pulmonary blood flow rate and
  the total blood flow:
