

Abstract
Heart rate variability has been largely used for the assessment of cardiac autonomic activity, due to the direct relationship between cardiac rhythm and the activity of the sympathetic and parasympathetic nervous system. In recent years, another technique, pulse rate variability, has been used for assessing heart rate variability information from pulse wave signals, especially from photoplethysmography, a non-invasive, non-intrusive, optical technique that measures the blood volume in tissue. The relationship, however, between pulse rate variability and heart rate variability is not entirely understood, and the effects of cardiovascular changes in pulse rate variability have not been thoroughly elucidated. In this review, a comprehensive summary of the applications in which pulse rate variability has been used, with a special focus on cardiovascular health, and of the studies that have compared heart rate variability and pulse rate variability is presented. It was found that the relationship between heart rate variability and pulse rate variability is not entirely understood yet, and that pulse rate variability might be influenced not only due to technical aspects but also by physiological factors that might affect the measurements obtained from pulse-to-pulse time series extracted from pulse waves. Hence, pulse rate variability must not be considered as a valid surrogate of heart rate variability in all scenarios, and care must be taken when using pulse rate variability instead of heart rate variability. Specifically, the way pulse rate variability is affected by cardiovascular changes does not necessarily reflect the same information as heart rate variability, and might contain further valuable information. More research regarding the relationship between cardiovascular changes and pulse rate variability should be performed to evaluate if pulse rate variability might be useful for the assessment of not only cardiac autonomic activity but also for the analysis of mechanical and vascular autonomic responses to these changes.
Export citation and abstract BibTeX RIS
1. Introduction
Pulse rate variability (PRV), which refers to the changes in pulse rate (PR) over time, when measured from pulse waveforms (Constant et al 1999, Rauh et al 2003, Ahmad et al 2009, Gil et al 2010b, Jeyhani et al 2015, Holper et al 2016), has been widely employed in the last years as an alternative to heart rate variability (HRV) for the assessment of cardiac autonomic regulation (Huikuri et al 1999, Quintana 2017, Malik et al 2017). HRV, i.e. the variations of heart rate (HR) over time, is usually measured to evaluate the crosstalk between the parasympathetic and sympathetic branches of the cardiac autonomic nervous system (ANS), which control the firing rate of the sinus node in the heart, the main cardiac pacemaker in healthy subjects (Rangayyan 2002). HRV has been proposed as a potential marker of common cardiovascular conditions (Xhyheri et al 2012), such as hypertension, diabetes mellitus, myocardial infarction, and heart failure (Takase 2010), but has several limitations (Quintana 2017, Karmali et al 2017), plus it requires an electrocardiograph to obtain good quality ECG signals (Task Force of the European Society of Cardiology and The North American Society of Pacing and Electrophysiology 1996), which also hinder its applicability for long-term, daily-activity measurement.
Thanks to its simplicity and widespread use (Allen 2007), and in an attempt to obtain long-term measurements of the cardiac ANS, photoplethysmography (PPG) has been largely used for measuring PRV as a surrogate measurement of HRV. PPG is probably the most used signal in wearable devices nowadays. It is a simple, low-cost, non-invasive, optical measurement technique which serves for the detection of blood volume changes in peripheral tissues (Allen 2007). The amount of light absorbed, scattered, and reflected by tissue depends on the volume of blood circulating through vessels, which in turn presents a quasi-periodic behaviour marked by the heart rate (Wieben 1997). Therefore, a simple electronic device that obtains the reflected or transmitted light when this passes through tissue allows for the assessment of the pulse wave in the periphery. PPG has several applications, such as estimation of blood oxygenation, identification of pulse arrival time, and the measurement of PR (Allen 2007).
Since PR has been shown to serve as a good estimate of HR (Schäfer and Vagedes 2013), the estimation of HRV indices from PRV is being used indistinctly by several researchers, although the relationship between HRV and PRV is still not clear. Even if PR and HR can be used alternatively, they both refer to the mean value of the behaviour of heart rhythm during certain period of time, whereas PRV and HRV refer to the changes around this mean, and are not necessarily an estimate of each other (Constant et al 1999, Schäfer and Vagedes 2013). This issue has been investigated by several studies, but there is still no consensus. While some claim that PRV can be used as a surrogate of HRV (Bolanos et al 2006, Gil et al 2010aa, Vescio et al 2018), some other results indicate that HRV and PRV may not be the same, especially during non-stationary conditions or in unhealthy subjects (Constant et al 1999, Schäfer and Vagedes 2013, Rapalis et al 2018, Georgiou et al 2018). Nonetheless, due to the wide range of applications of HRV information, its relationship with several physiological and mental diseases and the easiness of pulse wave signals acquisition using PPG technology, PRV is being used for several purposes, and has received increased attention in recent years. The main aims of this review are, then, to perform a comprehensive review on PRV and its applications, with a special focus on application related to cardiovascular health, and to discuss comparative studies between HRV and PRV.
This review is organized as follows. In the next section, the methodology for obtaining, selecting and analysing the studies from the literature is explained. Then, a short description regarding how HRV is analysed, the indices that can be estimated from it, and how PRV is being examined nowadays, are given. Next, some results of studies comparing HRV and PRV are presented. Afterwards, the different applications of PRV found in the literature are described, with a special focus on the papers that have used PRV for assessing cardiovascular health. This is followed by a section in which technical aspects that need to be considered during pulse rate variability analysis are assessed. Finally, a general discussion of the findings of this review is presented.
2. Methods
The purpose of this review is to summarize the application of PRV information in understanding cardiovascular changes, and how its relationship with HRV has been studied. Articles used for this review were obtained from SCOPUS, EMBASE, and PubMed. In these databases, a search strategy was used to obtain the articles that included the following terms in their title, abstract or keywords: (('Pulse Rate Variability' OR 'PRV') OR ('Heart Rate Variability' OR 'HRV')) AND ('Photoplethysmography' OR 'PPG'). Reference lists from manuscripts were used to retrieve any additional original studies of interest, regardless of the techniques used to acquire the pulse wave signal. Only English- and Spanish-written papers were considered, and duplicates were removed, for a total number of 732 papers obtained.
After reading the abstracts, 402 papers were selected and classified into one of the following categories: Applications on anaesthesia and drugs, diseases, mental health, and sleep studies; PRV characteristics; PRV measurements from non-contact PPG; and comparison between PRV and HRV (PRV vs HRV).
Due to the special focus of this review on cardiovascular health, the most relevant papers related with this topic according to their methodology were selected and fully read. At the end, 63 papers were selected and were included in this review. Figure 1 illustrates the flow diagram followed for the selection of these papers. Although it is not the main focus of this paper, the most relevant manuscripts in the remaining categories were also read, and a broad summary of these applications is provided in the next sections.
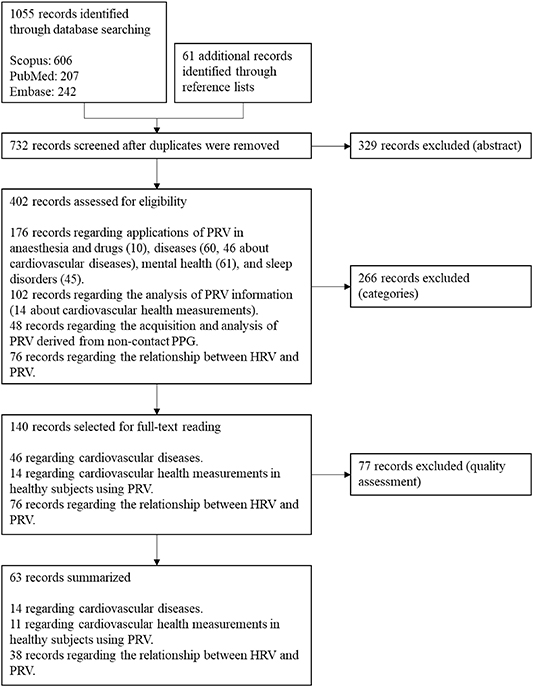
Figure 1. Flow diagram for the selection of the papers included in this review.
Download figure:
Standard image High-resolution image
3. Analysis of heart rate variability and pulse rate variability data
HRV extraction is performed from the electrical signal obtained from the heart, known as electrocardiography (ECG). This signal represents the performance of the electrical impulse that activates the different excitable tissues of the heart and thus is related with the cardiac cycle, displaying a quasi-periodic behaviour (Webster et al 2010). Different waves can be identified in a period of the ECG signal, each of which is related with a specific activity in the cardiac cycle. The most prominent of these waves is the R peak, which is part of the QRS complex and relates with the ventricular contraction (Rangayyan 2002). The morphology of the QRS complex and the R wave makes them ideal for delimiting each cardiac cycle, and thus measuring the time occurring between consecutive pulses. This time is also called the RR interval (RRI) and HRV information is obtained from the changes in RRI in time. From the RRI, several indices that describe the HRV can be obtained, both in time and frequency domains, and by applying non-linear techniques. Table 1 summarizes those that are usually measured in time and frequency domains (Task Force of the European Society of Cardiology and The North American Society of Pacing and Electrophysiology 1996). Non-linear analysis include Poincaré and attractor plots, singular value decomposition, Lyapunov exponents, and Kolmogorov entropy (Task Force of the European Society of Cardiology and The North American Society of Pacing and Electrophysiology 1996), as well as approximate entropy (Lu et al 2008, Bolea et al 2017), multiscale entropy (Parasnis et al 2015), and fractals (Mohan et al 2012).
Table 1. Time and frequency-domain HRV indices, as explained in Task Force of the European Society of Cardiology and The North American Society of Pacing and Electrophysiology (1996).
| Time-domain indices | |
|---|---|
| SDNN | Standard deviation of all NN intervals |
| RMSSD | RMS value of differences between adjacent NN intervals |
| SDSD | Standard deviation of differences between adjacent NN intervals |
| NN50 | Number of pairs of adjacent NN intervals differing by more than 50 ms |
| pNN50 | NN50 count divided by the total number of NN intervals |
| Frequency-domain indices (5-min recordings) | |
| 5-min total power (TP) | Variance of NN intervals over the temporal segment |
| VLF | Power in very low frequency range (≤0.04 Hz) |
| LF | Power in low frequency range (0.04–0.15 Hz) |
| LF normalized (nLF) | LF/(TP—VLF) x 100 |
| HF | Power in high frequency range (0.15–0.4 Hz) |
| HF normalized (nHF) | HF/(TP—VLF) x 100 |
| LF/HF | Ratio LF over HF |
| Frequency-domain indices (24-h recordings) | |
| Total power (TP) | Variance of all NN intervals |
| ULF | Power in ultra-low frequency range (≤0.003 Hz) |
| VLF | Power in very low frequency range (0.003–0.04 Hz) |
| LF | Power in low frequency range (0.04–0.15 Hz) |
| HF | Power in high frequency range (0.15–0.4 Hz) |
Similar to the ECG, photoplethysmography signals (PPG) are also related to the cardiac cycle. PPG is an optical, non-invasive technique employed to measure the blood volume in a tissue (Bergstrand et al 2009), and is used to detect volume changes in the microvascular bed of tissue using the light scattering properties in tissue (Allen 2007). When light penetrates tissue, different processes take place, including the absorption, reflection and transmission of light. The amount of light that travels through the tissue depends on the volume of blood that is circulating through it in that instant. Hence, the intensity of light allows for the detection of the cardiac cycle.
The PPG signal is a pulse wave with a smooth behaviour, and is the result of a mechanical wave resulting from the mechanical action of blood in the vessels (Sengthipphany et al 2015). Since it is related with the pulsatile arterial blood, by detecting fiducial points in the waveform, it is possible to measure the time between consecutive pulses, known as pulse-to-pulse interval (PPI). However, the smoothness of the signal makes it difficult to identify the fiducial points, and the waveform is highly affected mainly by artefacts related to movement (Allen 2007).
4. Relationship between pulse rate variability and heart rate variability
PRV has been proposed and used as if it were a valid surrogate of HRV, in order to obtain ANS-related information from pulse wave signals. Nonetheless, their relationship is not that straightforward, and many studies have aimed to clarify whether PRV could be used as a valid estimation of HRV in different scenarios. From the 38 papers selected from the literature revision, which discussed this association, 18 of them concluded that PRV was not a valid surrogate of HRV, for different reasons including physiological, postural, and environmental changes; as well as technical factors such as the presence of motion artefacts, the sampling rates used for acquiring PPG signals, and the identification of fiducial points (Constant et al 1999, Giardino et al 2002, Rauh et al 2003, Lu and Yang 2009, Charlot et al 2009, Khandoker et al 2011, Wong et al 2012, Schäfer and Vagedes 2013, Dehkordi et al 2013aa, Pellegrino et al 2014, Parasnis et al 2015, Chen et al 2015, Peng et al 2015, Shin 2016, Pinheiro et al 2016, Logier et al 2016, Rapalis et al 2018, Georgiou et al 2018).
4.1. PRV as a valid surrogate of HRV
In 2006, Bolanos et al presented one of the first studies in which PRV and HRV were concluded to be valid surrogates (Bolanos et al 2006). However, their study was performed with only two healthy, young, and resting subjects, which could affect the generalization of the results. Nonetheless, it has been used by many researchers for justifying the use of PRV instead of HRV. In line with their results, other studies have shown that PRV could be treated as a valid surrogate of HRV, at least on healthy, young subjects, and with the signals measured in supine position, and from different body sites such as the finger and the earlobe (Shi et al 2008, Selvaraj et al 2008, Lu et al 2009, Bulte et al 2011, Weinschenk et al 2016, Mohapatra et al 2018). Although the main conclusion in (Selvaraj et al 2008) was to recommend PRV as a valid surrogate for HRV, they also indicate that pulse transit time (PTT) could affect PRV and potentially introduce errors in the estimation of PRV parameters. Similarly, it was remarked in (Lu et al 2009) that it was not clear how the correlation between HRV and PRV will be affected by variable conditions. In a large study performed with more than 300 subjects, Weinschenck et al found that even if PRV and HRV could be considered good estimators of each other, the former systematically overestimates HRV, and the short-term changes, which are more dynamic, showed lower agreement than the long-term parameters (Weinschenk et al 2016).
Other researchers evaluated the feasibility of using PRV as an estimation of HRV with subjects in different positions. Lu et al concluded that PRV measured in upright position shows a good correlation and nonsignificant differences to HRV, although correlations were stronger with subjects in supine position (Lu et al 2008); Trajkovic et al derived time-domain indices from PRV obtained from forehead near-infrared spectroscopy (NIRS), and found that there was good agreement between HRV and PRV (Trajkovic et al 2011); Heathers found that the relationship between PRV and HRV was not affected by tasks such as reaction time and basic exercise, but found better accuracy in subjects at rest, and concluded that parameters such as HF power could be affected by changes in local vasculature (Heathers 2013); Pinheiro et al also stated that the agreement between HRV and PRV is high during resting conditions, but they found that, both in healthy subjects after exercising and in cardiovascular patients, this agreement was drastically affected (Pinheiro et al 2016); and Vescio et al found that PRV and HRV traces and Poincaré plots were very similar and comparable both in short- and long-term (24-h) recordings, although in their study interbeat intervals (IBI's) from PPG were manually synchronized to RR intervals from the ECG (Vescio et al 2018).
Authors have also aimed to prove if PRV and HRV could be used indistinctly in unhealthy subjects. Hence, their relationship has been evaluated in subjects suffering diseases such as type-2 diabetes mellitus (Keet et al 2014), obesity (Vasconcellos et al 2015), hypoglycaemia syndrome (Okkesim et al 2016), sleep apnoea (Liu et al 2017), and chronic myofascial pain syndrome (Ye et al 2018). In these cases, PRV was found to be a valid surrogate of HRV. In addition, Hernando et al evaluated the effects of hyperbaric environments in the relationship of these variables, and concluded that PRV appears to be comparable to HRV except for pressures of around 5 atm, probably due to the rise in peripheral vascular resistance that may occur in these environments (Hernando et al 2018).
It is important to note that these studies were all performed under controlled conditions, which limits the scope of PRV as a valid surrogate of HRV. Moreover, one of the main advantages of PPG over ECG for obtaining HRV-related information is the capability of the former to unintrusively monitor signals in daily-life activities. However, the studies that claim that PRV could be a good surrogate of HRV have been mostly performed under laboratory conditions and with healthy, resting subjects.
4.2. PRV is not a good estimator of HRV
In contrast to the previous studies, several researchers have concluded that PRV and HRV should not be used indistinctly, and that diverse factors could affect PRV in a different manner to HRV.
Some studies performed with healthy subjects under resting conditions have shown that the relationship between PRV and HRV should not be taken for granted. Lu and Yang concluded that, although PRV could substitute HRV in some cases, the noise present in PPG signals could highly affect the derivation of PRV parameters from this signal, and their comparability may not be generalizable to clinical populations (Lu and Yang 2009); Wong et al also found differences between HRV and PRV in healthy, resting subjects, and also reported that there are differences in PRV obtained from PPG signals measured from different body sites, indicating that right and left PRV differed even in healthy subjects (Wong et al 2012); and Logier et al concluded that HRV and PRV differed especially in short-term variability parameters, such as HF (Logier et al 2016).
Factors such as stress (Giardino et al 2002), respiratory patterns (Rauh et al 2003, Chen et al 2015, Jan et al 2019), exercise (Charlot et al 2009, Lin et al 2014), orthostatic changes (Charlot et al 2009, Lin et al 2014, Pernice et al 2018), and ambient temperature (Shin 2016), have been found to alter the relationship between HRV and PRV, even in healthy subjects. However, the reason of these differences has not been thoroughly elucidated and still needs further research. Noise in the PPG signal (Lu and Yang 2009), errors in the identification of fiducial points (Rauh et al 2003, Rapalis et al 2018), and physiological factors such as changes in blood pressure (Giardino et al 2002), haemodynamic changes (Charlot et al 2009) and changes in PTT (Chen et al 2015), have been proposed as the main sources of variation for PRV that do not affect HRV in the same way.
The effects of nonstationary conditions on the relationship between PRV and HRV was thoroughly studied by Gil et al (2010b). In their study, data was obtained from 17 volunteers positioned on a tilt table. At the beginning, the participants laid in supine position (4-min), and then the tilt table was set to an angle of 70° and data was obtained for 5 min; finally, 4 min signals during supine position were again obtained. Two analysis were performed. First, in a time-invariant analysis, parameters were obtained in three 2-min windows, each extracted from each stage of the protocol, and PRV and HRV series were aligned by removing PTT from PRV. Secondly, a smoothed pseudo Wigner-Ville distribution (SPWVD) was used to evaluate time-varying spectral properties of HRV and PRV signals, and to perform time-frequency (TF) coherence analysis (time-varying analysis). In this analysis, the temporal evolution of the power content of HRV and PRV within each frequency band was obtained. Finally, a simulation study was performed to evaluate if the differences between HRV and PRV could be only due to errors in the identification of fiducial points from the PPG.
It was found that classical time- and frequency-domain indices derived from PRV showed a similar behaviour to those derived from HRV, both in time-varying and time-invariant analysis, but a positive bias in the estimation of the power content from PRV was noticeable, which increased during tilt. Also, from the simulation study it was found that the simulated error in the identification of fiducial points did not introduce a bias in the actual error of the parameters. Hence, the authors concluded that HRV and PRV were not the same, and that the main reason for their difference was the variability in PTT.
Regarding the presence of disease, some authors have compared PRV and HRV to evaluate their relationship in patients presenting different pathological conditions. Khandoker et al found that PRV and HRV had important differences during obstructive sleep apnoea (OSA) events, probably due to respiratory-induced changes in blood pressure, PTT, and cardiac output (Khandoker et al 2011); Dehkordi et al also found differences in frequency-domain indices obtained from children with and without sleep disordered breathing (Dehkordi et al 2013aa); and Parasnis et al found that PRV does not serve as a surrogate of HRV when nonlinear measures such as multi-scale entropy is obtained from patients in the Intensive Care Unit (ICU) (Parasnis et al 2015).
Finally, two studies aimed to investigate the changes in PRV if HRV was blocked or controlled. In 1999, Constant et al hypothesized that pulse rate fluctuates independently of heart rate modulation (Constant et al 1999). To evaluate this hypothesis, they acquired ECG and PPG signals from 10 healthy children and 10 children with implanted pacemakers, set to a fixed heart rate, while the subjects were seated (5-min) and standing (5-min). As expected, HRV spectra was flat in paced subjects, while it showed variations in healthy children. However, PRV spectra in children with pacemakers was reduced but showed small fluctuations, which were synchronized with respiration, whereas healthy children had similar trends in their PRV spectra as that observed in HRV analysis. They concluded that PRV does not exactly reflect HRV, as a consequence of the effect of periodic fluctuations of pulse wave velocity.
More recently, Pellegrino et al aimed to validate PRV as a surrogate of HRV in chronically instrumented rabbits (Pellegrino et al 2014). They obtained ECG and invasively-acquired blood pressure signals from male New Zealand white rabbits, in different conditions: Baseline measurement (BM, 5-min); ventricular pacing to examine PRV when HRV was driven to zero (VP, 5-min); and cardiac autonomic blockade using atropine, metoprolol and both (CB, 5-min each). During BM, all time-domain indices showed a strong correlation as well as high agreement, while spectra were very similar at lower frequencies and differed more at higher frequencies. However, HRV was almost completely eliminated and PRV was attenuated, but remained non-negligible, during VP. Finally, during CB, PRV accurately reflected changes in time-domain measures, overestimated the changes in HF, and showed moderate to high agreement to HRV, in atropine and metoprolol blockade. Dual blockade, however, showed poor accuracy and precision for normalized measures and LF/HF, and nonlinear entropy measures differed considerably between PRV and HRV in all three cases of blockade. These results led the authors to conclude that invasively acquired PRV overestimates HRV in both time and frequency domains in resting rabbits, and although PRV can be highly affected by fiducial points identification, this variability is probably explained by variations in pre-ejection time or PTT.
5. Applications of pulse rate variability
Since the PPG signal is easier and more practical to acquire and more ubiquitous than the ECG, several researchers have used PRV instead of HRV in different applications (table 2). Special attention has been paid to the study of obstructive sleep apnoea (OSA), both in adults and in children, due to the difficulties in the instrumentation and experimental setup that needs to be applied during a PSG examination, which is the primary diagnostic tool of this disorder. It has been found that PRV indices can discriminate between apnoeic and non-apnoeic sleep, even achieving better performance than HRV data (Lázaro et al 2014).
Table 2. Applications of pulse rate variability found in the literature.
| Application | Examples |
|---|---|
| Detection, characterization | Progressive Supranuclear Palsy (Brefel-Courbon et al 2000). |
| and monitorization of somatic | Rehabilitation of spinal cord injured patients (Gal-on et al 2014). |
| diseases/changes | Drowsiness (Li and Chung 2013). |
| Multiple chemical sensitivity (Andersson et al 2016). | |
| Syncope (Kamiya et al 2005). | |
| Traumatic brain injury (Melinosky et al 2018). | |
| Identification of increased risk of hospital admission (Garde et al 2016b). | |
| Assessment of mental health | Estimation of stress levels (Can et al 2019, Cho et al 2017, Hao et al 2017, Jobbágy et al 2017, Zangróniz et al 2018). |
| Identification of emotions (Park et al 2012, Martínez-Rodrigo et al 2019, Choi et al 2017, Goshvarpour et al 2017). | |
| Estimation of the effectiveness of psychological interventions (Geary and Rosenthal 2011, Sakakibara et al 2013, Kekecs et al 2016). | |
| Assessment of posttraumatic stress disorder (PTSD) (Minassian et al 2014, Minassian et al 2015). | |
| Assessment of major depressive disorder (MDD) (Kobayashi et al 2017, Dagdanpurev et al 2018). | |
| Assessment of schizophrenia (Akar et al 2015). | |
| Assessment of psychosis (Clamor et al 2014). | |
| Pharmaceutical research | Effects of drugs and medication on the ANS (Arya et al 2002, Mueck-Weymann et al 2002, Sluyter et al 2016) |
| Sleep studies | Identification of sleep stages (Beattie et al 2017, Dehkordi et al 2014, Fonseca et al 2017). |
| Assessment of sleep-disordered breathing and obstructive sleep apnea (OSA) (Lazaro et al 2012, Dehkordi et al 2013bb, Garde et al 2014, Garde et al 2015, Garde et al 2016aa, Bozkurt et al 2019, Aksahin et al 2015, Dehkordi et al 2016, Garde et al 2017, Garde et al 2019). | |
| Analysis of the restorative function of sleep in postmenopausal women (Takahara et al 2008), college students (Sakakibara et al 2008), children having different chronic conditions (Krivec et al 2012), and subjects with OSA (Fujimoto et al 2018, Constantin et al 2008). | |
| Cardiovascular health | Assessment of type 1 and 2 diabetes mellitus (Nitzan et al 1998, Wu et al 2013, Monte Moreno et al 2017, Reddy et al 2017, World Health Organization 2011, Chon et al 2014). |
| Identification of hyper and hypotension (Jans et al 2015, Lan et al 2018). | |
| Detection of arrhythmias (Couderc et al 2015, Mcmanus et al 2016). | |
| Prediction of major adverse cardiac events (Muhadi et al 2016). | |
| Identification to changes due to smoking (Shi et al 2009). | |
| Assessment of Pulse Wave Velocity (Ahn and Kong 2011). | |
| Measurement of blood pressure (Fukushima et al 2013, Gaurav et al 2016, Radha et al 2019, Kei Fong et al 2019) |
Cardiovascular health has gained important attention in applications using PRV and HRV, and researchers have aimed to relate PRV data with several conditions.
Type 2 diabetes mellitus has been shown to be related with lower PRV values in all three analysis domains, i.e. time, frequency and non-linear indices (Nitzan et al 1998, Wu et al 2013), and with a lower correlation between right and left body sites, when diabetic patients where compared to healthy subjects (Nitzan et al 1998). Also, it was demonstrated that diabetic patients showed a decrease in Poincaré plot-derived indices after reactive hyperaemia, while healthy subjects did not have statistically significant differences induced by this stimulus (Wu et al 2013), implying that PRV could be used as a method to identify between diabetic and healthy subjects. Moreover, it was shown that PRV indices, alongside machine learning algorithms, could be used for classifying subjects as diabetics (Monte Moreno et al 2017, Reddy et al 2017), even achieving slightly lower sensitivity and specificity rates to those reported with the measurement of glycated haemoglobin, the gold-standard technique for type 2 diabetes screening (World Health Organization 2011). In the case of type 1 diabetes, it was observed that using non-linear indices from PRV it was possible to identify the onset of the disease in mice, with a good correlation with Western blot analysis (Chon et al 2014), illustrating the ability of PRV to track changes in cardiovascular health due to diseases. Interestingly, in most of these studies, the best results for classifying and identifying diabetes were obtained using non-linear indices, while time- and frequency-domain indices did not reflect the changes due to diabetes in a consistent manner.
Regarding the appearance of hyper- and hypotension, PRV has been shown to reflect these changes as well, and hence it has been suggested to be related with baroreflex control (Jans et al 2015). The appearance of hypertension was observed to be highly related to SDNN, which achieved relatively high accuracy rates in classifying hypertensive to normotensive subjects (Lan et al 2018). Hypotension was also related to PRV values, both when it was due to postural changes (Jans et al 2015) and when hypotension events occurred after spinal anaesthesia. In the latter case, non-linear indices from PRV, together with the changes in pulse transit time, were observed to have the better discriminatory capacity for identifying hypotensive events, even showing better results than HRV-derived indices (Bolea et al 2017). In both cases it was concluded that PRV could help identify hypotension events, although it is not clear whether it is because of impairments in the autonomic control during these events or due to changes in vascular behaviour.
In the case of abnormal cardiac rhythm, it has been found that PRV indices could be used as features in machine learning models, for detecting atrial fibrillation (AF) (Couderc et al 2015, Mcmanus et al 2016, Conroy et al 2017, Krivoshei et al 2017), premature atrial contractions, ventricular contraction (Mcmanus et al 2016). Although it was found by Couderc et al that ECG-derived HRV may have better discriminatory capacity when time-domain and Poincaré plot indices were used for detecting AF (Couderc et al 2015), PRV achieved good results when used for the identification of these abnormal-rhythm periods, especially when non-linear indices such as Shannon entropy were used. Whether an HRV-based system achieves better results than one based on PRV was not evaluated in any other study.
Finally, PRV was used to predict the appearance of major adverse cardiac event (MACE) in subjects admitted to the Intensive Care Unit after suffering from acute coronary syndrome (ACS) (Muhadi et al 2016). It was found that LF and LF/HF ratio presented a relatively good area under the ROC curve, which resulted in good negative predictive values (NPV) for these two parameters. However, positive predictive values were lower, probably due to the fact that MACEs only occurred in 18.7% of the studied subjects. These results led the researchers to conclude that PRV-derived LF and LF/HF ratio could serve as moderate predictors of the non-occurrence of MACE in ACD patients.
PRV has also been studied as a biomarker for detecting smokers (Shi et al 2009), and as a surrogate measure to variables such as pulse wave velocity (PWV) (Ahn and Kong 2011), for which SDNN measurements from PRV were found to be related to ankle-brachial pressure index (ABI), a measurement of PWV. Authors of this study concluded that PRV might be associated with diseases such as peripheral artery disease (PAD), although its applicability for the detection of atherosclerosis and arterial stiffness is still unknown (Ahn and Kong 2011).
Furthermore, PRV has been proposed as an indirect measurement to obtain blood pressure (BP) values or trends (Fukushima et al 2013, Gaurav et al 2016, Radha et al 2019, Kei Fong et al 2019). This has gained important attention, due to the importance of monitoring BP in a non-invasive, continuous manner. The results obtained by several studies show that BP can be estimated from PRV data with a relatively good accuracy, achieving correlations higher than 0.7 (Fukushima et al 2013) and errors as low as 3 mmHg, for the measurement of systolic and diastolic BP (Gaurav et al 2016, Radha et al 2019, Kei Fong et al 2019). It was even demonstrated that, using PRV information, the estimation of BP values was improved, compared to the estimation of these values when only PWV and heart rate data were obtained (Kei Fong et al 2019).
These results demonstrated the ability of PRV to reflect cardiovascular dynamics, and encourage for the development of novel applications that employ PRV for the assessment of cardiovascular health, although further research is needed regarding the origin of these changes in PRV information.
6. Technical considerations for pulse rate variability analysis
Technical aspects, such as the selection of the fiducial point for measuring the IBI's from the pulse wave signal, could also affect PRV. Focusing in this matter, some researchers have investigated how the relationship between PRV and HRV can be affected by the selection of the fiducial point (Chen et al 2013, Posada-Quintero et al 2013, Hemon and Phillips 2016, Alqaraawi et al 2016a, 2016bb). Posada-Quintero et al reported that using the intersection point between tangent lines from the onset and the maximum slope points in each cardiac cycle provided the most reliable PRV information, that could be compared to that obtained from HRV (Posada-Quintero et al 2013). This conclusion was also achieved by Hemon and Phillips, who also showed that the poorest correlation between HRV and PRV was achieved using the systolic peaks as fiducial points (Hemon and Phillips 2016). Pinheiro et al, however, concluded that the best estimation errors were obtained when the time instants corresponding to 50%, 80% and the maximum peak amplitude were used as fiducial points, although they also suggested that the best fiducial point to use depended on physiological conditions and analysis context (Pinheiro et al 2016). These differences have also led researchers to evaluate and propose techniques for the derivation of PRV data without detecting the cardiac cycles in the time-domain representation of the PPG signal (Hayano et al 2005, Chou et al 2014, Ricardo Ferro et al 2015), some of them with relatively good results.
Other aspects have been studied to understand how the relationship between PRV and HRV may be affected by them. These include the different pre-processing techniques applied for obtaining PRV measurements (Akar et al 2013) and the sampling rate used when acquiring the PPG signals (Choi and Shin 2017, Hejjel 2017, Baek et al 2017). Both aspects have been found to alter somehow the relationship between PRV and HRV, mainly due to the artefacts that may be produced due to a lower sampling rate, and to the assumptions that have to be done when applying certain spectral techniques.
Finally, there is a growing interest in searching novel methods and information that could be derived from PRV, and novel indices have been proposed for the analysis of PRV and for obtaining additional information from this data (Chang et al 2014, Chou et al 2017a, 2017bb). Also, and due to the increased use of non-contact physiological signals, a special interest has arisen for the measurement of PRV from non-contact, image-based PPG signals. Non-contact PPG signals can be obtained by applying image-processing techniques to images obtained from a subject's skin. The changes in blood volume can be detected by filtering and segmenting the image obtained from the camera while a light, such as the white flash light available in most Smartphone cameras, illuminates the body of a subject (Sun and Thakor 2016). One of the first attempts to obtain PRV data from non-contact, image PPG (iPPG) was presented in 2011 by Poh et al (2011), who used a low-cost webcam for obtaining PRV data applying an independent component analysis (ICA) strategy for the acquisition of PPG signals from images. Their results lead the authors to conclude that iPPG could be used to obtain PRV information. Since then, other studies have aimed to extract PRV information from video and image PPG, and to understand how frame rate could affect PRV (Sun et al 2012); which colour channels (e.g. RGB, CIE, CGO) could give more reliable PRV results (Mcduff et al 2014); how the camera used for obtaining the images could alter PRV results (Guede-Fernández et al 2015); how far could the camera be positioned from the skin (Blackford et al 2016); and the effects of different techniques for obtaining PPG information from the images on PRV information (Alghoul et al 2017, Rodríguez and Ramos-Castro 2018).
7. Discussion
HRV has been largely explored in the last 40 years due to its simplicity and non-invasive nature to evaluate changes in the cardiac ANS and related diseases (Xhyheri et al 2012). The rate at which the heart pumps blood to the circulatory system is determined by the sinus node in the heart, which is controlled by the sympathetic and parasympathetic branches of the ANS (Rangayyan 2002). Hence, changes in heart rate indirectly reflect the behaviour of the cardiac control exercised by this system. Its analysis has been used in the understanding and perhaps detection and diagnosis of various cardiovascular diseases amongst other pathophysiological phenomena. For example, HRV has been studied and used for the diagnosis and assessment of acute myocardial infarction (Task Force of the European Society of Cardiology and The North American Society of Pacing and Electrophysiology 1996, Takase 2010, Karmali et al 2017), diabetes (Takase 2010, Xhyheri et al 2012), hypertension (Takase 2010), and atherosclerosis (Xhyheri et al 2012), among others.
Some researchers have tried to implement HRV measurements using physiological signals different from the ECG. A commonly used alternative to ECG for the assessment of HRV is PPG, as a non-invasive, non-intrusive, simple and low-cost technique for the acquisition of pulse waves (Allen 2007). The HRV information derived from these pulse waves has been denoted as PRV, indicating that the information is not based on heart rate but on pulse rate changes over time.
7.1. Applications of pulse rate variability
As was mentioned above, PRV has been derived for the analysis of ANS changes under different conditions, such as the presence of mental or somatic diseases, during sleep, or for evaluating the effects of pharmacological drugs. Most of these studies were performed considering PRV as a valid surrogate of HRV derived from ECG signals, and some results were indeed similar to those obtained in comparable studies performed using HRV data. Moreover, some of them even improved the performance of classification systems when using PRV instead of HRV. For instance, Lázaro et al demonstrated that PRV showed a better performance than HRV in identifying decreases in amplitude fluctuations of the PPG signal (DAP) events, when trying to classify them as apnoeic- and non-apnoeic-related (Lazaro et al 2012, Lázaro et al 2014); and Khandoker et al found significant differences in PRV parameters between normal breathing and OSA events, showing that PRV might be used as an indicator of these events for screening, treatment or diagnoses purposes (Khandoker et al 2011). Although encouraging, almost none of the results presented on these studies included a comparison between HRV and PRV under the studied circumstances, and with the same subjects, yielding partially valuable results. Regarding cardiovascular health, PRV has been shown to contain information related to several cardiovascular disorders, such as diabetes and hypertension. However, the way PRV is affected by these changes has not been clearly explained, and several hypotheses have been raised.
Other interesting approaches have tried to derive PRV information, from contactless PPG, which is obtained, most of times, by employing video cameras located at smartphones. Although this method seems to be promising for the noncontact measurement of vital signs such as pulse rate or oxygen saturation, in both clinical and daily life scenarios, the validation of noncontact PRV as a surrogate of ECG-derived HRV still needs further studying. A critical factor in the measurement of video-based PPG, for instance, is the uneven and relatively low sampling rate provided by the video cameras. Even if strategies such as interpolation which has been proposed for solving the unevenly acquired frames, researchers have argued that using sampling rates as low as 20 Hz for acquiring PPG signals can yield valid PRV results (Choi and Shin 2017). Noncontact PRV has been less studied and compared to HRV, than PRV obtained from contact-based PRV. Moreover noncontact PRV requires heavy algorithms for its analysis (Alghoul et al 2017), precluding its application in long-term and real-time analysis of PRV so far.
7.2. Relationship between pulse rate and heart rate variability
PRV seems like a logic alternative to HRV since PPG signals carry a lot of valuable information regarding cardiovascular parameters, and is very easy to acquire in a long-term manner and in real-life scenarios. However, many factors may affect PPG and could probably alter PRV (table 3). One important aspect that has been studied is the effect of the fiducial point used for determining each cardiac cycle. This issue is not remarkable when discussing HRV: R peaks are easily identified in most ECG traces, and due to its magnitude, physical origin, and frequency content, they are ideal marks for segmenting cardiac cycles and deriving HRV data. PPG, on the other hand, is a smooth signal, with slow changes and relatively constant frequency content. Identifying the fiducial point of the pulse wave may present an interesting challenge and an important pitfall for PRV. As mentioned by Pinheiro et al, the best fiducial point to be used in the analysis of PRV depends on the physiological conditions of each subject and on the analysis to be performed, making it crucial to have an automatic algorithm to select which fiducial point to use in each case (Pinheiro et al 2016). It is worth mentioning that most of the studies evaluating differences between PRV parameters measured from several fiducial points found the lowest agreement between PRV and HRV when systolic peaks from PPG are detected and used for segmenting cardiac cycles. This is troublesome, since most of the available studies in the literature nowadays have analysed PRV obtained from these systolic peaks, as an analogy to the detection of R peaks for the analysis of HRV. As shown by Peng et al (2015a) and Hemon and Phillips (2016) systolic peaks are more sensitive to environmental changes, such as temperature, and to movement artefacts, and the algorithms to detect them may be less accurate, yielding less reliable PRV information. Future studies regarding PRV should aim to compare HRV and PRV using fiducial points different from the systolic peaks, especially when vascular changes and movement artefacts are to be considered.
Table 3. Factors that may generate differences between pulse rate variability and heart rate variability.
| Technical aspects | Physiological factors |
|---|---|
| Fiducial point detection. | Mechanical nature of the photoplethysmographic. |
| Wavelength used to obtain the photoplethysmographic signal. | Pulse transit time. |
| Sampling rate used for the acquisition of the photoplethysmographic signal. | Cardiovascular and autonomic diseases. |
| Processing techniques applied for the measurement of frequency-related information from pulse rate variability. | Vascular aging. |
| Movement artefacts that alter the photoplethysmographic signal. | Blood pressure changes. |
| Methodological aspects that limits the comparison of results obtained from different studies. | External forces on vessels. |
The way PPG signals are acquired and processed for measuring PRV is also important. PPG, being an optical technique, is based on the interaction between tissue and light (Allen 2007). The wavelength at which the tissue is illuminated affect the depth at which light penetrates, with larger wavelengths reaching deeper tissue (Ash et al 2017). It is still not clear if this could imply a difference in PRV measured from several wavelengths, although PRV has been measured indistinctly using red, infrared, green and even orange light. Another important aspect is the sampling frequency used for measuring PRV. As mentioned, Choi and Shin aimed to evaluate the effect of low sampling rates on the parameters derived from PRV (Choi and Shin 2017) and found no significant differences between PRV and HRV parameters at sampling rates as low as 20 Hz. However, as noted by Hejjel (2017), the results obtained during the study could have been influenced by the health status of the subjects and by the study design. Bulte et al (2011) found a diminished similarity between HRV and PRV when PPG sampling rate was lower. More research in this field should be performed to find the ideal sampling rate for PRV analysis. Processing of PPG and frequency domain analysis techniques could affect PRV results as well, as shown by Akar et al (2013), who found differences between PRV estimation when frequency spectra is calculated differently and when different detrending methods are applied. Hence, as happened with HRV, it is important to establish guidelines for standardizing PRV estimation, which would allow comparing results from similar studies without having to consider processing and acquisition differences, which may affect the conclusions reached.
As concluded by Schäfer and Vagedes in their review (Schäfer and Vagedes 2013), PRV is different from HRV not only due to errors in the fiducial points or due to the processing and acquisition methods applied, but also due to the nature of PPG and ECG signals and the physiological factors that affect each of these. PPG, being of a mechanical nature, can be affected by other factors different to those that affect HRV. The most renown differential factor is PTT, the time that the blood takes to travel from the heart to the peripheral site where the pulse wave is being measured (Sola I Caros 2011). As demonstrated by Constant et al (1999) and Gil et al (2010b), PTT has an important role in explaining the differences between HRV and PRV, especially in short-term parameters, such as HF and RMSSD. Therefore, the location of the sensor used for acquiring PPG could affect the relationship between PRV and HRV, and thus it is possible to hypothesize that PRV measured from different body sites may yield different information regarding the vascular path that the blood had to travel.
Moreover, the relationship between PRV and PTT allows for the arising of several conclusions regarding the relationship between PRV and cardiovascular health. Lu and Yang (2009) indicated that three factors (electromechanical coupling in the cardiomyocyte, pre-ejection period, and PTT) are subject to variations independent from heart rate and may be influenced by cardiovascular and ANS diseases, which could affect the relationship between HRV and PRV in diseased subjects. Gil et al (2010b) also pointed out the effects of aging and blood pressure on PRV, suggesting that differences between PRV and HRV could be also due to vascular aging. Trajkovic et al (2011) concluded that not only PTT may affect PRV, but also other factors such as external forces on the arterial vessels, pathologies, movement artefacts and methodological issues. Heathers (2013) indicated that PRV from different body locations could allow to differentiate local and systemic vasoconstrictive responses. Parasnis et al (2015), after evaluating non-linear parameters in cardiovascular patients both from HRV and PRV; concluded by raising a question: Could cardiovascular disorders be responsible for altering the behaviour of PRV differently to that of HRV? Shin (2016) concluded that differences between PRV and HRV were mainly due to physiological processes affecting vascular behaviour. And as Vasconcellos et al (2015) pointed out: there is not a profound explanation yet for the physiological or technical aspects that may affect the relationship between HRV and PPG-derived PRV, nor there is a clear hypothesis regarding the relationship between PRV and cardiovascular diseases, or the enhanced capability of PRV to detect cardiovascular changes over HRV.
8. Conclusion
PRV has been used largely as a validated surrogate of HRV. However, their relationship is still not clear, although in healthy, young and resting subjects, PRV could be used as an alternative to HRV. Its application in cardiovascular disease diagnosis and monitoring should be further evaluated, since previous studies indicate that cardiovascular factors such as blood pressure and aging may affect the parameters obtained from PRV.
It is important to remark the methodological issues that preclude a direct comparison between PRV studies. Some facts make it harder to have a strong conclusion regarding the relationship between PRV and HRV, as well as the capability of the former to yield more or different information than the latter. Small sample sizes, uneven gender and age distribution in most studies, different location of sensors and processing approaches, unclear estimation strategies for the different time- and frequency-domain and non-linear indices; and the lack of statistical validation, including agreement analysis in several studies, difficult the comparison between studies and the development of novel and reliable conclusions regarding the relationship between HRV and PRV, and the effects of cardiovascular and autonomic changes on PRV. This makes it even more urgent to establish techniques and methodological guidelines for PRV studies, such as those established for HRV, especially when PPG is becoming the most widely used technique for obtaining health information in real-life scenarios. From this review, it can be concluded that PRV research should focus first on understanding how physiological changes may alter the information extracted from the variation of interbeat intervals and its relationship with HRV, in order to better understand how cardiovascular changes may affect PRV features. Secondly, all PRV studies should be performed using robust methodologies, with large and heterogenous samples, valid statitical analyses, and clear technical guidelines for the analysis of data. And third, it is of great importance to evaluate the feasibility of PRV as a monitoring tool that could be applied in daily activities. Hence, the development of robust and reliable algorithms to detect the interbeat intervals from PPG and to extract PRV features is of paramount importance, and this could change the future of PRV applications.