

Abstract
Objective: Phase synchronization of arterial pressure (AP) and pulse interval (PI) oscillations in the low-frequency band (around 0.4 Hz in rats) is governed by baroreflex activity. In long-term stationary data recordings, such synchronization can be estimated by the coherence. The phase synchronization index (PSI) can be used as well. The aim of this study was to correlate PSI and the coherence of AP and PI under stationary conditions and to estimate the informativity of PSI as a measure of baroreflex activity during transient processes. Approach: AP and PI were recorded in conscious Wistar rats using femoral artery catheters. To study the hemodynamics during hemorrhage, blood was gradually withdrawn (20 ml × kg−1 over 30 min) through a catheter in the carotid artery. Main results: PSI and coherence spectra calculated from 30-minute AP and PI recordings demonstrated distinct peaks at the frequency of 0.4 Hz; these indicators correlate well with each other (Pearson r = 0.920, p < 0.0001). Both PSI and coherence were markedly suppressed by vagal blockade (methylatropine) and tended to reduce after sympathetic blockade (atenolol). Importantly, PSI demonstrated dynamic alterations during gradual hemorrhage. During the initial approx. 10 min of hemorrhage, AP did not change but PI was noticeably shortened, and PSI increased, which indicates the activation of the baroreflex. With further blood loss, baroreflex influences were not enough to prevent blood pressure from falling, and under such conditions PSI decreased. Significance: PSI, like coherence, is an informative measure of baroreflex activity under stationary conditions. In addition, PSI permits us to follow the coupling between the baroreflex oscillations of AP and PI during transient processes, which strengthens its informative value.
Export citation and abstract BibTeX RIS
1. Introduction
The analysis of hemodynamic variability is a powerful tool in the assessment of autonomic control of the heart and vasculature. Arterial baroreflex is an important mechanism of short-term cardiovascular control, therefore, oscillations that reflect the functioning of the arterial baroreflex have been addressed in many studies (Cerutti et al 1994, Malpas and Burgess 2000, Head et al 2001, Guasti et al 2010, Moertl et al 2013, Borovik et al 2014). Signals generated by baroreceptors modulate the influences of the autonomic nervous system on vascular tone, which results in compensatory change of arterial pressure (AP). Due to time delay in the control loop baroreflex activity results in the generation of self-sustained oscillations, Mayer waves (Julien 2006). The frequency of Mayer waves is ~0.1 Hz in humans and ~0.4 Hz in rats (Stauss 2007).
Along with influencing peripheral vascular resistance, baroreflex modulates cardiotropic sympathetic and vagal influences, therefore, the pulse interval (PI) or heart rate (HR) demonstrates oscillations of similar frequency which are coupled to the oscillations of AP. The strength of such coupling is determined by the baroreflex activity and can be evaluated with the use of cross-spectral analysis. An amplitude of the transfer function (gain) characterizes the amplitude coupling of two oscillators (AP and PI). A significant correlation between the spectral transfer gain and baroreceptor-HR reflex gain obtained from ramp changes in AP was observed in human and animal studies (Munakata et al 1994, Head et al 2001). However, a relatively high level of spectral transfer gain between AP and HR in the Mayer waves range was observed in the absence of baroreflex (after sinoaortic barodenervation), similar to baroreceptor intact animals (Head et al 2001). In addition, human studies showed that spectral transfer gain obtained by the traditional noncausal approach is affected by closed-loop interactions and generally provides overestimated values of AP and RR-interval coupling compared to the open-loop gain (Faes et al 2013a, 2004).
To estimate the phase coupling of blood pressure and PI in the cross-spectral analysis, coherence is used. Significantly lower coherence in the Mayer waves range was demonstrated in barodenervated rats compared to intact animals (Cerutti et al 1994, Head et al 2001). Desynchrony of AP and HR was also observed in the human case of baroreflex failure (Guasti et al 2010). These observations suggest that phase coupling of the oscillatory system is more sensitive to various challenges than its amplitude coupling (Pikovsky et al 2002) and poses the coherence as an informative measure of baroreflex control.
One more important issue in cardiovascular physiology and medicine is to characterize the dynamic alterations of control mechanisms during transition processes. Of note, calculation of coherence with the use of cross-spectral analysis requires rather long and stationary AP and PI time series. There is a need, therefore, to develop methods to evaluate the coupling of nonstationary hemodynamic signals. Wavelet transform coherence can be used to analyze the nonstationary and transient processes of the cardiovascular system. It is based on bivariate analysis that allows us to access dynamically the linear relationship between cardiovascular signals (Addison 2005, Keissar et al 2009). The phase synchronization index (PSI) can also be applied to this purpose. This approach allowed us to observe the strengthening of AP and HR phase synchronization in the frequency band of Mayer waves during episodes of orthostasis (Borovik et al 2014).
The aim of this work was to test the applicability of PSI for the evaluation of baroreflex regulation of cardiac rhythm in rats. The tasks of the study were (i) to compare the results of the estimation of AP and PI phase coupling with the use of PSI and coherence under stationary conditions; (ii) to compare the changes of PSI and coherence after cardiac sympathetic and parasympathetic blockade; (iii) to study the dynamics of AP and PI baroreflex oscillations synchrony during transition regulatory processes associated with gradual blood loss.
2. Methods
2.1. Animals
The study was conducted on three to four month old male Wistar rats obtained from the animal unit of the Institute for Biomedical Problems, Russian Academy of Sciences. All experimental procedures were approved by the Biomedical Ethics Committee of the Institute (protocol No 426).
2.2. Blood pressure recording
The rats were anesthetized with an intraperitoneal injection of Zoletil (12 µg × kg−1, Virbac Sante Animale) and Xylazine (12 µg × kg−1, Pharmamagis, Ltd, Hungary). Polyethylene catheters (PE10/PE50) were implanted into the left femoral artery and the right jugular vein. The catheters were tunneled subcutaneously and exteriorized at the dorsal neck region. After a recovery period of two days the rats were individually placed in cages (30 × 30 × 30 cm) in which they could move freely and had free access to water. The arterial catheter was connected to a BLPR2 pressure transducer (World Precision Instruments, USA). The arterial catheter was continuously flushed with heparinized (50 U × ml−1) saline (0.2 ml × h−1), to avoid clotting. The experimental room was kept quiet and dimly lit.
The recordings (30–60 min duration) were performed after 30–40 min acclimation period when cardiovascular parameters had stabilized. The blood pressure signal was amplified, digitized at 1000 Hz using an analog-to-digital converter (USB-6211, National Instruments, USA) and processed beat-to-beat to estimate mean arterial pressure (MAP) and PI values. Data acquisition and beat-to-beat processing were performed using an original software written in the LabVIEW programming language (National Instruments, USA).
2.3. Autonomic cardiac blockade
To suppress sympathetic and parasympathetic cardiotropic influences, β1-adrenoceptor antagonist atenolol and peripheral M-cholinoceptor antagonist methylatropine were used, respectively (1 mg × kg−1 for both, Sigma-Aldrich, USA). The blockers were injected after baseline recording through the venous catheter which was extended by 35 cm long PE10 tubing, so that the rat could not see the manipulations of the experimenter. Data sampling started 5 min after drug injection and lasted for 30–40 min.
2.4. Gradual hemorrhage
Baroreflex oscillations of MAP and PI during gradual decrease of blood volume were studied in rats instrumented with catheters in the left femoral artery and right carotid artery two days before the experiment. The femoral catheter was used for blood pressure recording similar to that described above, but the rats were restricted in water consumption. The carotid catheter was connected to a motorized syringe, to bleed the rats at a constant rate over 30 min. The withdrawn blood volume was 20 ml × kg−1 body weight (approx. 30% of total blood volume).
2.5. Spectral and cross-spectral analyses of MAP and PI time series
Spectral analysis was performed using an original LabVIEW-based software. Beat-to-beat data were displayed on screen for visual inspection, and artifacts due to obstruction of the arterial catheter or rat movements were eliminated. In order to find periods of relative stationarity during the recording, a running short-term standard deviation (SD) (30 points) was plotted for each variable, and by moving a threshold cursor, periods of continuously low SD could be separated from periods of high SD. Usually, 30–40 min of the total could be selected for further analysis.
Stationary beat-to-beat MAP and PI data were interpolated by cubic spline and resampled at 20.48 Hz. The resulting time series were divided into half-overlapping sequential sets of 100 s. Each set was subjected to linear trend removal and cosine tapering. The auto- and cross-power spectra were calculated for each segment using the fast Fourier transform and then subjected to ensemble averaging. To investigate to what extent fluctuations of MAP influence fluctuations of PI, the transfer gain between MAP and PI was calculated as the ratio between the modulus of the cross spectrum and the AP power. In addition, the phase shift between MAP and PI and the squared coherence function were calculated using the cross-power spectra.
In experiments with autonomic blockade, spectral power values were calculated in the low frequency (0.25–0.6 Hz) band as the area under the curve, whereas transfer gain and coherence were calculated by averaging all values in this frequency band.
2.6. Calculation of PSI
The calculations were performed using a specially developed program working under MATLAB (MathWorks Inc., USA). Using linear interpolation, beat-to-beat MAP and PI data were transformed into equidistant (Δt = 50 ms) values. Obtained time series were filtered using band-pass Butterworth filters with central frequencies (F0) in the range 0.01 to 2.5 Hz, the width of each filter was F0/2. To prevent phase shift, the procedure was performed twice—in the forward and reverse directions. Narrow-band signals received as a result of digital filtering were then presented in the form of analytic signal:

where  is the time series of filtered MAP and PI, respectively, and
  is their Hilbert transformants. For every frequency, the phase shift between filtered PI and MAP was then calculated:

and the histogram of Δφ distribution was constructed. To estimate the extent of phase synchronization at a given frequency we used the PSI proposed in Tass et al (1998):

where  is the Shannon entropy of Δφ distribution and
  , where N is the number of histogram bins (N = 40).
Using this algorithm, phase synchronization for every frequency in the range of interest were calculated; that is, PSI spectra were constructed.
2.7. Wavelet analysis
To study time dynamics of low-frequency MAP and PI oscillations wavelet analysis was used. The calculations were performed using MATLAB-based program. Using linear interpolation, beat-to-beat MAP and PI data were transformed into equidistant (Δt = 100 ms) time series. To study MAP and PI dynamics in both the frequency and time domain, discrete wavelet transformation was performed using a Symlet wavelet of order eight.
Intrinsic dynamics of MAP and PI were investigated in a band of baroreflex waves (f ~ 0.4 Hz), and a smoothed signal was obtained as well. The amplitudes of oscillations were calculated using an analytic signal approach according to equation (1).
In dynamics studies, amplitude values for the low-frequency oscillations, smoothed signals of MAP and PI, as well as PSI values, were averaged over sequential 120 s intervals with a time shift of 30 s.
2.8. Statistical data analysis
Statistical analysis was performed in GraphPad Prism 7.0. The normality of the data distribution was studied using the Shapiro–Wilk test. The data are given as mean and SD (if data distribution was normal) or as median and interquartile range (if data distribution was different from normal). The Wilcoxon matched-pair rank test was used to analyze the effects of cardiac autonomic blockade. Pearson correlation was used to estimate the statistical relationship between two studied parameters. Statistical significance was reached at P < 0.05; n represents the number of animals.
3. Results
3.1. The relationships between PSI and transfer function parameters under stationary conditions
The MAP and PI spectra, as well as cross-spectral transfer gain, coherence and phase angle between MAP and PI from 25 rats were averaged, as shown in figure 1. The power spectra of MAP (figure 1(a)) and PI (figure 1(c)) demonstrated sharp low-frequency peaks centered at 0.4 Hz, which corresponds to the frequency of Mayer waves in rats (Stauss 2007). Calculation of the coherence between MAP and PI showed a strong phase coupling of low-frequency MAP and PI oscillations (figure 1(d)) with an average phase of −0.22 ± 0.09π (figure 1(e)). The PSI spectrum was very similar to the spectrum of coherence, and it also demonstrated a prominent peak in the low-frequency band (figure 1(b)). However, transfer gain was prominent in the high-frequency band and smaller in the low-frequency band (figure 1(f)).

Figure 1. Power spectrum density of MAP (a) and PI (c), corresponding coherence (d), phase (e) and transfer gain (f) spectra as well as PSI spectrum (b) calculated from baseline recordings in conscious, freely moving rats. Data are given as mean ± SD, n = 25. The two vertical dotted lines indicate the low-frequency band (from 0.25 to 0.6 Hz).
Download figure:
Standard image High-resolution imageThe power spectra of PI and, especially, MAP did not contain distinct peaks at frequencies higher than 0.8 Hz, where oscillations of these parameters are synchronous with respiration (Rubini et al 1993). Along with that, transfer gain, coherence and PSI prominently increased in the high-frequency band, pointing to the coupling of MAP and PI oscillations associated with respiration. Respiration-related peaks in coherence and PSI spectra were rather broad, due to significant variability of respiration frequency in the rat (Kabir et al 2010, Nalivaiko et al 2011). Importantly, high-frequency peaks in coherence and PSI spectra did not overlap with the low-frequency peaks. This allowed us to assume that the phase synchronization of MAP and PI at the frequency of Mayer waves was not affected by respiration.
To compare two different methods of evaluating the coupling of MAP and PI low-frequency oscillations, we calculated mean values of transfer gain/coherence or PSI in the low-frequency band (0.25–0.6 Hz) and then plotted their relationships, as shown in figure 2. A rather weak correlation was observed between PSI and transfer gain (figure 2(a)). Along with that, a strong correlation was observed between PSI and squared coherence (figure 2(b)). In other words, the two indexes of MAP and PI synchronization correlated well with each other.

Figure 2. The relationships between PSI and MAP-PI transfer gain (a) or MAP-PI coherence (b) in the low-frequency (0.25–0.6 Hz) band. The values were calculated from baseline recordings in conscious, freely moving rats (n = 25). Pearson correlation coefficients, their 95% confidence intervals and correlation probability values are shown in the graphs.
Download figure:
Standard image High-resolution image3.2. Alterations of PSI and coherence under cardiac autonomic blockade
The effects of cardiac autonomic blockade of MAP and PI synchronization were studied in two experimental groups of ten rats. In the first group, sympathetic control of the heart was eliminated by atenolol. The second group received methylatropine, to suppress parasympathetic influences on the heart. Of note, no differences in baseline hemodynamic parameters and indexes of their variability were observed between the two experimental groups (table 1).
Table 1. The effects of autonomic blockade on MAP and PI, as well as their spectral powers, parameters of MAP-PI transfer function and MAP-PI PSI in the low-frequency (LF, 0.25–0.6 Hz) band.
| Parameters | Sympathetic blockade (n = 10) | P value | Parasympathetic blockade (n = 10) | P value | ||
|---|---|---|---|---|---|---|
| Baseline | Atenolol (1 mg × kg−1) | Baseline | Methylatropine (1 mg × kg−1) | |||
| MAP (mmHg) | 118.3 (115.2; 123.4) | 113.9 (106.6; 122.7) | 0.160 | 116.6 (111; 118.8) | 117.8 (114.7; 123.7) |
0.006 |
| PI (ms) | 163.8 (150.8; 170.8) | 182.6 (170.7; 187.5) |
0.004 | 158.6 (148.1; 166.9) | 125.6 (121.3; 125.6) |
<0.001 |
| MAP LF-power (mmHg2) | 5.02 (4.30; 7.30) | 4.22 (2.52; 11.17) | 0.625 | 4.66 (3.58; 6.37) | 5.38 (3.44; 7.18) | 0.492 |
| PI LF-power (ms2) | 2.19 (1.06; 4.09) | 0.75 (0.27; 1.97) |
0.014 | 2.28 (0.52; 2.91) | 0.02 (0.01; 0.04) |
0.002 |
| Transfer gain (ms × mmHg−1) | 0.54 (0.27; 0.62) | 0.20 (0.14; 0.53) |
0.027 | 0.55 (0.21; 0.63) | 0.03 (0.02; 0.04) |
0.002 |
| Coherence | 0.53 (0.33; 0.59) | 0.37 (0.22; 0.45) | 0.066 | 0.51 (0.39; 0.6) | 0.22 (0.16; 0.25) |
0.004 |
| PSI | 0.18 (0.09; 0.24) | 0.11 (0.06; 0.20) | 0.094 | 0.17 (0.10; 0.27) | 0.04 (0.03; 0.07) |
0.004 |
Data are given as median and interquartile range. ap < 0.05 versus respective baseline value (Wilcoxon matched-pairs signed rank test).
The obtained results are shown in figure 3 and table 1. Neither blocker affected MAP or MAP spectral power in the low-frequency band. PI was lengthened after sympathetic blockade but shortened after vagal blockade. Both blockers reduced PI spectral power and MAP-PI transfer gain in the low-frequency band, the effects of methylatropine were more pronounced compared to the effects of atenolol. Coherence and PSI were markedly diminished under the influence of methylatropine. Along with that, both indicators were moderately decreased by atenolol (p < 0.1). Of note, the centrum frequency of high-frequency peaks in PSI and coherence spectra was not affected by any of the blockers. This observation suggests no change in respiratory rate after autonomic blockade.
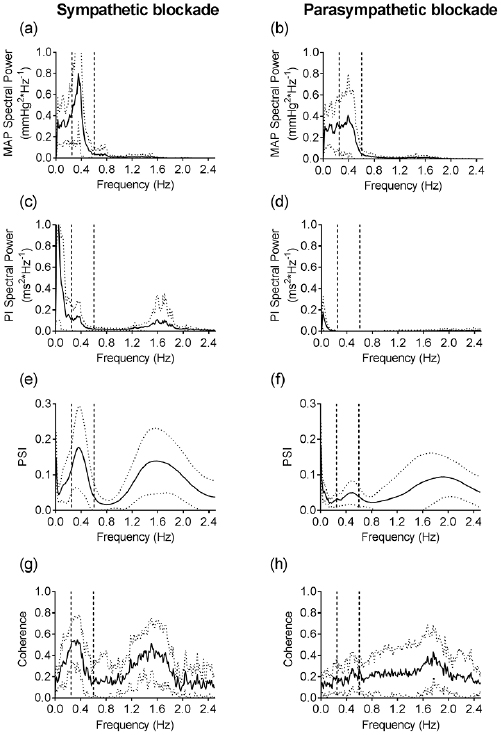
Figure 3. Power spectra of MAP (a) and (b), PI ((c) and (d)) as well as corresponding spectra of PSI ((e) and (f)) and coherence ((g) and (h)) obtained after administration of atenolol (1 mg × kg−1, left column of figures) and methylatropine (1 mg × kg−1, right column of figures) in conscious, freely moving rats. Data are given as mean ± SD, n = 10;10. The two vertical dotted lines indicate the low-frequency band (from 0.25 to 0.6 Hz).
Download figure:
Standard image High-resolution image3.3. The dynamics of PSI during transition processes
The next task in our study was to explore the dynamics of PSI of MAP and PI at the frequency of Mayer waves during long-term blood pressure recording in conscious rats. For this purpose, we calculated PSI spectra for short (120- second long) episodes and plotted them as a function of time (figure 4). During the 30 min period of baseline, the low-frequency peak was detected in all episodes, but its amplitude was not constant. This observation shows that the strength of phase coupling between MAP and PI may vary in time, probably because of changes in the behavioral activity of the rat.
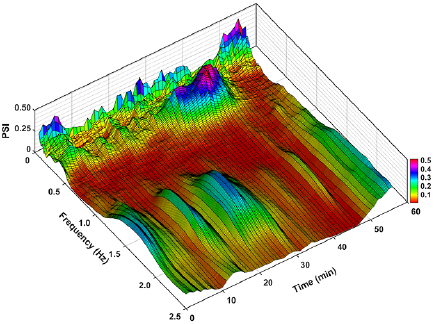
Figure 4. Evolution of PSI spectrum throughout 30 min of baseline recording (from 0 to 30 min) and subsequent gradual blood loss (from 30 to 60 min) in one of the experimental rats. PSI values were averaged over sequential 120 s intervals with a time shift of 30 s.
Download figure:
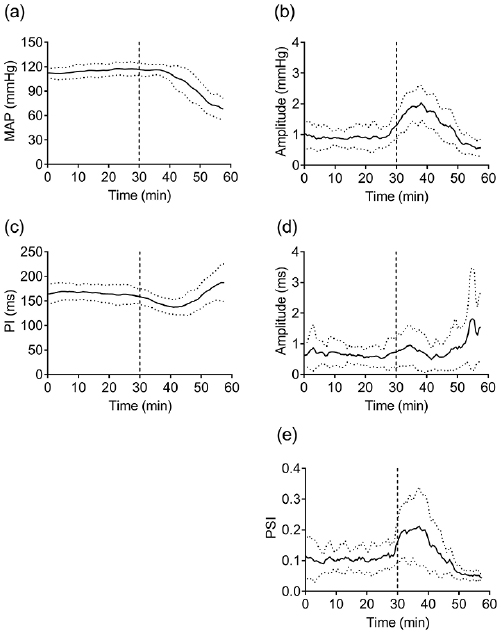
Standard image High-resolution imageTo correlate PSI dynamics with certain alterations in cardiovascular control, the rats were subjected to gradual blood loss (figures 4 and 5). During the approx. 10 min of blood loss, AP did not change (figure 5(a)) but PI was noticeably shortened (figure 5(c)). Wavelet analysis showed that the nonhypotensive phase of hemorrhage was marked by increased amplitudes of low-frequency MAP and PI oscillations (figures 5(b) and (d)), a prominent augmentation of PSI was observed as well (figures 4 and 5(e)). Further blood loss induced gradual hypotension and bradycardia (figures 5(a) and (c)); under such conditions amplitudes of low-frequency MAP and PI oscillations decreased (figures 5(b) and (d)). Phase synchrony of MAP and PI oscillations ceased, as was evident from the decrease in PSI (figures 4 and 5(e)). It should be noted that although the amplitude of the respiratory peak varied during the recording, its frequency did not change and was still higher than the frequency of Mayer waves (figure 4).
Figure 5. The effects of gradual hemorrhage (30% of total blood volume loss during 30 min) on MAP (a) and PI (c), amplitudes of their oscillations estimated by wavelet analysis ((b) and (d)) and MAP-PI PSI (e) in the low-frequency band (0.25–0.6 Hz). Data are given as mean ± SD, n = 12. The values were averaged over sequential 120 s intervals with a time shift of 30 s. The vertical line at 30 min indicates the beginning of hemorrhage.
Download figure:
Standard image High-resolution image
4. Discussion
Spectral and cross spectral analyses were used to characterize oscillations of MAP and PI under stationary conditions. We observed a prominent peak in the low-frequency band of the MAP spectrum (around the frequency of 0.4 Hz). According to results of this study and previous reports (Murphy et al 1991) these oscillations were resistant to cardiac autonomic blockade which pointed to their association with oscillations of sympathetic vasomotor activity and peripheral resistance patterned by the baroreflex mechanism (Julien 2006). Oscillations of the 0.4 Hz frequency were also observed in the PI spectrum. High coherence and negative phase value between MAP and PI oscillations in the low-frequency band strongly suggests their synchronization by the cardiac branch of baroreflex.
Further, we examined the phase synchronization of MAP and PI using the analytic signal approach. We calculated PSI (Tass et al 1998) and compared it with squared PI–MAP coherence, an established index of baroreflex activity (Munakata et al 1994, Head et al 2001, Guasti et al 2010). According to our results, PSI informatively describes the phase coupling of MAP and PI at the frequency of Mayer waves. First, the relationship between PSI and coherence was characterized by a Pearson coefficient of close to one. Second, PSI and coherence demonstrated similar behaviors in experiments with inhibition of autonomic control of heart rhythm. Both indices were prominently depressed by parasympathetic blockade. Therefore, phase coupling of low-frequency MAP and PI oscillations in rats is primarily due to parasympathetic heart control.
It is noteworthy that PSI has an undoubted advantage over coherence, due to its applicability to the evaluation of MAP and PI synchronization during transient processes. PSI allowed us to observe the variations in the synchrony continuously throughout gradual hemorrhage, when biphasic alterations of the baroreflex activity took place (Schadt and Ludbrook 1991, Evans et al 2001).
During the initial phase of hemorrhage, the fall in cardiac output is compensated by sympathetically induced increase in vascular resistance so that AP does not decrease; these compensatory changes are primarily mediated by arterial baroreceptors (Ludbrook and Ventura 1996). In this phase we observed strong augmentation of low-frequency MAP oscillations, in line with data in the literature (Malpas and Burgess 2000, Zöllei et al 2004, Vinogradova et al 2006, Porter et al 2009). The low-frequency PI oscillations and their synchrony with respective MAP oscillations were augmented as well, suggesting an activation of the cardiac baroreflex. Conversely, several studies using the sequence method demonstrated a decrease in spontaneous cardiac baroreflex sensitivity during moderate central hypovolemia, which contradicted the idea of compensatory hemodynamic shifts (Zöllei et al 2004, Silvani et al 2017, Yadav et al 2017). Therefore, we believe phase synchronization of MAP and PI described by PSI to be a better indicator of cardiac baroreflex activity during hemorrhage.
When blood volume has fallen by a critical amount, a decompensatory phase of hemorrhage develops (Schadt and Ludbrook 1991, Evans et al 2001). Its mechanisms include a withdrawal of sympathetic vasoconstrictor drive and vagal activation and therefore hypotension and bradycardia, similar to that observed in vasovagal syncope (Stewart 2012). Baroreflex failure in the decompensatory phase of hemorrhage was evident in our study from disrupted synchronization of the low-frequency MAP and PI oscillations. Our data are supported by similar desynchronization of these parameters in syncopal faint (Ocon et al 2011).
The limitation of PSI as a measure of baroreflex activity is that this indicator, along with the cross-spectral coherence function, cannot be used for directional analysis. AP and HR interactions occur in a closed loop, where the baroreflex influence represents just one arm—the feedback direction, i.e. from AP to HR. However, the contribution of a feedforward mechanism (from HR to AP, as a result of mechanical effects) was shown as well (Porta et al 2002, Nollo et al 2005). For a detailed study of the baroreflex interactions of AP and HR, it is necessary to apply methods that allow the separation of these two arms of the closed loop and separately consider feedback mechanisms. The PSI and coherence evaluate effects that are present on both arms of the AP-HR closed regulatory loop and using these methods it is not possible to separate the feedback baroreflex regulation of HR (Faes et al 2013b). For these purposes, other modified forms of analysis can be used, such as causal approaches (Porta and Faes 2016).
5. Conclusions
According to our results, the calculation of the PSI is an informative approach to the study of the coupling between AP and PI in the frequency band of Mayer waves. The analysis based on the extraction of narrow-band components from experimental time series by digital filtering and subsequent presentation of them in the form of analytic signals can bе used to estimate baroreflex activity along with cross-spectral coherence. In contrast to cross-spectral coherence, the calculation of PSI does not require the stationarity of the analyzed time series. Therefore, PSI spectra can be used to evaluate cardiac baroreflex control during transient processes. The procedure of the PSI spectrum calculation is more noise-resistant compared to the calculation of cross-spectral coherence and, therefore, can be used for the analysis of shorter time series. This property of the PSI spectral method could be an important advantage in practical applications of this approach.
Acknowledgments
The work was performed according to the Plan for Fundamental Research of SRC RF—Institute for Biomedical Problems RAS and was supported by grants from the Russian Foundation for Basic Research (N17-04-01943) and the Russian Science Foundation (N14-15-00704). The authors have confirmed that any identifiable participants in this study have given their consent for publication.