

Abstract
Objective: Plots of blood volume measurements over time (profiles) may identify euvolemia during fluid removal for acute heart failure. We assessed agreement between two noninvasive measurements of blood volume profiles during mechanical fluid removal, which exemplifies the interstitial fluid shifts that occur during diuretic-induced fluid removal. Approach: During hemodialysis we compared change in maximum diameter of the inferior vena cava by ultrasound ( ) to change in relative blood volume derived from capillary hemoglobin concentration from finger-clip spectrophotometry (RBVSpHb). We grouped profiles of these measurements into three distinct shapes using an unbiased, data-driven modeling technique. Methods: Fifty patients who were not in acute heart failure underwent a mean of five paired measurements while an average of 1.3 liters of fluid was removed over 2 h during single hemodialysis sessions.
  changed −1.0 mm (95% CI −1.9 to −0.2 mm) and the RBVSpHb changed −1.1% (95% CI −2.7 to +0.5%), but these changes were not correlated (r −0.04, 95% CI −0.32 to +0.24). Nor was there agreement between categorization of profiles of change in the two measurements (kappa −0.1, 95% CI −0.3 to +0.1). Significance:
  and RBVSpHb estimates of blood volume do not agree during mechanical fluid removal, likely because regional changes in blood flow and pressure modify IVC dimensions as well as changes total blood volume.
Export citation and abstract BibTeX RIS
Introduction
Long-standing questions (Shah and Stevenson 2004) about treatment targets for diuresis in acute heart failure remain unanswered (Katz 2014, Zalawadiya and Stevenson 2018). Composite treatment targets may be an improvement over simple dyspnea relief (Gheorghiade and Ruschitzka 2011), which often occurs after only a few diuretic doses (Mebazaa et al 2010). However, normalization of jugular venous pressure together with resolution of edema and orthopnea still result in high rates of re-hospitalization and mortality (Ambrosy et al 2013), even when substantive reductions of assays of natriuretic peptides are included as components of the composite target (Stienen et al 2018).
Lessons from mechanical fluid removal may help. Online sensors in the extracorporeal circuit of a hemodialysis or ultrafiltration machine continuously monitor concentrations of blood cells or proteins as fluid is removed (Costanzo et al 2017). Whether and how quickly hemoconcentration of these blood constituents occurs depends largely on the fluid status of the interstitium, which serves to replenish a diminishing blood volume (Koomans et al 1984). Whereas a 'wet' interstitium forestalls hemoconcentration by rapidly refilling the blood compartment, a 'dry' interstitium refills the blood compartment slowly, allowing earlier and more prolonged hemoconcentration. These principles of hemoconentration have been used for decades to target ultrafiltration treatments in real time to specific profiles (plots of measurements over time) (Santoro et al 1998). In particular, a profile of an accelerating rate of hemoconcentration during a constant rate of fluid removal provides an accurate signal that interstitial fluid is no longer able to replenish the blood compartment, and ultrafiltration should thus be slowed or stopped (Agarwal et al 2008).
In contrast to mechanical fluid removal, diuretic fluid removal has not been targeted to profiles of hemoconcentration, even though the idea was proposed over a decade ago (Boyle and Sobotka 2006). The limiting factor is that frequent measurements are needed to monitor precisely how quickly interstitial fluid refills the blood compartment after each diuretic dose—so that treatment may be adjusted to achieve a particular profile of hemoconcentration across serial doses. Without an extracorporeal circuit, such high-frequency measurements are not feasible. Infrequent measurements of hemoconcentration from laboratory hematocrits obtained as part of routine clinical care have provided valuable retrospective prognostication (Testani et al 2010), but they are too infrequent to capture blood volume profiles with each diuretic dose so that changes in those profiles can be tracked over repeated subsequent doses.
We aimed to explore whether spectrophotometry of capillary hemoglobin concentration from a finger-clip sensor could be used to measure relative blood volume changes continuously. We assessed agreement with point-of-care ultrasound of the inferior vena cava (IVC), because it is readily available and has been used to track blood volume change during hemodialysis (Katzarski et al 1997). Although neither measurement requires an extracorporeal circuit, we used hemodialysis as our experimental model, because it exemplifies the interstitial fluid shifts that occur during diuretic-induced fluid removal (Marenzi et al 2001); it also affords an exact and instantaneous measurement of the amount of fluid removed.
Materials and methods
Setting and participants
Approval for this study was obtained from the Institutional Review Board for Dartmouth College and Dartmouth Hitchcock Medical Center. We conducted an observational, cross-sectional study during 6 months in 2015 in two separate locations in Lebanon, New Hampshire: the inpatient unit at Dartmouth-Hitchcock Medical Center and the outpatient unit of Fresenius Kidney Care. Study investigators identified a convenience sample of spontaneously breathing adult patients who could comfortably recline. All patients had end-stage renal disease and required thrice-weekly hemodialysis. After written informed consent was obtained, investigators attempted an IVC ultrasound; participants with severe discomfort from the ultrasound probe, participants with severe ascites, and participants in whom the IVC could not be visualized were excluded.
Serial IVC ultrasounds and spectrophotometry of capillary hemoglobin concentration measurements were acquired during a single 4 h hemodialysis session. Hemodialysis protocols were not altered by participation, and standard bicarbonate dialysate and high-flux semisynthetic membranes were used. The initial ultrafiltration rate was set as the pre-dialysis weight minus the established target (or 'dry') weight divided by the planned duration (usually 4 h). If the target weight had not been established or was not known, the difference between the pre-dialysis weight and the antecedent post-dialysis weight (the interdialytic fluid gain) was used. Ultrafiltration rates were often adjusted to accommodate acute illnesses or when symptoms or signs arose during treatment that were attributable to fluid removal, such as nausea, cramping, or hypotension. The hemodialysis machines continuously measured the volume of fluid removed (ultrafiltration volume), which was compared against measures of blood volume change that were our research focus: maximum diameter of the inferior vena cava by ultrasound ( ) and change in relative blood volume by capillary hemoglobin concentration from finger-clip spectrophotometry (RBVSpHb).
Ultrasonography of IVC diameter
One study investigator acquired all IVC ultrasounds using the same M-Turbo™ ultrasound (Fujifilm Sonosite, Inc., Bothwell, Washington) equipped with a 1 to 5 MHz phased-array transducer. This investigator was a research coordinator whose central vein ultrasound acquisition skills had been verified (Lucas et al 2017). The investigator asked each participant to limit his or her movements and ensured that gurneys or chairs were kept at the same incline unless otherwise requested by dialysis staff. While each participant breathed regularly, the investigator acquired 10 s gray-scale (B-mode) video sequences along the longitudinal axis of the IVC from the subcostal window.
Ultrasounds were randomly arranged and interpreted by a second study investigator, who was blinded to both participant information and the order in which ultrasounds were acquired. The second investigator, a board-certified general internist who regularly used central vein point-of-care ultrasound since completing a training program 10 years ago (Lucas et al 2009), measured the IVC luminal diameters 1–2 cm distal from the hepatic vein inlet or, equivalently, 3–4 cm distal from the junction of the right atrium; this site was chosen because it is more compliant and, therefore, responsive to blood volume changes than more proximal sites (Wallace et al 2010). Although more than a half-dozen types of static and dynamic measurements of the IVC have been proposed, we focused on the maximum diameter because of simplicity (Moreno et al 1984), accuracy (Brennan et al 2007), and reliability (Fields et al 2011). To help gauge each participant's baseline status, we calculated a baseline IVC collapsibility index as the difference between the maximum and minimum IVC diameters (corresponding to end-expiration and end-inspiration, respectively) divided by the maximum diameter (Rudski et al 2010).
Spectrophotometry of capillary hemoglobin
Spectrophotometry of capillary hemoglobin concentrations (SpHb) were obtained with the Radical-7 Pulse CO-Oximeter equipped with Rainbow® R1-25L disposable adhesive sensors (Masimo Corporation, Irvine, CA). The Radical-7 continuously displays the perfusion index, which is the ratio of pulsatile to non-pulsatile blood flow. A perfusion index of 1.0 or lower indicates low pulse strength and signal quality. Low readings prompted investigators to ensure that the sensor was attached properly and that the site of the sensor was warmed by placing it under a blanket. If a low perfusion index persisted, the sensor was moved to a better perfused site (a different finger). Sensors always remained contralateral to arteriovenous fistulas, however, to avoid possible interference (Lin et al 1997). Because sphygmomanometers were also placed contralateral to fistulas as part of routine protocol, and because sphygmomanometers reduce pulse strength when inflated, the perfusion index was unavoidably low during blood pressure readings in patients with arteriovenous fistulas. Nevertheless, such measurements comprised less than 5% of SpHb readings and were easily discarded along with other SpHb measurements obtained when the perfusion index was low.
Agreement assessment
Measurements began with the first interpretable ultrasound acquired no sooner than 15 min after the start of hemodialysis. This 15 min delay ensured that the baseline SpHb measurements were not affected by the 250 cc of 0.9% sodium chloride solution that was used to prime the extracorporeal dialysis circuit. Subsequent ultrasounds were acquired every 15 to 30 min. This flexibility in timing was required to prevent interference with routine clinical care. The last ultrasound was acquired 2 h after the first; over this duration we anticipated an average drop in blood volume of 5%, given typical ultrafiltration rates (Santoro et al 1998, Krepel et al 2000).
The median SpHb from each 15 min interval was converted to RBVSpHb by the following formula (Dasselaar et al 2005):

This formula illustrates that RBVSpHb is the inverse of the relative change in SpHb: as hemoconcentration occurs, SpHb increases while RBVSpHb decreases.
We refer to patterns of rising and falling measurements of  and RBVSpHb over time as profiles. Separate previous reports found that profiles of both measurement types had three distinct shapes that reflected different fluid states at the start of hemodialysis (Lopot et al 1996, Katzarski et al 1997). Those with the least fluid overload (the most 'dry') had decelerating negative profiles. The profiles were negative because the rate of fluid removal by ultrafiltration outpaced the rate of refill from the interstitium; and they were decelerating because initially steep negative slopes flattened as ultrafiltration was reduced to avoid hypotension (Mitra et al 2002). Those with intermediate fluid overload had flat profiles because refill from the interstitium matched fluid removal by ultrafiltration and blood volume remained unchanged (Sinha et al 2010). Those with the most fluid overload (the most 'wet') had decelerating positive profiles (Agarwal and Weir 2010). The profiles were positive because fluid shifted from the interstitium upon reclining faster than it was removed by ultrafiltration; and they were decelerating because initially steep positive slopes flattened as this gravitational fluid shift later reached equilibrium (Hinghofer-Szalkay and Moser 1986). We anticipated that our participants would segregate into these three profiles for each type of measurement (
 and RBVSpHb), and we tested the hypothesis that within each participant, the shape of the measurement profile based on
  would match the shape of the profile based on RBVSpHb.
Statistical methods
We based our sample size calculation on the kappa statistic under the assumption that decelerating positive profiles would be half as common as the flat and decelerating negative profiles (Tchernodrinski et al 2015). In order to detect an increase of 20% above chance agreement between  and RBVSpHb profiles with a power of 80% and a two-sided type 1 error of 5%, we estimated a target sample size of 50 participants (Hong et al 2014).
We used group-based trajectory modeling to group participants by their profile for each measurement type (Nagin 2005). This statistical technique defines subpopulations by the profiles that emerge from serial measurements, rather than by preconceived notions of how those groupings are defined. It is most useful when different profiles are hypothesized a priori (as in this case based on fluid status), but grouping variables that define the relevant subpopulations are unknown. To formally test whether three distinct profiles emerged as the most parsimonious description of our data, and whether these profiles were curvilinear in shape (as suggested by previous reports (Mitra et al 2002)), we compared group-based trajectory models using the Bayesian information criterion (Raftery 1995). Average profiles for all participants and for groupings based on profile shapes were depicted as quadratic functions with random trend mixed-effects regression models (Hedeker and Gibbons 2006).
To compare characteristics across profile groupings, we used tests for trend that do not assume linear relationships. For parametric data, we used a joint test of unbalanced, non-orthogonal contrasts from adjacent-level means generated by one-way analysis of variance (Davis 2010), and for nonparametric data, we used an extension of the Wilcoxon rank-sum test developed by Cuzick (1985).
To describe the strength of the linear associations between change in  and change in RBVSpHb, we used Pearson's correlation coefficient. Kappa statistics were unweighted with confidence intervals that were bias-corrected with a bootstrap method using 1000 replications (Reichenheim 2004). All analyses were conducted with Stata, version 15.1 (StataCorp, College Station, TX), including group-based trajectory modeling, which was carried out with the traj (Jones and Nagin 2013) command from within Stata.
Results
Participants
Seventy-three participants were enrolled, but 23 (32%) were excluded, as detailed in figure 1. Major reasons for exclusion were that IVC ultrasounds could not be acquired or interpreted, or SpHb measurements could not be interpreted due to persistently poor signal quality. The characteristics of the remaining 50 participants who were included in the agreement assessment are listed in table 1. Participants were predominantly Caucasian (96%), overweight (mean BMI 27 m kg−2), and on renal replacement therapy for over a year (median 15 months). Among 31 (62%) participants with available echocardiographic data, moderate or severe tricuspid regurgitation was present in a third, and the left-ventricle ejection fraction was preserved on average (mean 58%).
Table 1. Participant characteristics.
| Characteristic | N = 50 |
|---|---|
| Age, mean (SD), y | 64 (17) |
| Women, no. (%) | 21 (42) |
| Caucasian, no. (%) | 48 (96) |
| Body mass index, mean (SD), m kg−2 | 27 (4) |
| Duration of renal replacement therapy, median (IQR), mo | 15 (3–30) |
| Serum albumin, mean (SD), g dl−1 | 3.7 (0.6) |
| Hemoglobin, mean (SD), g dl−1 | 9.9 (1.5) |
| Total protein, mean (SD), gm dl−1 | 6.5 (1.0) |
| Catheter was used for dialysis, no. (%) | 25 (51) |
| Currently hospitalized, no. (%) | 25 (50) |
| Dialyzed on Monday or Tuesday, no. (%) |
18 (36) |
| Pre-dialysis weight minus dry weight, mean (SD), kg | 2.6 (3.3) |
| Post-dialysis weight minus dry weight, mean (SD), kg | 0.3 (2.6) |
| Routine transthoracic echocardiography | |
| Left ventricle ejection fraction, mean (SD), % | 58 (16) |
| Moderate or severe tricuspid regurgitation, no. (%) | 10 (32) |
| Pulmonary artery systolic pressure, mean (SD), mm Hg | 43 (15) |
| Baseline IVC, mean (SD) | |
| Maximum diameter, mm | 15.1 (5.2) |
| Collapsibility index | 0.49 (0.26) |
| Ultrafiltration received before start of agreement assessment | |
| Duration, mean (SD), min | 45 (16) |
| Net rate, mean (SD), cc min−1 | 5.9 (6.3) |
Abbreviations: SD, standard deviation; IQR, interquartile range. aData were missing for duration of renal replacement therapy (n = 2), serum albumin (n = 2), total protein (n = 13), dialysis catheter use (n = 1), weights calculated from dry weights (n = 25), left ventricle ejection fraction (n = 19), moderate or severe tricuspid regurgitation (n = 19), and pulmonary artery systolic pressure (n = 27). bBaseline mean (SD) hemoglobin by SpHb measurement was 10.1 (1.2) g dl−1. cRemaining participants were dialyzed on Wednesday or Thursday (n = 16) and Friday or Saturday (n = 16).
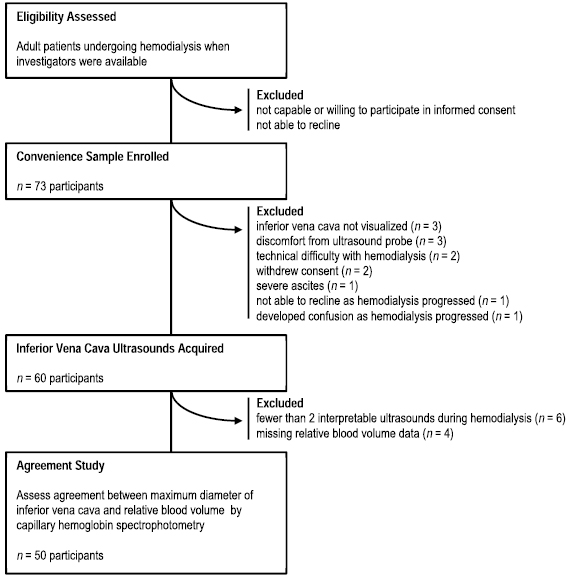
Figure 1. Patient flow during 6 month study period.
Download figure:
Standard image High-resolution imageOverall there was a total of 242 paired  and RBVSpHb measurements; within each participant there was a mean of five paired measurements (range 2–7 measurements). As depicted in figure 2, individual trends in
  and RBVSpHb were highly variable so that the average trends among all participants were relatively flat. After a mean of 1.3 liters was removed by ultrafiltration, the average
  decreased by only −1.0 mm (95% CI −1.9 to −0.2 mm) while the decrease in RBVSpHb was not statistically different than zero (−1.1%, 95% CI −2.7 to +0.5%). There was no linear association between IVCUS change or RBVSpHb change, either for the entire 2 h (r = −0.04, 95% CI −0.32 to +0.24) or when each hour was considered separately (figure 3).
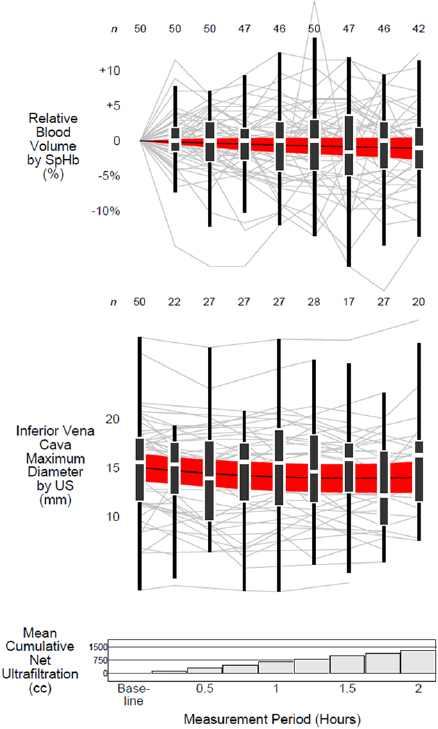
Figure 2. Distributions of measurements over time. Box-and-whisker plots depict the distributions of IVC maximum diameter measured by ultrasound and relative blood volume measured by spectrophotometry across 15 min intervals. The heights of the boxes represent interquartile ranges with horizontal white lines at the medians. The 'whiskers' span from the largest measurement that is also less than 1.5 times the interquartile range above the upper quartile to the smallest measurement that is also greater than 1.5 times the interquartile range below the lower quartile. Each participant's measurements are plotted in the background as gray lines. The horizontal black lines represent the mean and the red bands represent the 95% confidence interval of measurements modeled as quadratic functions over time (see text for details). The numbers above each whisker represent the number of participants with available measurements at each time point. The bar graph at the bottom of the figure depicts the mean cumulative net ultrafiltration of all 50 participants. Abbreviations: US = ultrasound; SpHb = spectrophotometry of capillary hemoglobin concentration.
Download figure:
Standard image High-resolution image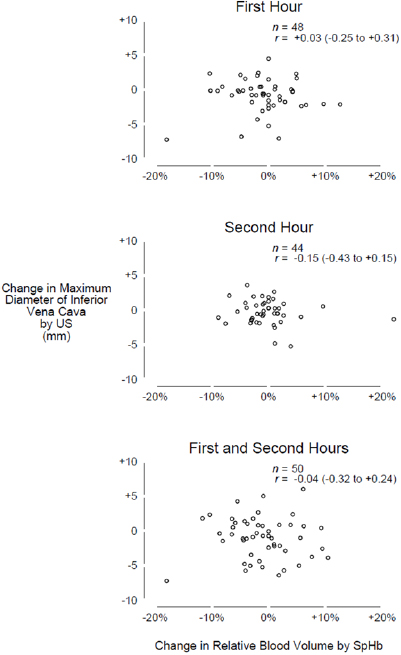
Figure 3. Scatter diagrams. Change in IVC maximum diameter measured by ultrasound (vertical axis) versus change in relative blood volume measured by spectrophotometry (horizontal axis). Circles represent data for each participant; none are exactly coincident. Only one IVC measurement was obtained for two participants during the first hour and for six participants during the second hour; changes for these participants could not be calculated within these hours. Abbreviations: US = ultrasound; SpHb = spectrophotometry of capillary hemoglobin concentration.
Download figure:
Standard image High-resolution imageGroup-based trajectory modeling categorized IVCUS and RBVSpHb profiles into three curvilinear shapes (figure 4). However, the agreement between profile shapes of each measurement type within participant was no better than that expected by chance (kappa −0.1, 95% CI −0.3 to +0.1; table 2). For example, 85% (11 of the 13 participants) who were categorized as having a decelerating negative IVCUS profile were also categorized as not having a decelerating negative RBVSpHb profile (eight were categorized as having a flat RBVSpHb profile and three as having a decelerating positive RBVSpHb profile; appendix, figure A1). There were minimal differences in baseline characteristics across participants when grouped either by IVCUS or RBVSpHb profiles (appendix, table A1, and appendix, table A2).
Table 2. Agreement between profile shapes
| Relative blood volume profile shape | IVC maximum diameter profile shape | Total | ||
|---|---|---|---|---|
| Decelerating negative | Flat | Decelerating positive | ||
| Decelerating negative | 2 | 11 | 2 | 15 |
| Flat | 8 | 15 | 1 | 24 |
| Decelerating positive | 3 | 5 | 3 | 11 |
| Total | 13 | 31 | 6 | 50 |
aMethod of categorization by profile shapes is described further in text.
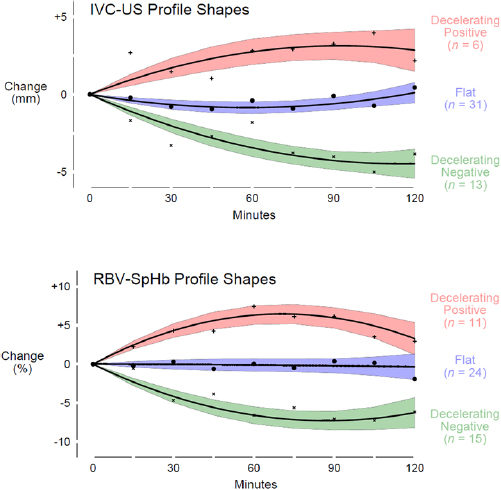
Figure 4. Profile shapes. For both IVC maximum diameter measured by ultrasound and relative blood volume measured by spectrophotometry, group-based trajectory model categorized profiles into three distinct curvilinear shapes: decelerating positive, flat, and decelerating negative. Mean trends (black lines) and corresponding 95% confidence intervals (colored bands) are depicted for each profile shape. Raw means were calculated at 15 min intervals (pluses, solid circles, and 'x's). Abbreviations: IVC-US = inferior vena cava maximum diameter measured by ultrasound; RBV-SpHb = relative blood volume measured by spectrophotometry of capillary hemoglobin.
Download figure:
Standard image High-resolution imageTable 3 further illustrates how IVCUS and RBVSpHb provided different information. No trend in maximal changes of RBVSpHb measurements was observed across participants grouped by IVCUS profiles (p -value 0.80). Nor was there a trend in maximal changes of IVC measurements across participants grouped by RBVSpHb profiles (p -value 0.26). Of the two measurement types, only RBVSpHb profiles were associated with the rate of ultrafiltration, which is the most proximate cause of blood volume change during hemodialysis: when grouped by RBVSpHb profiles, participants' net ultrafiltration rates were higher with more negative profiles (p -value for trend 0.02).
Table 3. Ultrafiltration rate and change in measurements.
| Net ultrafiltration rate, mean (SD) | Change in maximum diameter IVC, mean (SD) |
Change in relative blood volume by capillary hemoglobin spectophotometry, mean (SD) |
||
|---|---|---|---|---|
| Grouping | n | cc min−1 | mm | % |
| Overall | 50 | 11.4 (5.2) | −1.0 (3.0) | −1.2 (5.6) |
| By IVC maximum diameter profile shape |
||||
| Decelerating negative | 13 | 13.6 (7.2) | −4.9 (1.3) | −0.6 (7.0) |
| Flat | 31 | 10.4 (4.5) | −0.2 (1.5) | −1.2 (5.1) |
| Decelerating positive | 6 | 11.6 (2.3) | 3.2 (2.1) | −2.4 (6.0) |
| Test for trend |
0.19 | <0.0001 | 0.80 | |
| By relative blood volume profile shape |
||||
| Decelerating negative | 15 | 12.9 (6.4) | −0.6 (2.6) | −6.9 (4.1) |
| Flat | 24 | 12.2 (4.3) | −1.7 (2.8) | −0.1 (3.5) |
| Decelerating positive | 11 | 7.6 (3.7) | −0.1 (3.6) | 4.4 (4.0) |
| Test for trend |
0.02 | 0.26 | <0.0001 | |
aChange was measured as the measurement at the end of the assessment period minus the measurement at the beginning of the assessment period. bMethod of categorization by profile shapes is described further in text. cNon-parametric Wilcoxon-type test for trend.
Conclusions
We found that during ultrafiltration two noninvasive point-of-care measurements of blood volume—IVC maximum diameter by ultrasound and RBV inferred from spectrophotometric measurements of capillary hemoglobin concentration—did not agree. Knowing the profile (plot over time) of one measurement did not help to categorize the profile of the other measurement any better than chance alone (table 2; appendix, figure A1). Moreover, the magnitude of change in one measurement was not correlated with the magnitude of change in the other, and this lack of correlation occurred during both the first and second hours of ultrafiltration (figure 3).
Several prior studies have compared changes in IVCUS and RBV during ultrafiltration. In these studies, RBV changes were inferred from intermittent laboratory measurements of hemoglobin, rather than from continuous spectrophotometry. For example, Krepel et al (2000) found an average RBV of −10.3% alongside a drop in IVCUS of 3.0 mm, and Lopot et al (1996) found an average RBV of −8.5% alongside a drop in IVCUS of 1.5 mm. Given that our average ultrafiltration rates (table 1) were similar to those used by these authors, our smaller RBV and IVCUS changes (figure 2 and table 3) may reflect that our patients were more fluid overloaded at the onset of dialysis. Alternatively, our findings may simply reflect that our measurements were taken across much shorter durations: 2 h instead of four or more.
We chose to study shorter 2 h durations, because our ultimate goal is to measure profiles of blood volume changes from single diuretic doses—and determine how those profiles change across serial doses during the course of acute heart failure treatment. In order to detect such changes in blood volume, which is dynamically counterbalanced by refill from the interstitium (depending on the amount of excess fluid present), blood volume assessments need to occur at a minimum of three time points: before, during, and after each diuretic dose. Since intravenous boluses of furosemide (the most commonly used diuretic in acute heart failure (Bikdeli et al 2013)) achieve maximum diuresis in 1–2 h (Seldin and Giebisch 1997), the three time points should be separated by only an hour. Katzarski et al (1997) and Tetsuka et al (1995) tracked hourly blood volume change by serial laboratory hematocrits and IVCUS. Similar to our findings, the average profiles for IVCUS and hematocrit-based relative blood volume did not appear to agree, although neither study formally quantified agreement in profiles as we did. In particular, decreases in the IVCUS dramatically outpaced reductions in relative blood volume. The lack of agreement demonstrated by our findings and these earlier studies suggests that profiles of IVCUS reflect something other than simply how RBV changes over time.
Even though the IVC is the major conduit of the venous compartment, the IVC is not a simple passive estimate of total blood volume, because interrelated changes in pressure and flow affect IVC dimensions regardless of changes in total blood volume. The venous compartment is a tightly controlled reservoir that serves to redistribute blood to or from the arterial compartment. In response to hemorrhage, for example, the flow and compliance of selected venous beds are quickly reduced to maintain arterial pressure, even when as much as 25% of total blood volume is lost (Gelman 2008). Moreover, changes in pressure and flow of the venous compartment occur even without changes in total blood volume (Magder and De Varennes 1998). One example of this is when blood volume shifts from the splanchnic bed to overload the arterial compartment and cause acute heart failure (Fallick et al 2011). Another example occurs during the early stages of hemodialysis. Using invasive measurements, Rouby et al (1980) and Hampl et al (1985) found large reductions in central venous pressure without significant volume removal. Hemodynamic changes induced by hemodialysis may explain why IVCUS changes did not agree with RBVSpHb changes among our participants.
Agreement may also have been affected by blunted hemoglobin changes due to redistribution of blood between the microcirculation (capillaries and venules less than 200 micrometers in diameter) and the central circulation. Due to a well-known physiological phenomenon called the Fahraeus effect, the hematocrit of the microcirculation is generally lower than the central circulation. Some reports have suggested that the microcirculation volume diminishes during hemodialysis (Mitra et al 2004), effectively infusing more dilute blood into the central circulation, and thereby blunting changes in hemoglobin concentration relative to actual changes in blood volume (Dasselaar et al 2007). However, other more recent reports suggest that, among patients undergoing routine hemodialysis (such as our patients), such blunting does not, in fact, occur (Schneditz et al 2016).
Our study had several limitations. First, we did not have a 'gold' (or reference) standard to compare RBVSpHb measurements against. Nevertheless, we found that more negative RBV profiles were associated with higher average ultrafiltration rates, as expected (Lopot et al 1996, Mitra et al 2002), and others have found good agreement between blood volume change by finger-clip and online devices (Yamada et al 2015). Second, the reproducibility of our finger-clip device may have been too low to reliably detect small changes in blood volume (Gayat et al 2011). Indeed, in our own hands, we found that the RBV measurements were highly susceptible to movement and temperature changes. In addition, previous reports have shown that average absolute differences between single SpHb 'spot-checks' and the reference standard of laboratory co-oximetry exceed typical hemoglobin changes during hemodialysis (Miller et al 2011, Raikhel 2012). Yet the focus of our study was not single SpHb measurements but multiple measurements within patients over time, which tend to improve accuracy. For example, others have shown 90% accuracy for SpHb directional changes among children (Patino et al 2014) and adults (Colquhoun et al 2012) undergoing surgical procedures, regardless of the degree of blood loss measured by laboratory co-oximetry. Third, we assumed that the association between change in IVC diameter and change in RBV was linear, but the actual form is unknown. The volume of the IVC (which resembles a cylinder) is proportionate to the square of its diameter; so if IVC dimensions changed proportionately with total blood volume (admittedly an oversimplification), a reduction in its diameter by one-half would result in a blood volume that is one-quarter of the original size. Nevertheless, we did not see any nonlinear patterns of association in our scatterplots of change (figure 3). Fourth, we had limited baseline data to estimate the degree of fluid overload, before or after hemodialysis. Additional routine clinical data, however, are themselves imperfect and rarely definitive (Agarwal 2013).
These limitations could be initially addressed in patients undergoing ultrafiltration—either from hemodialysis or isolated ultrafiltration (Costanzo et al 2017)—by comparing IVC measurements against other measurements of blood volume change. For example, Schneditz et al (2016) used spectrophotometric sensors attached to the extracorporeal circuits of hemodialysis machines to measure both hematocrit change and indocyanine green dye dilution. Similar online sensors in our units (Crit-Line®-III, Fresenius Medical Care, Concord, CA) were unavailable during our study period because a critical accessory had been recalled by the Food and Drug Administration. Regardless, our aim is to develop a noninvasive method of measuring blood volume change during diuresis, because the current clinical urgency is not for the few acute heart failure patients with extracorporeal circuits but for the overwhelming majority without them (Peacock and Soto 2010). Therefore, eventually a noninvasive measure of hemoconcentratration will need to be compared against high-frequency phlebotomy as a reference standard.
Our findings suggest that point-of-care ultrasound would not be a reliable method for targeting particular blood volume profiles across serial diuretic doses. More limiting than its operator-dependence (Ishibe and Peixoto 2004), which can be remediated (Lucas et al 2017), is what our findings suggest: IVC measurements are subject to hemodynamic factors other than total blood volume change. Given that loop diuretics induce hemodyamic changes before diuresis (Seldin and Giebisch 1997) (which are similar to the changes induced by hemodialysis), IVC measurements after diuretic fluid removal may not accurately reflect blood volume change. Tracking blood volume changes during fluid removal remains a plausible target for diuretic therapy in acute heart failure (Boyle and Sobotka 2006), but a reliable, noninvasive way to measure that refill at the point-of-care has not yet been identified.
Acknowledgments
We thank FUJIFILM SonoSite, Incorporated (Bothell, WA) for loaning us an M-Turbo Ultrasound System during the study period.
Funding
Department of Veterans Affairs, Veterans Health Administration, Office of Research and Development and Dartmouth SYNERGY, National Institutes of Health, National Center for Advancing Translational Science (UL1TR001086)
Conflict of interest
We have no relevant affiliations pertaining to the subject matter or materials to disclose.
Disclaimer
The contents of this publication do not represent the views of the U.S. Department of Veterans Affairs or the United States Government
Appendix
Table A1. Association between baseline participant characteristics and IVC maximum diameter profile.
| Characteristic | Combined | IVC maximum diameter profile shapea | Test for Trend | ||
|---|---|---|---|---|---|
| Decelerating negative | Flat | Decelerating positive | P | ||
| N = 50 | n = 13 | n = 31 | n = 6 | ||
| Age, mean (SD), y | 64 (17) | 63 (19) | 65 (17) | 65 (12) | 0.97b |
| Women, no. (%) | 21 (42) | 8 (62) | 12 (39) | 1 (17) | 0.06c |
| Caucasian, no. (%) | 48 (96) | 12 (92) | 30 (97) | 6 (100) | 0.39c |
| Body mass index, mean (SD), m kg−2 | 27 (4) | 27 (5) | 27 (4) | 26 (3) | 0.84b |
| Duration of renal replacement therapy, median (IQR), mod | 15 (3–30) | 10 (3–21) | 12 (1–30) | 37 (20–108) | 0.08b |
| Serum albumin, mean (SD), g dl−1e | 3.7 (0.6) | 3.7 (0.6) | 3.6 (0.6) | 4.0 (0.6) | 0.43b |
| Hemoglobin, mean (SD), g dl−1 | 9.9 (1.5) | 9.7 (1.6) | 10.0 (1.5) | 9.8 (1.1) | 0.78b |
| Total protein, mean (SD), gm dl−1f | 6.5 (1.0) | 6.4 (1.1) | 6.6 (1.0) | 6.3 (0.8) | 0.78b |
| Catheter was used for dialysis, no. (%)g | 25 (51) | 8 (62) | 17 (55) | 0 (0) | 0.06c |
| Currently hospitalized, no. (%) | 25 (50) | 5 (38) | 18 (58) | 2 (33) | 0.82c |
| Dialyzed on Monday or Tuesday, no. (%)h | 18 (36) | 2 (15) | 13 (42) | 3 (50) | 0.09c |
| Pre-dialysis weight minus dry weight, mean (SD), kgi | 2.6 (3.3) | 3.3 (3.7) | 1.9 (3.6) | 3.2 (0.5) | 0.62b |
| Post-dialysis weight minus dry weight, mean (SD), kgi | 0.3 (2.6) | 0.7 (3.0) | 0.1 (2.8) | 0.2 (0.6) | 0.86b |
| Routine transthoracic echocardiography | |||||
| Left ventricle ejection fraction, mean (SD), %j | 58 (16) | 63 (16) | 55 (15) | 75 (NA) | 0.26b |
| Moderate or severe tricuspid regurgitation, no. (%)j | 10 (32) | 1 (13) | 9 (41) | 0 (0) | 0.33c |
| Pulmonary artery systolic pressure, mean (SD), mm Hgk | 43 (15) | 51 (5) | 41 (16) | 34 (NA) | 0.44b |
| Baseline IVC, mean (SD) | |||||
| Maximum diameter, mm | 15.1 (5.2) | 15.9 (3.8) | 15.6 (5.5) | 10.8 (4.4) | 0.08b |
| Collapsibility index | 0.49 (0.26) | 0.53 (0.27) | 0.46 (0.25) | 0.59 (0.25) | 0.43b |
| Net ultrafiltration volume, mean (SD), cc | |||||
| Before agreement assessment | 298 (289) | 345 (331) | 255 (286) | 417 (169) | 0.36b |
| During agreement assessment | 1304 (563) | 1520 (668) | 1192 (519) | 1418 (449) | 0.19b |
| Duration of hemodialysis, mean (SD), min | |||||
| Prior to measurement period | 45 (16) | 40 (21) | 45 (15) | 52 (11) | 0.32b |
| During measurement period | 117 (23) | 119 (23) | 116 (23) | 120 (23) | 0.85b |
| Net ultrafiltration rate prior to measurement period, mean (SD), cc min−1 | 5.9 (6.3) | 5.4 (6.9) | 6.7 (6.3) | 5.0 (5.5) | 0.71b |
Abbreviation: IQR, interquartile range. aMethod of categorization of profiles is described further in text. bOne-way analysis of variance testing differences in means from adjacent levels. cNon-parametric Wilcoxon-type test for trend. dData were missing for participants from decelerating negative (n = 1) and flat (n = 1) profile groups. eData were missing for participants from decelerating negative (n = 1) and flat (n = 1) profile groups. fData were missing for participants from decelerating negative (n = 3), flat (n = 6), and decelerating positive (n = 4) profile groups. gData were missing for 1 participant from decelerating positive profile group. hRemaining participants were dialyzed on Wednesday or Thursday (n = 16) and Friday or Saturday (n = 16). iData were missing for participants from decelerating negative (n = 5), flat (n = 18), and decelerating positive (n = 2) profile groups. jData were missing for participants from decelerating negative (n = 5), flat (n = 9), and decelerating positive (n = 5) profile groups. kData were missing for participants from decelerating negative (n = 9), flat (n = 13), and decelerating positive (n = 5) profile groups.
Table A2. Association between baseline participant characteristics and relative blood volume profile.
| Characteristic | Combined | Relative blood volume profile shapea | Test for Trend | ||
|---|---|---|---|---|---|
| Decelerating negative | Flat | Decelerating positive | P | ||
| N = 50 | n = 15 | n = 24 | n = 11 | ||
| Age, mean (SD), y | 64 (17) | 58 (19) | 65 (14) | 71 (18) | 0.14b |
| Women, no. (%) | 21 (42) | 4 (27) | 13 (54) | 4 (36) | 0.51c |
| Caucasian, no. (%) | 48 (96) | 14 (93) | 24 (100) | 10 (91) | 0.87c |
| Body mass index, mean (SD), m kg−2 | 27 (4) | 28 (3) | 27 (4) | 25 (5) | 0.24b |
| Duration of renal replacement therapy, median (IQR), mod | 15 (3–30) | 18 (1–48) | 11 3–36) | 18 (5–26) | 0.66b |
| Serum albumin, mean (SD), g dl−1e | 3.7 (0.6) | 3.7 (0.7) | 3.6 (0.6) | 3.9 (0.4) | 0.40b |
| Hemoglobin, mean (SD), g dl−1 | 9.9 (1.5) | 9.9 (1.8) | 10.0 (1.5) | 9.6 (1.1) | 0.71b |
| Total protein, mean (SD), gm dl−1f | 6.5 (1.0) | 6.6 (0.7) | 6.6 (1.1) | 6.2 (0.8) | 0.56b |
| Catheter was used for dialysis, no. (%)g | 25 (51) | 6 (40) | 15 (63) | 4 (40) | 0.83c |
| Currently hospitalized, no. (%) | 25 (50) | 7 (47) | 13 (54) | 5 (45) | 0.99c |
| Dialyzed on Monday or Tuesday, no. (%)h | 18 (36) | 5 (33) | 11 (46) | 2 (18) | 0.53c |
| Pre-dialysis weight minus dry weight, mean (SD), kgi | 2.6 (3.3) | 3.1 (3.4) | 3.3 (2.9) | 0.5 (3.5) | 0.22b |
| Post-dialysis weight minus dry weight, mean (SD), kgi | 0.3 (2.6) | 0.8 (3.0) | 0.6 (2.0) | −0.9 (2.9) | 0.46b |
| Routine transthoracic echocardiography | |||||
| Left ventricle ejection fraction, mean (SD), %j | 58 (16) | 63 (11) | 54 (19) | 59 (13) | 0.38b |
| Moderate or severe tricuspid regurgitation, no. (%)j | 10 (32) | 2 (20) | 7 (50) | 1 (14) | 0.99c |
| Pulmonary artery systolic pressure, mean (SD), mm Hgk | 43 (15) | 30 (8) | 49 (12) | 49 (17) | 0.008b |
| Baseline IVC, mean (SD) | |||||
| Maximum diameter, mm | 15.1 (5.2) | 15.1 (6.0) | 16.5 (4.7) | 12.2 (4.1) | 0.08b |
| Collapsibility index | 0.49 (0.26) | 0.47 (0.24) | 0.46 (0.26) | 0.58 (0.27) | 0.41b |
| Net ultrafiltration volume, mean (SD), cc | |||||
| Before agreement assessment | 298 (289) | 326 (276) | 319 (287) | 213 (319) | 0.55b |
| During agreement assessment | 1304 (563) | 1388 (522) | 1400 (573) | 982 (517) | 0.10b |
| Duration of hemodialysis, mean (SD), min | |||||
| Prior to measurement period | 45 (16) | 48 (21) | 42 (14) | 46 (14) | 0.50b |
| During measurement period | 117 (23) | 116 (28) | 114 (23) | 125 (11) | 0.40b |
| Net ultrafiltration rate prior to measurement period, mean (SD), cc min−1 | 5.9 (6.3) | 5.4 (6.9) | 6.7 (6.3) | 5.0 (5.5) | 0.71b |
Abbreviation: IQR, interquartile range. aMethod of categorization of profiles is described further in text. bOne-way analysis of variance testing differences in means from adjacent levels. cNon-parametric Wilcoxon-type test for trend. dData were missing for 2 participants from flat profile group. eData were missing for 2 participants from decelerating negative profile group. fData were missing for participants from decelerating negative (n = 7), flat (n = 5), and decelerating positive (n = 1) profile groups. gData were missing for 1 participant from decelerating positive profile group. hRemaining participants were dialyzed on Wednesday or Thursday (n = 16) and Friday or Saturday (n = 16). iData were missing for participants from decelerating negative (n = 7), flat (n = 13), and decelerating positive (n = 5) profile groups. jData were missing for participants from decelerating negative (n = 5), flat (n = 10), and decelerating positive (n = 4) profile groups. kData were missing for participants from decelerating negative (n = 7), flat (n = 15), and decelerating positive (n = 5) profile groups.

Figure A1. Matrix of agreement between profile categorization of relative blood volume by spectrophotometry of capillary hemoglobin and maximum diameter of IVC by ultrasound. RBVSpHb and IVCUS profiles for each participant were categorized into one of three shapes (decelerating negative, flat, and decelerating positive) using group-based trajectory modeling (see text for details). The rows represent the RBVSpHb profiles and the columns represent the IVCUS profiles. Average measurements (hollow black diamonds) and average profiles (thick red lines and thick blue lines) are depicted in graphs at the left of each row and the top of each column for each type of RBVSpHb or IVCUS profile, respectively. Each participant has one RBVSpHb profile (thin red line) and one IVCUS profile (thin blue line) in only one plot among the 3-by-3 matrix of possible combinations of profile shapes of each measurement type. Exactly which cell a participant's profiles are in depends upon the dual categorization of each profile. For example, five participants were categorized as having a decelerating positive RBV profile but a flat IVC maximum diameter profile. The three cells with purple shading along the diagonal of the matrix represent profile categorizations that agree in both measurement types. The kappa statistic was 0.0 (95% CI −0.2 to +0.2), indicating no meaningful agreement between profiles from the two measurement types. Abbreviations: IVCUS = IVC maximum diameter measured by ultrasound; RBVSpHb = relative blood volume measured by spectrophotometry of capillary hemoglobin.
Download figure:
Standard image High-resolution image