

Abstract
Silicon photomultipliers (SiPMs) are widely used in positron emission tomography (PET), however, SiPMs from different vendors vary in their performance characteristics. In addition, the specifications provided by the manufacturers are measured under different operating conditions and using different test setups, making it difficult to choose the optimal device for a specific application using the published specifications. In this work, we evaluated four state-of-the-art 8 × 8 arrays of ~3 × 3 mm2 SiPMs from SensL, KETEK, and Hamamatsu for high-resolution dual-ended readout detectors using the same experimental setup and procedures. The results showed that all four SiPM arrays are excellent candidates for high-resolution PET applications, although some interesting differences in performance were noted.
Export citation and abstract BibTeX RIS
1. Introduction
Silicon photomultipliers (SiPMs), also known as multi-pixel photon counters (MPPCs) and Geiger avalanche photodiodes (G-APDs), have been widely used in positron emission tomography (PET), due to their high gain, low operating voltage, high photodetection efficiency (PDE), compact form factor, insensitivity to magnetic fields and relatively low cost (Buzhan et al 2003, Roncali and Cherry 2011). In the past ten years, clinical and pre-clinical PET scanners have been developed and reported both by industry and academic institutions using SiPMs from different vendors (Kwon et al 2011, Goertzen et al 2016, Grant et al 2016, Omidvari et al 2017, Berg and Cherry 2018) and research into SiPM-based PET detectors and PET scanners with improved performance continues at a rapid pace (Cherry et al 2017, Benlloch et al 2018, Borghi et al 2018, Du et al 2018). Manufacturers are also working hard to improve the performance of SiPMs, by further reducing their noise, increasing the gain and PDE. However, every SiPM vendor has their own unique methods for fabricating SiPMs, leading to variations in properties such as microcell size, noise, and PDE (Hamamatsu 2016, KETEK 2016b, SensL 2017). In addition, SiPMs from different manufacturers are characterized using different methods and under different conditions, which makes it difficult to choose the best SiPM for a specific PET application by comparing the published manufacturer performance specifications. Hence, SiPMs are always also evaluated by the users for their own specific applications on a case-by-case basis (Dolinsky et al 2015, Grodzicka-Kobylka et al 2017, Nemallapudi et al 2016) and there are very little published data showing a direct comparison of state-of-the-art SiPM arrays tested under the same conditions.
In this paper, four of the latest generation, commercially available, 8 × 8 arrays of ~3 × 3 mm2 SiPMs from three vendors (SensL, KETEK and Hamamatsu) were evaluated using the same setup and experimental methods focused on measurements relevant to high-resolution PET detectors, with the ultimate motivation and application being detectors suitable for a dedicated brain PET scanner using dual-ended readout detectors (Du et al 2018).
2. Materials and methods
2.1. SiPM arrays and detector modules
Schematics and photographs of the four SiPM arrays that were tested are shown in figure 1, whilst the characteristics of the SiPM arrays are listed in table 1. The reported PDEs of the SiPM arrays are shown in figure 2. The SensL SiPM array and the KETEK SiPM array both have a pitch size of 3.36 mm, whilst the two Hamamatsu SiPM arrays have a pitch size of 3.2 mm. The PDE, provided by the manufacturers, were measured at room temperature, but at different over-voltages (OV, voltage above the breakdown voltage).
Table 1. Characteristics of the SiPM Arrays
| SensL MicroFJ-30035-64P | KETEK PA3325-WB-0808 | Hamamatsu | ||
|---|---|---|---|---|
| S13361-3050NE-08 | S14161-3050HS-08 | |||
| Pitch/mm | 3.36 | 3.36 | 3.2 | 3.2 |
| Active area per pixel/mm2 | 3.07 × 3.07 | 3.0 × 3.0 | 3.0 × 3.0 | 3.0 × 3.0 |
| Microcell size/µm | 35 | 25 | 50 | 50 |
| No. of microcells/mm2 | 630 | 1547 | 398 | 392 |
| Fill factor (%) | 75 | — |
74 | 74 |
| Breakdown voltage (VBD)/V | 24.5 |
27 |
52 |
37 |
| Temp. dependency of VBD (mV/°C) | 21.5 | 22.0 | 54 | 34 |
| Signal rise time/ns | 0.1 | <1 | — | — |
| Recovery time/ns | 37 | 40 | — | — |
| Spectral response range/nm | 200–900 | 300–900 | 320–900 | 270–900 |
| Window material | Glass | — | Epoxy | Silicone |
| Window refractive index | 1.53 | — | 1.55 | 1.57 |
| Peak PDE wavelength (λp) | 420 | — | 450 | 450 |
aKETEK (2016a, 2016b), Hamamatsu (2016, 2017) and SensL (2017, 2018). b—Unknown. cMeasured at 21 °C. dMeasured at 25 °C.
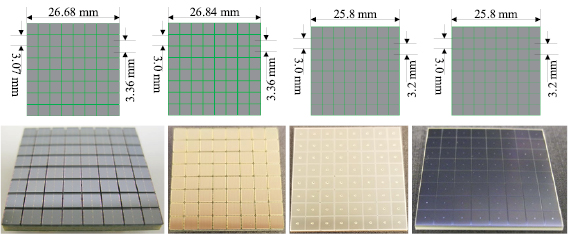
Figure 1. (Top row) Schematics and (bottom row) photographs of the SiPM arrays tested. From left to right, SensL MicroFJ-30035, KETEK PA3325-WB, Hamamatsu S13361-3050, and Hamamatsu S14161-3050.
Download figure:
Standard image High-resolution image
Figure 2. PDE of the SiPM arrays versus wavelength. Data provided by the manufacturers (KETEK 2016b, Hamamatsu 2016 and SensL 2017). Note that the published PDEs were acquired at different OVs. For a given SiPM, the PDE increases at higher OV. The PDE at 430 nm of the KETEK SiPM is 31% at an OV of 2.5 V.
Download figure:
Standard image High-resolution imageTo evaluate the SiPM arrays for high-resolution PET applications, four dual-ended readout detector modules were fabricated. Each detector module was assembled using two of the same SiPM arrays coupled to both ends of the same 24 × 24 array of 0.945 × 0.945 × 20 mm3 polished LYSO crystals (Crystal Photonics, Inc., FL). The pitch size of the LYSO array was 1.0 mm and Toray lumirror E60 film (Toray Industries Inc., Japan) was used as the inter-crystal reflector (James et al 2009, Kuang et al 2018, Yang et al 2011). The crystal array was coupled to the SiPM arrays using BC-630 optical grease (Saint-Gobain, S.A.) and clear acrylic sheets with a thickness of 1.0 mm were used as light guides. The BC-630 and the acrylic sheet have a refractive index of 1.465 and 1.49, respectively.
2.2. Readout electronics
Each DOI detector module has two 8 × 8 SiPM arrays with 128 SiPM pixels/signals. To simplify the readout electronics, for each array, the 64 SiPM signals were amplified individually using transimpedance amplifiers based on AD8045 chips, and the amplified SiPM signals were summed into rows and columns, generating 8 row and 8 column signals. The row/column signals were weighted by applying a gain to each row and column proportional to its location along each axis, generating four signals (X+, X− and Y+, Y−) for position information (Popov 2011). Figure 3 shows the signal multiplexing boards. Each board can handle the 64 signals from each 8 × 8 SiPM array, and the two stacked boards multiplex the 128 SiPM signals from each DOI detector module into nine signals, eight for position information and one for timing information. The timing signal was created from the sum of the 16 row and 16 column signals. The eight signals for position information were further shaped by a CAEN spectroscopy amplifier (N586B, CAEN S.p.A., Italy) and digitized by a PowerDAQ board (PD2MFS, United Electronic Industries, Inc., USA) (Du et al 2018).

Figure 3. Photograph of the signal multiplexing boards. Two identical boards were stacked together to handle the 128 signals from each dual-ended detector module. Each board can process the 64 signals from one 8 × 8 SiPM array.
Download figure:
Standard image High-resolution imageThe gamma photon interaction position (x, y ), deposited energy (E) and DOI information were calculated as follows (Du et al 2016, 2016):


where  and
and  were the two energies detected by the two SiPM arrays coupled at opposite ends of the LYSO array.
  ,
,  ,
,  ,
,  (i = 1, 2) were the position signals from SiPM array i. a and b were constants used to model the relationship between the ratio of the two energies and the DOI.
2.3. Experimental methods
Identifying the optimal bias voltage for measuring the flood histogram is essential to achieve the best performance for high-resolution detectors (Du et al 2016, 2018), hence, the crystal identification ability (flood histogram) of the detector modules was evaluated at different bias voltages (with an 0.5 V interval) and at four different temperatures (table 2), whilst the energy, timing, and DOI resolution were evaluated at the optimal bias voltage found for each SiPM array for the flood histogram (table 3). The detector module being evaluated, along with the electronics boards (figure 3), were placed in a light-tight black box and cooled using cold, dry air. The detector's temperature was monitored by a thermocouple attached to the back side of the SiPM array. A 0.25 mm diameter, 30 uCi 22Na point source was used to irradiate the LYSO array, and a 350–750 keV energy window was applied to each crystal to select events.
Table 2. Experimental conditions.
| SensL MicroFJ-30035 | KETEK PA3325-WB | Hamamatsu | ||
|---|---|---|---|---|
| S13361-3050 | S14161-3050 | |||
| Bias voltage/V | 26.5–30.0 | 29.5–33.5 | 53.5–58.5 | 39.0–42.5 |
| Temperature/°C | 0, 10, 20, 30 | |||
Table 3. The optimal bias voltage for the flood histogram.
| Temperature/°C | Bias voltage/V | |||
|---|---|---|---|---|
| SensL MicroFJ-30035 | KETEK PA3325-WB | Hamamatsu | ||
| S13361-3050 | S14161-3050 | |||
| 0 | 27.5 | 31.5 | 55.0 | 39.5 |
| 10 | 27.5 | 31.5 | 55.5 | 40.5 |
| 20 | 27.5 | 31.5 | 56.0 | 40.5 |
| 30 | 28.0 | 31.5 | 57.0 | 41.0 |
Experimental methods followed the methods we have previously developed and published and are only briefly summarized here (Du et al 2016, 2016).
2.3.1. Flood histograms.
Flood histogram data were acquired using a reference detector consisting of a 25 mm diameter × 30 mm cylindrical LYSO crystal (wrapped with six layers of Teflon) coupled to a Hamamatsu R13449-10 PMT and a timing window of 10 ns. The distance between the source and the DOI detector was 10 cm, and the source was placed 3 cm from the reference detector. To quantitatively compare the flood histograms, a flood histogram quality metric, k, was computed by calculating the distance between adjacent crystal spots divided by the width of the crystal spots (Du et al 2016). The optimal bias voltage for the flood histogram was determined as the settings at which the highest value of k was obtained.
Because the Hamamatsu SiPM arrays are slightly smaller (figure 1), and the 24 × 24 LYSO array comes closer to the edges compared with the SensL and KETEK arrays, some crystals in the last two columns could not be identified in the flood histograms. Hence the flood histogram quality was computed using only the central 20 × 20 LYSO elements for fair comparison. The energy resolution and the timing resolution were also computed using the central 20 × 20 LYSO elements.
2.3.2. Energy resolution.
The energy resolution was calculated using the same data obtained for the flood histograms and energy spectra were extracted for individual crystals in the LYSO array. The energy resolution at 511 keV for each crystal was the ratio of the FWHM to the amplitude of the photopeak from a Gaussian fit to the energy spectra, expressed as a percentage.
2.3.3. Signal-to-noise ratio (SNR)
The SNR was calculated for each crystal using the data obtained for the flood histograms. The signal amplitude was taken as the centroid of the Gaussian fit to the 511 keV photopeak of the energy spectrum. The noise was the FWHM of histogram of the summed eight position signals obtained by periodically triggering the DAQ board using the computer clock. The average SNR across the selected 20 × 20 crystals was calculated as the SNR of the detector module (Du et al 2018).
2.3.4. DOI measurements.
The detector module was irradiated from the side at five fixed depths (2 to 18 mm, in 4 mm intervals) by using a reference detector (based on 25 mm diameter Hamamatsu R13449-10 PMT and a 0.5 × 20 × 20 mm3 LYSO plate wrapped with Teflon) in coincidence (Du et al 2018). The distance from the 22Na source to the reference detector was 100 mm and the distance from the 22Na source to the dual-ended readout detector was 80 mm. Data was collected at different depths and DOI was calculated by comparing the two energy signals detected by the two SiPM arrays with appropriate calibration (equation (3)). The FWHM of the DOI distribution was used as a measure of the DOI resolution (Du et al 2018). Because only some of the LYSO elements were efficiently irradiated due to the geometry, and the fact that the signal drops off quickly with distance from the side entrance face (figure 4), only the 12 × 12 LYSO elements shown in the white rectangle in figure 4 were used to compute the DOI resolution.

Figure 4. Crystals shown in the white rectangle were used to calculate the DOI resolution.
Download figure:
Standard image High-resolution image2.3.5. Timing measurements
Coincidence timing resolution (CTR) data were acquired using a reference detector consisting of a 16 × 16 × 16 mm3 LYSO cube (wrapped with six layers of Teflon) coupled to a Hamamatsu R13449-10 PMT in coincidence. Timing triggers were generated using constant fraction discriminators (CFDs) (Model 584, ORTEC, TN), both for the SiPM-based detector and the reference detector and sent to a time-to-amplitude converter (TAC) (Model 566, ORTEC, TN). The delay for the CFDs used for the SiPM signal and PMT signal were 16 ns and 1 ns, respectively, with the CFD threshold set just above the noise level. The output of the TAC was digitized using an analog-to-digital converter (ADC) (PD2MFS, United Electronic Industries, Inc., MA). Timing spectra were extracted for individual crystals in the LYSO array and the FWHM of a Gaussian fit to the coincidence timing spectra (test detector in coincidence with reference detector) was taken as the CTR. The CTR of two identical reference detectors was 446 ± 15 ps.
3. Results
3.1. Flood histograms
Figure 5 shows the best flood histogram obtained using the different SiPM arrays at 0 °C. All the LYSO crystals can be clearly identified except some crystals in the last two rows and columns in the flood histograms obtained using the Hamamatsu SiPM arrays. As explained earlier, this is because the LYSO array extends closer to the edges of the Hamamatsu arrays due to their slightly smaller area, making it difficult to identify the outermost crystals using light sharing. The flood histogram quality metric, calculated using the central 20 × 20 LYSO elements and the method described in Du et al (2016), is shown in figure 6. The flood histogram quality generally increases and then decreases with increasing bias voltage, however, the responses of the SiPMs are quite different. While the Hamamatsu arrays can yield the highest values, the values also show a larger dependence on the bias voltage than these obtained using the SensL and the KETEK SiPM arrays. Better flood histogram quality was obtained at lower temperature, as expected, due to the lower SiPM noise (Piemonte et al 2013).

Figure 5. Flood histogram obtained using (from left to right) SensL, KETEK, Hamamatsu S13361 and Hamamatsu S14161 SiPM arrays at a temperature of (top row) 0 °C and (bottom row) 20 C. The bias voltages were listed in table 3.
Download figure:
Standard image High-resolution image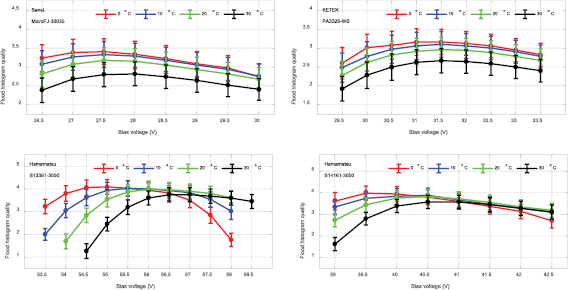
Figure 6. Flood histogram quality versus overvoltage and temperature.
Download figure:
Standard image High-resolution imageThe highest flood histogram quality values obtained using different SiPM arrays at different temperatures are shown in figure 7 and the corresponding bias voltages are listed in table 3. The best flood histogram was obtained using the Hamamatsu S13361 SiPM arrays. Table 3 and figure 6 show that the optimal bias voltage for the flood histogram at different temperatures varies little for the SensL and KETEK SiPM arrays, but increases with increasing temperature for the Hamamatsu SiPM arrays.

Figure 7. Highest flood histogram quality values versus temperature.
Download figure:
Standard image High-resolution image3.2. Energy resolution
The average energy resolution calculated using the central 20 × 20 LYSO elements are shown in figure 8. The average energy resolution obtained using different SiPM arrays are comparable and does not change much with increasing temperature. The average energy resolution measured here, 25%–27%, is poorer than other reports in the literature (Borghi et al 2018, Choe et al 2017), because the LYSO arrays (reflector and surface treatment) were optimized to obtain good DOI information. These LYSO arrays exhibit a strong depth dependence of the 511 keV photopeak position (Ren et al 2014).
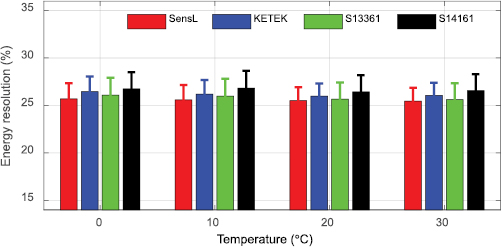
Figure 8. Average energy resolution versus temperature.
Download figure:
Standard image High-resolution image3.3. Signal-to-noise ratio (SNR)
The average signal, noise and average SNR across the central 20 × 20 LYSO elements are shown in figure 9. They were obtained at the optimal bias voltage for the flood histogram (shown in table 3). Better SNR was obtained at lower temperatures, as expected. The best SNR was obtained using the Hamamatsu S13361 SiPMs. Interestingly, the Hamamatsu S13361, despite having slightly higher noise, gives better SNR than the Hamamatsu S14161 at these settings. This is because the working over-voltage of the Hamamatsu S13361 SiPM for the optimal flood histogram is higher than that of the S14161 SiPM, and the increase in signal at this over-voltage outweighs the higher noise levels.

Figure 9. (Top) Signal, (middle) noise and (bottom) SNR versus temperature.
Download figure:
Standard image High-resolution image3.4. DOI resolution
The average DOI resolution across the selected crystals (figure 4) and all the five depths are shown in figure 10. The average DOI resolution degrades slightly with increasing temperature. The average value of the DOI resolution obtained using different SiPM arrays are comparable, with slightly better DOI resolution obtained using the SensL and the Hamamatsu S13361 SiPM arrays.
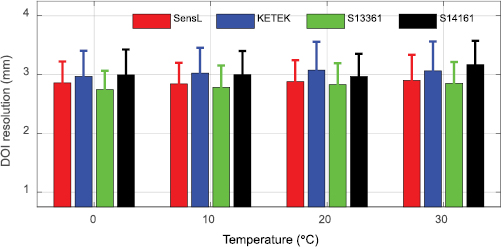
Figure 10. Average DOI resolution versus temperature.
Download figure:
Standard image High-resolution image3.5. Timing resolution
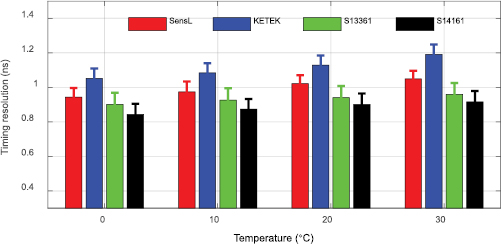
The CTR (test detector in coincidence with reference detector) averaged across the central 20 × 20 LYSO elements and obtained at different temperatures is shown in figure 11. The timing resolution obtained using different SiPM arrays degrades with increasing temperature, and the best timing resolution was consistently obtained using the Hamamatsu S14161 SiPM arrays.
Figure 11. Average timing resolution versus temperature.
Download figure:
Standard image High-resolution image
4. Discussion and conclusions
In this paper, the performance of four commercially available 8 × 8 arrays of ~3 × 3 mm2 SiPMs from three leading vendors (SensL, KETEK, and Hamamatsu) were evaluated and compared in a high-resolution dual-ended readout detector module. Overall, the four SiPM arrays are all excellent candidates for high-resolution PET applications. However, due to the different properties and characteristics of the four SiPM arrays (figure 2 and table 1), such as the microcell size, the gain, and the PDE, the four detector modules show some interesting performance differences.
LYSO arrays with a pitch size of 1.0 mm and a length of 20 mm can be clearly resolved by the four SiPM arrays (figure 5). Higher flood histogram quality values and higher SNR values were measured using the Hamamatsu SiPM arrays (figures 7 and 9), mainly due to the slightly smaller pitch size (table 1) and the higher PDE (figure 2) of the Hamamatsu SiPM arrays. However, the flood histograms obtained with the SensL and KETEK SiPM arrays were less sensitive to bias voltage, and the SensL and KETEK SiPMs have lower operating bias voltages, which could be advantages in a scanner setting.
The energy resolution obtained using the four SiPM arrays are comparable (figure 8). The energy resolution was not corrected for saturation, as the light is spread across multiple SiPMs at both ends of the scintillator array. The energy resolution is mainly dominated by the performance of the LYSO array, due to the fabrication method and the Toray reflector which emphasized good DOI performance. Better energy resolution could be obtained using a different reflector (such as BaSO4) and a different fabrication method (Stickel et al 2007, Kuang et al 2017), or by measuring the energy spectrum as a function of interaction depth.
As expected, the DOI resolution degrades with increasing temperature, as the noise of SiPMs increases as the temperature goes up (Piemonte et al 2013, Du et al 2016). The DOI resolution is ~3 mm, and slightly better values were obtained using the SensL SiPM arrays and the Hamamatsu S13361 SiPM arrays.
The best timing resolution was obtained using the Hamamatsu S14161 arrays (figures 2 and 11). The timing resolution is around 1 ns, which is not as good as the start-of-art time-of-flight PET detectors and scanners (Borghi et al 2018, Grant et al 2016, Nemallapudi et al 2016), but is still sufficient for high resolution dedicated organ and small animal PET scanners. The timing resolution is mainly dominated by the multiplexing readout method and the less than optimal light collection of the LYSO array (Aguilar et al 2015) which is designed to provide high DOI resolution. The timing resolution could be significantly improved by extracting the timing information from individual SiPMs, for example using an ASIC designed for SiPM arrays (Becker et al 2016).
The flood histograms (figure 7) and the SNR (figure 9) obtained using the SensL and KETEK SiPMs are clearly worse than those obtained using the Hamamatsu SiPMs, mainly caused by the difference in the PDE, with higher PDE corresponding to SiPMs with larger microcell size. The KETEK SiPM has the smallest microcells (table 1), hence, its PDE is the lowest among the four tested SiPMs. However, SiPMs with smaller microcells will have better energy linearity.
In conclusion, the continuous development, evolution, and refinement of SiPMs over the past decade has resulted in high-performance SiPM arrays from several vendors, all of which work well in this application. There are minor differences in performance and sensitivity to operating parameters (bias voltage and temperature), which together with cost, robustness and reliability, ultimately will guide selection for high-resolution PET scanner projects.
Acknowledgments
The authors wish to thank SensL (now part of ON Semiconductor), KETEK and Hamamatsu for providing the SiPM arrays used in this work. This work was funded by NIH grant R01 EB019439.