

Abstract
Small animal positron emission tomography (PET) is a well-established imaging modality in preclinical biomedical research. The performance of current small animal PET scanners is mainly limited by the detector performance and depth-encoding detectors are required to simultaneously achieve high spatial resolution and high sensitivity. In this work, the performance of a high-resolution dual-ended readout lutetium-yttrium oxyorthosilicate (LYSO) array using barium sulfate powder (BaSO4) as the inter-crystal reflector was measured for the first time and compared to that of a LYSO array using the most commonly used enhanced specular reflector (ESR). Both LYSO arrays have 18 × 18 crystals and the crystal size is about 0.62 × 0.62 × 20 mm3. The LYSO arrays are readout by two position-sensitive photomultiplier tubes (PSPMTs) from both ends. The flood histograms, energy resolution, depth of interaction (DOI) resolution and timing resolution were measured. The flood histograms of the LYSO array with BaSO4 reflector is much better than that of the LYSO array with ESR reflector. For the BaSO4 array, all crystals can be clearly resolved. For the ESR array, all crystals in one direction can be clearly resolved, but the edge 2–3 columns of the crystals in the other direction cannot be resolved. The average energy resolution of the BaSO4 and ESR arrays are 15.2% and 15.3%, respectively. The average DOI resolution of the BaSO4 array is 2.19 mm, which is 24% worse than the 1.76 mm DOI resolution of the ESR array. The timing resolution of both arrays is ~1.6 ns. The LYSO array with the new BaSO4 reflector provided an much better flood histogram in a high resolution dual-ended readout PET detectors as compared to the ESR array, and will be used to develop a small animal PET scanner that can simultaneously achieve uniform high spatial resolution, high sensitivity and low cost.
Export citation and abstract BibTeX RIS
1. Introduction
Positron emission tomography (PET) is a well-established imaging modality in modern biomedical research and clinical diagnosis. Small animal PET is one of the imaging modalities that offer considerable potential in animal models of human disease research and new drug and therapy development. The two most important properties of a small animal PET scanner are the spatial resolution and sensitivity. Spatial resolution determines the capability of a PET scanner in resolving the nearby high contrast lesions. It also limits the quantitative accuracy of a PET study through the partial volume effect. William W. Moses analyzed the different factors that determine the spatial resolution and gave the following formula for calculating the spatial resolution of a PET scanner (Moses 2011):

where kr is a multiplicative factor from reconstruction algorithm, d is the crystal width, s is the positron range, b is the crystal decoding error factor, R is the detector ring radius and EDOI is the error caused by the depth of interaction (DOI) effect. Currently the spatial resolution of small animal PET scanners is mainly limited by detector performance through the crystal width and DOI effect. The sensitivity of a PET scanner is defined by the ratio of the number of coincidently detected 511 keV γ-ray pair to the number of radioisotopes decayed through positron emission. It also limits the quantitative precision of a PET study through the signal to noise ratio, which is related to the number of detected events. For PET scanner with better spatial resolution, a higher sensitivity is required to achieve the same signal to noise ratio of image. Clearly, PET scanner designs that improve both spatial resolution and sensitivity lead to a better imaging performance.
DOI effect is the biggest limitation for the small animal PET scanners to simultaneously achieve high sensitivity and uniform high spatial resolution. Long crystals, small detector ring radius and long axial field of view are preferred to increase the sensitivity of a small animal PET scanner, but meanwhile the spatial resolution of the scanner deteriorates since the DOI effect increases. For this reason, much attention has been focused on developing depth-encoding PET detectors in recent years. Many depth encoding techniques have been invented. Those techniques include multi-layer detectors consisting of crystal layers with different scintillation light decay times (Seidel et al 1999, Eriksson et al 2002, Inadama et al 2006, Chang et al 2017), with different reflector arrangements (Tsuda et al 2004, Orita et al 2005, Son et al 2017), and using a position shift of half a crystal for different layers (Zhang et al 2003), with different light sharing at photo-sensors (Uchida et al 2016), dual-ended readout of scintillator arrays (Shao et al 2002, Burr et al 2004, Dokhale et al 2004, Wang et al 2004, Yang et al 2006), measuring charge collection time differences at the cathode and the anode for semiconductor detectors (Wulf et al 2003, Vetter et al 2004), and measuring light distribution with a multi-channel photomultiplier tube or SiPM array for a continuous crystal scintillator detector (Lerche et al 2005, Ling et al 2007, Morrocchi et al 2016). Dedicated small animal PET scanners have now been developed that utilize some form of depth-encoding detectors (Wang et al 2006, Gonzalez et al 2016, Yang et al 2016). With high DOI resolution detectors a PET scanner can be built with a smaller ring diameter and longer crystals to achieve high sensitivity, uniform high spatial resolution and low cost simultaneously.
Depth encoding PET detectors with dual-ended readout of pixelated scintillator array approach provided high spatial resolution and high DOI resolution at the cost of using two photodetectors for one detector module. In previous work, to develop high resolution position-sensitive avalanche photodiode based dual-ended readout PET detectors, enhanced specular reflector (ESR) and Toray white paper were used as inter-crystal reflector (James et al 2009, Yang et al 2011). The results showed that for the ESR arrays, edge crystals in one direction could not be resolved when the crystal size is less than 0.7 mm. For the Toray arrays, all crystals can be clearly resolved when polished crystal surface was used, but the energy resolution of the Toray arrays is much worse than that of ESR arrays. The energy resolution is difficult to be obtained from the energy spectrum (Yang et al 2011).
Barium sulfate powder (BaSO4) is another inter-crystal reflector less commonly used in scintillator arrays of PET detectors. Yttrium lutetium oxyorthosilicate (LYSO) arrays using BaSO4 reflector had been tested in several single-ended readout PET detectors (Yamamoto et al 2013, 2016, Amaral et al 2007), but their performance had not been compared to LYSO arrays using ESR reflector under the same experimental conditions. In this work, a high resolution and high efficiency LYSO array was made by using BaSO4 reflector. Its performance in a dual-ended readout depth encoding PET detector was measured for the first time and compared to that of a LYSO array of the same crystal size and using the most commonly used ESR reflector.
2. Materials and methods
2.1. LYSO array
The detailed information of both LYSO arrays measured in this work is shown in table 1. The photographs of the two LYSO arrays are shown in figure 1. The two arrays were made by Sanho Ostor Electronics Corp., Beijing, China. The flow charts of the fabrication process of the two types of LYSO arrays are shown in figure 2. Both arrays have 18 × 18 crystals with a crystal size of 0.62 × 0.62 × 20 mm3. All crystal surfaces of the LYSO array using BaSO4 reflector are polished. The BaSO4 reflector is a kind of white powder diffuse reflector and is less commonly used in PET detectors. The thickness of the BaSO4 reflector is ~80 µm. The outside of the BaSO4 array is wrapped with one layer of ESR. The four rectangle crystal surfaces of the ESR array are unpolished (leave as saw cut). Both ends of the ESR array coupling to the photodetector are polished. The ESR reflector is a 65 µm thin multilayer polymer film reflector that is 98.5% reflective over the entire visible spectrum, regardless of the angles of the incidence (3M, St. Paul, MN). The ESR array is a specular reflector and is the most commonly used reflector in PET detectors. The thickness of the ESR reflector plus the thickness of the glue on both sides of the ESR reflector is also ~80 µm.
Table 1. Detailed information of the two LYSO arrays measured in this work (BaSO4 is a diffuse reflector and ESR is a specular reflector).
| Array # | Crystal element | Crystal size (mm3) | Surface | Reflector | Block size (mm3) |
|---|---|---|---|---|---|
| 1 | 18 × 18 | 0.62 × 0.62 × 20 | Polished | BaSO4 | 12.6 × 12.6 × 20 |
| 2 | 18 × 18 | 0.62 × 0.62 × 20 | Unpolished | ESR | 12.6 × 12.6 × 20 |
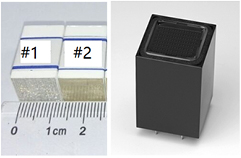
Figure 1. Photographs of the LYSO arrays (left) and PSPMT (right).
Download figure:
Standard image High-resolution image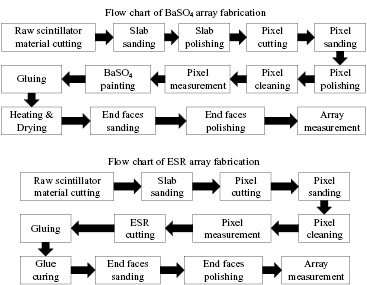
Figure 2. Flow charts of the two types of LYSO array fabrication process.
Download figure:
Standard image High-resolution image2.2. Photodetector
The main purpose of this work is to compare the performance of two LYSO arrays with different reflectors to find a better LYSO array, so the well-tested Hamamatsu H7546B position-sensitive photomultiplier tubes (PSPMTs, Hamamatsu Photonics, Japan) were used as photodetectors in this work. Figure 1 (right) shows the photograph of a PSPMT. The H7546B PSPMT is a multi-anode PMT with 8 × 8 multi-anodes. The active area of each anode is 2 × 2 mm2 and the space between the anodes is 0.3 mm. The effective area of the whole PSPMT is 18.1 × 18.1 mm2. The PSPMT is read out by a resistant network circuit board and a signal summing board to obtain four position-encoding energy signals (Tai et al 2003). Another photodetector used in this work is Hamamatsu R9800 single channel PMT (Hamamatsu Photonics, Japan). The R9800 PMT was used together with a 1 mm LYSO slab detector to provide electric collimation for the DOI resolution measurements and a reference time for the timing resolution measurements.
2.3. The measurements
The experimental setup used for flood histograms, energy resolution, DOI resolution and timing resolution measurements is shown in figure 3. The experimental setup were placed in a big light tight box for light shielding. The LYSO arrays were read out from both ends by two PSPMTs coupled to the arrays with XIAMETER PMX-200 silicone oil (Dow Corning Corp., USA). The index of refraction of the silicone oil is 1.40. The two LYSO arrays were measured in both singles and coincidence modes. In singles mode, the entire LYSO array was uniformly radiated by a 22Na point source from one side. In coincidence mode, a specific depth of the LYSO array was selectively irradiated by electric collimation. The 1.0 mm thick coincidence LYSO slab detector and the 0.3 mm diameter 22Na point source with an activity of 840 kBq were mounted on a translation table. The distances from the point source to the front of both detectors are 26 mm. For the two LYSO arrays, five depths of 2 mm, 6 mm, 10 mm, 14 mm and 18 mm from one PSPMT were measured. The schematics of the electronics system used for the coincidence measurement is shown in figure 4. The 8 position-encoding energy signals of the two PSPMTs were digitized and stored as list mode data by using a data acquisition system described in details in reference (Judenhofer et al 2005). The timing resolution at the five depths was also measured. The timing difference of the two constant fraction discriminator outputs was measured by a time to analogue converter module and then was digitized and stored in the list mode data together with the 8 energy signals.
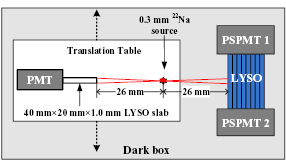
Figure 3. Experimental setup for flood histogram, energy resolution and DOI resolution measurements.
Download figure:
Standard image High-resolution image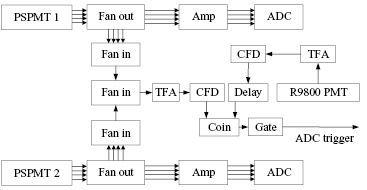
Figure 4. Electronics schematics for DOI resolution measurement. Amp: spectroscopy amplifier, Fan in: linear fan in, Fan out: linear fan out, TFA: timing filter amplifier, CFD: constant fraction discriminator, Coin: logic coincidence, Gate: gate generator, ADC: analogue to digital converter.
Download figure:
Standard image High-resolution image2.4. Data analysis
The energies (E1 and E2) of the two PSPMTs are calculated by the following equations:

where A1, B1, C1 and D1 are the four position-encoding energy signals from PSPMT1 and A2, B2, C2 and D2 are the four position-encoding energy signals from PSPMT2. For dual-ended readout detector, the total energy (E) was obtained by summing the energies of two PSPMTs:

The x and y coordinates of the flood histograms of the detector measured by each PSPMT and both PSPMTs were calculated by the following equations (Tai et al 2003):


The DOI information of the detector was calculated by using the following equation:

The timing spectra at the five depths were obtained by measuring the timing difference between the slab detector and the dual-ended readout detector module.
To analyze the data, first a preliminary flood histogram of two PSPMTs was calculated by using all the events acquired in singles mode. A crystal look up table (LUT) was created by using the flood histogram. The data was re-analyzed by applying the crystal LUT to obtain the energy spectra of individual crystals. The photopeak of the energy spectra were fitted by using a Gaussian function to obtain the full width at half maximum (FWHM) energy resolution and 511 keV photopeak amplitude. Finally, the data was analyzed again by applying the crystal LUT and crystal based energy threshold. The flood histograms and DOI ratio histograms with different energy windows were obtained. The flood histograms were only qualitatively compared by visual evaluation. The DOI histograms were fitted by using a Gaussian function. The FWHM DOI resolution was then converted to millimeter by using a linear fit of the peak value of the DOI histograms of all crystals measured at 2 mm and 18 mm and the known depths of irradiation. The timing spectra were fitted with a Gaussian function and the FWHMs were treated as the timing resolution.
3. Results
3.1. Flood histograms
The flood histograms of the two LYSO arrays measured in coincidence mode at depths of 2 mm, 10 mm and 18 mm by two PSPMTs using all detected events are shown in figure 5. The flood histograms of both LYSO arrays measured in singles mode with different crystal-based energy windows (all events, events with E > 350 keV and E < 350 keV) are shown in figure 6. The low energy threshold of all data in this work is 50 keV if it is not specified. The flood histograms of BaSO4 array is obviously better than that of ESR array. First in the BaSO4 array, all crystals can be clearly resolved, but in the ESR array, crystals in one direction can be resolved, but in the other direction cannot be resolved for the 2–3 column edge crystals. Second the spot size of each crystal is smaller and the separation among crystals is better for the BaSO4 array. The flood histograms of the high energy events are better than that of low energy events for both arrays because the signal to noise ratio of the high energy events is better.
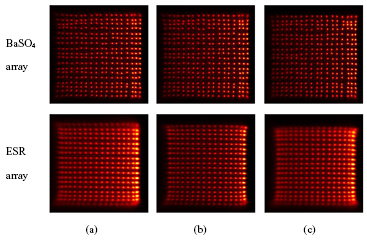
Figure 5. Flood histograms of both LYSO arrays measured in coincidence mode at depths of 2 mm, 10 mm and 18 mm from one PSPMT by dual-ended readout with PSPMTs. (a) Depth = 2 mm, (b) depth = 10 mm, (c) depth = 18 mm.
Download figure:
Standard image High-resolution image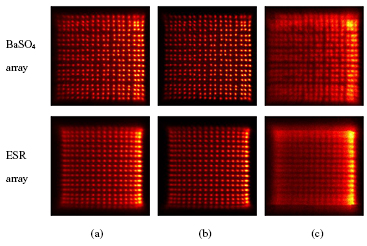
Figure 6. Flood histograms of both LYSO arrays measured in singles mode with different energy thresholds. (a) All events, (b) E > 350 keV, (c) E < 350 keV.
Download figure:
Standard image High-resolution image3.2. Energy spectra and energy resolution
The energy spectra of crystal 153 (a center crystal) and the entire array (all crystals) of both arrays measured in coincidence mode at a depth of 10 mm are shown in figure 7. Due to the variation of the 511 keV photopeak amplitudes of different crystals in an array, the width of the photopeak of the energy spectrum of the entire array is wider than that of the individual crystals. The dependence of the photopeak amplitude on depths of the energy spectra measured by PSPMT1, PSPMT2 and both PSPMTs of both arrays are shown in figure 8. The energy resolution of crystal 153 and average of all crystals of the two LYSO arrays are shown in table 2. Both E1 or E2 change with depths so that the DOI can be measured by the energy ratio. The total energy E only slightly changes with depths. No correction of the depth dependence of the energy is required for those dual-ended readout detectors. The average energy resolution of the new BaSO4 array is 15.2%, which is about the same as the 15.3% energy resolution of the ESR array. Figures 7 and 8 also showed that the light output of the BaSO4 array is about 20% higher than that of the ESR array. The main reason is that ESR is a specular reflector, more of the light photons were trapped inside the crystals due to the total reflection.

Figure 7. Energy spectra of crystal 153 and all crystals of both arrays measured at depth of 10 mm. (a) Crystal 153 and (b) all crystals for BaSO4 array, (c) crystal 153 and (d) all crystals for ESR array.
Download figure:
Standard image High-resolution image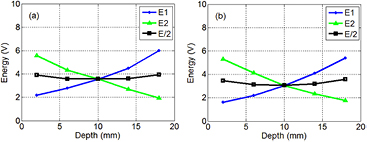
Figure 8. 511 keV photopeak amplitude of the energy spectra measured by PSPMT1, PSPMT2 and 2 PSPMTs at different depths for BaSO4 array (a) and ESR array (b).
Download figure:
Standard image High-resolution imageTable 2. Energy resolution (%) measurement results at depth of 10 mm.
| Array | BaSO4 | ESR |
|---|---|---|
| Crystal 153 | 14.6 | 12.5 |
| Average | 15.2 ± 2.1 | 15.3 ± 3.8 |
3.3. DOI resolution
The DOI histograms of crystal 153 for all events and events with E > 350 keV and E < 350 keV, and all crystals for all events for both arrays are shown in figures 9 and 10. The DOI resolution results of the two LYSO arrays are shown in table 3. In this table, the DOI resolution using 'detector calibration' is obtained from the DOI histograms of all crystals and the DOI resolution using 'crystal calibration' is obtained from the DOI histograms of the individual crystals and the results are the average of all crystals. The DOI resolution with the crystal calibration is better than that of the detector calibration since the DOI ratio varies among crystals at a specific depth, especially among edge and central crystals. For a PET scanner using those detectors, detector calibration is simpler, but can only provide worse DOI resolution. Crystal calibration is more complicated, but can provide better DOI resolution. The DOI resolution of the high energy events is better than that of the low energy events since the signal to noise ratio of the high energy events is big. The BaSO4 array provided a DOI resolution of 2.19 mm for photopeak events if crystal calibration is used. The 1.76 mm DOI resolution of the ESR array is 24% better than that of the BaSO4 array. The radiation beam width of ~1.0 mm was not subtracted from all the DOI resolution results.
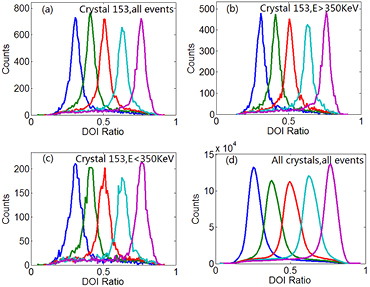
Figure 9. DOI histograms of crystal 153 and all crystals for the BaSO4 array. (a) Crystal 153 with all events, (b) crystal 153 with E > 350 KeV, (c) crystal 153 with E < 350 KeV, (d) all crystals with all events.
Download figure:
Standard image High-resolution image
Figure 10. DOI histograms of crystal 153 and all crystals for the ESR array. (a) Crystal 153 with all events, (b) crystal 153 with E > 350 KeV, (c) crystal 153 with E < 350 KeV, (d) all crystals with all events.
Download figure:
Standard image High-resolution imageTable 3. DOI resolution (mm) measurement results. The DOI resolution using 'detector calibration' is from DOI histograms of all crystals. The DOI resolution using 'crystal calibration' is from the DOI histograms of individual crystals and the results are the average of all crystals.
| Array | BaSO4 array | ESR array | ||
|---|---|---|---|---|
| Detector calibration | Crystal calibration | Detector calibration | Crystal calibration | |
| All events | 3.60 | 2.43 ± 0.20 | 3.16 | 1.94 ± 0.15 |
| E > 350 keV | 3.36 | 2.19 ± 0.21 | 2.75 | 1.76 ± 0.13 |
| E < 350 keV | 3.81 | 2.89 ± 0.30 | 3.55 | 2.39 ± 0.19 |
3.4. Timing resolution
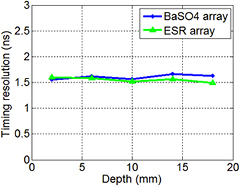
The timing resolution of both arrays measured at five depths for events of E > 350 keV is shown in figure 11. The timing resolution is almost constant for different depths and similar for both arrays. A timing resolution of ~1.6 ns was obtained. The timing resolution was measured by using a dual-ended readout detector module and a detector consisting of a LYSO slab coupled to a single PMT. The contribution to the timing resolution from the slab detector is much smaller than that of the dual-ended readout detector. The timing resolution will be worse than 1.6 ns if two dual-ended readout detectors are used.
Figure 11. Timing resolution of both LYSO arrays measured at five depths of 2, 6, 10, 14, 18 mm for events with E > 350 keV. The reference detector is a LYSO slab detector read out by a Hamamatsu R9800 PMT.
Download figure:
Standard image High-resolution image
4. Discussion and conclusion
A high resolution dual-ended readout depth-encoding LYSO array with crystal size of 0.62 mm was made by using BaSO4 as the inter-crystal reflector. Its performance was measured and compared with that of a LYSO array of the same crystal size and using the most commonly used ESR reflector. The flood histograms of BaSO4 array is much better than that of the ESR array. All crystals in the BaSO4 array can be clearly resolved. For the ESR array, 2–3 column of the edge crystals in one direction cannot be resolved. One reason is that the light output of the BaSO4 array is 20% higher than that of the ESR array. The second reason is that the ESR reflector in one direction is incomplete, which leads to more light crosstalk and deteriorates the flood histogram in that direction. The average energy resolution of the new BaSO4 array is 15.2%, which is similar to the 15.3% energy resolution of the ESR array. The DOI resolution of the new BaSO4 array is 2.19 mm for events with E > 350 keV if crystal calibration is used, which is 24% worse than the 1.76 mm DOI resolution of the ESR array. The 2.19 mm DOI resolution is better than the DOI resolution of other depth encoding PET detector approaches such as multilayer crystals and monolithic crystals. The DOI resolution from DOI histograms of individual crystals is much better than that from the DOI histograms of the whole detector since the DOI ratio varies among crystals in an array, especially among edge and central crystals. The flood histograms and DOI resolution of the high energy events are better than that of low energy events for both arrays because the signal to noise ratio of the high energy events is bigger. The timing resolution of the new BaSO4 array is similar to that of the ESR array. It is unclear why the 20% more light output does not lead to a higher energy and timing resolution. The main focus of this work is to compare the performance of two different types of LYSO arrays. The PSPMTs that are not suitable for dual-ended readout PET detector due to their bulky size were used in this work as the photodetectors. In the future silicon photomultiplier will be used to replace PSPMTs when the detector modules are used to build small animal PET scanner.
In conclusion, a LYSO array with a new BaSO4 reflector provided a much better flood histogram in a high resolution dual-ended readout PET detector as compared to the most commonly used ESR array and all crystals can be clearly resolved. It provided a 15.2% energy resolution, 2.19 mm DOI resolution and 1.6 ns timing resolution. The new LYSO array can be used together with the silicon photomultiplier photon detectors to build a small animal PET scanner which can simultaneously achieve high sensitivity, uniform high spatial resolution and low cost.
Acknowledgments
This work is supported by the National Natural Science Foundation of China (81527804, 11575285), the Natural Science Foundation of Guangdong Province of China (2014A030312006) and the Basic Research Program of Shenzhen of China (JCYJ20150630114942310, JCYJ20160608153434110).