

Abstract
The formation of compressible porous sponge electrodes is appealing to overcome diffusion limitations in porous electrodes for applications including electrochemical energy storage, electrochemical water desalination, and electrocatalysis. Previous work has employed wet chemical synthesis to deliver conductive materials into porous polymer sponge supports, but these approaches struggle to produce functional electrodes due to (1) poor electrical connectivity of the conductive network and (2) mechanical rigidity of the foam after coating. In this work we employ oxidative molecular layer deposition (oMLD) via sequential gas-phase exposures of 3,4 ethylenedioxythiophene (EDOT) and molybdenum pentachloride (MoCl5) oxidant to imbibe polyurethane (PU) sponges with electrically-conductive and redox-active poly(3,4 ethylenedioxythiophene) (PEDOT) coatings. We analyze the oMLD deposition on compressive PU sponges and modify the reaction conditions to obtain mechanically compressible and electrically conductive sponge electrodes. We specifically identify the importance MoCl5 dose time to enhance the conductivity of the sponges and the importance of EDOT purge time to preserve the mechanical properties of the sponges. Controlling these variables produces an electrically conductive PEDOT network within the sponge support with reduced impact on the sponge's mechanical properties, offering advantages over wet-chemical synthesis approaches. The compressible, conductive sponges we generate have the potential to be used as compressible electrodes for water desalination, energy storage, and electrocatalysis.
Export citation and abstract BibTeX RIS
1. Introduction
Porous electrodes are ubiquitous in electrochemical technologies including energy storage, water desalination, and electrocatalysis. Porous electrodes may be formed out of one material or as a composite of two or more materials to provide additional functionality (e.g. photosensitivity, redox activity, catalytic activity, etc). Examples of porous electrodes formed from one material include porous carbon electrodes [1–3] or metal foams [4, 5] that are used in supercapacitors [6, 7] and capacitive deionization [8–10]. Examples of porous composite electrodes include Li-ion battery cathodes [11, 12] battery deionization electrodes [13–15] redox flow battery electrodes [16], and electrodes for electrocatalysis [17–19]. The rationale for employing porous composite electrodes typically arises from a desire to increase the interfacial surface area between an active solid phase and the electrolyte, where electrodes with higher porosity and smaller pore diameters maximize the interfacial contact area with the electrolyte. For example, in catalysis, porous electrodes decorated with small catalyst particles maximize the surface area of catalyst exposed to the electrolyte to increase catalyst activity. Similarly, in Li-ion battery or battery deionization electrodes, higher electrode porosity and smaller pore diameters increase the surface area of active material exposed to the liquid electrolyte, providing an interconnected network of liquid-phase electrolyte to deliver ions to/from redox-active domains.
However, although higher electrode porosities and smaller pore diameters are employed to provide greater interfacial contact area with the electrolyte phase, these factors also necessarily increase the length scales for liquid phase diffusion for the same electrode mass. By way of example, we estimate the relative impact of these parameters on the diffusion length scales in a simple model porous electrode geometry in the Supporting Information (SI). We find that an increase from 40% to 60% porosity at a constant electrode mass and top–down cross-sectional area leads to a 50% thicker electrode (SI section A). Similarly, reducing the pore diameter by a factor of two at constant electrode mass and porosity leads to a four-fold increase in the total path length of pores within the electrode volume (SI section B). We find that increasing porosity and decreasing pore diameter both lead to larger fractional increases in these diffusion length scales (electrode thickness and total pore path length) than the corresponding fractional increases in the surface area in contact with the electrolyte phase (SI section C). The qualitative impact of these variables in a simple model system motivates the need to consider diffusion limitations in electrode design.
In addition to higher porosities and smaller pore diameters leading to increasing diffusion path lengths within pores, nanoscale pore geometries also introduce confinement effects that influence electrode charging physics [20–22]. Nanoscale confinement in electrode pores of <100 nm in diameter leads to electric-double-layer overlap and alters molecular transport, electron transfer, solvent dielectric properties, and adsorption behavior [20–22]. These effects can further limit the energy efficiency of electrochemical processes. Electrode porosity therefore presents a conundrum for electrode design—to increase the surface area of the electrode, higher porosities and smaller pore diameters are desired; however, these higher porosities and smaller pores expand the electrode volume, introduce longer length scales for diffusion, and generate unwanted nanoconfinement effects, thereby reducing the effectiveness of these electrodes. Following previous work [23, 24] we employ the potential-dependent Thiele modulus [24] in SI section D to estimate the net effect that diffusion limitations have on the efficiency of electrochemical processes. We find that for typical, composite battery cathodes [11, 12, 25, 26] and metal foam electrodes [5] >75% of the electrode volume experiences diffusion limitations that limit electrode rate capability, and that an even larger fraction of the volume of macroscale porous carbon foams [27] is restricted by diffusion. We note that a typical composite battery cathode has a porosity of ∼20%–60%, average pore dimeters of ∼200 nm, and a composite active material thickness of ∼100 μm [11, 12, 25, 26]. This is in contrast to carbon and metal foams, which have 70%–99% porosity [5, 27], average pore diameters for mesoporous carbon foams of ∼20 nm [27, 28] and up to ∼1 mm in metal foams [5], and electrode thicknesses of 2–20 mm [5, 27].
To address the diffusion limitations outlined above that are inherent to porous electrodes, it is appealing to consider mechanically compressible porous electrodes. A compressible electrode with a high porosity and larger pore diameters provides open channels that prevent negative effects from nanoscale confinement, and mechanical compression of the porous structure allows for convective exchange of ions or other species from the surrounding electrolyte, eliminating diffusion limitations. Previous work has generated compressible carbon sponge electrodes using freeze drying [29], supercritical drying [30], chemical vapor deposition (CVD) [31, 32] and 3D printing [33]. These carbon foams can then be modified post-synthesis by decorating or coating with additional functional material to enhance redox activity [34–36]. However, current methods for carbon foam synthesis provide limited control over the porosity and pore size distribution of these foams. Another approach has been to employ commercially available polymer foams and deliver electrically conductive coatings, for example via solution casting [37–42]. However, previous methods of delivering conductive coatings provided poor control over the thickness and uniformity of the coatings onto the sponge supports, requiring thicker polymer coatings to achieve electrical connectivity, and thereby limiting the mechanical compressibility of these conductive foams. In the present work, we aim to establish a synthesis approach to form a composite polymer foam electrode using commercially available polyurethane (PU) foam supports coated with uniform and conformal electrically conductive and redox-active polymer coatings. Here, our goal is to establish a synthesis platform to independently control the foam porosity/pore volume and the thickness of the redox-active coatings of compressible electrodes. This work builds off prior work using vapor phase infiltration (VPI) to modify polymer foams with inorganic coatings deposited by sequential gas-phase exposures of organometallic precursors and water in a scheme similar to atomic layer deposition (ALD) [43–46]. Here, instead of inorganic coating chemistries used previously, we deliver electrically conductive polymer coatings. We employ oxidative molecular layer deposition (oMLD) of poly(3,4 ethylenedioxythiophene) (PEDOT) using sequential gas-phase precursor exposures of 3,4 ethylenedioxythiophene (EDOT) and molybdenum pentachloride (MoCl5) [47, 48]. PEDOT formed by oMLD has been found in prior work to exhibit electrical conductivities in excess of 6000 S cm−1 [49], and electrochemical charge storage capacities in excess of up to 120 mAh g−1 [50].
2. Experimental methods
Oxidative molecular layer deposition (oMLD) was performed using a custom hot-walled viscous flow reactor described previously [51, 52]. Open-cell 1'' cube PU sponges with a density of 1.6 lb/ft3 (McMaster-Carr) were used as sponge substrates. Deposition of PEDOT thin films by oMLD was accomplished based on previously established growth conditions [48, 53]. Using PID temperature controllers, the temperature of the oMLD reactor chamber was fixed at 150 °C. Ultra-high purity argon carrier gas (Ar, Airgas) flowed continuously into the reactor chamber at a total flow rate of 250 SCCM and pressure of 0.85 Torr. Molybdenum pentachloride (MoCl5, 99.6%, Fischer Scientific) and Ethylenedioxythiophene (EDOT, 98%, 1PlusChem) used for PEDOT oMLD growth were both kept at a fixed temperature of 100 °C using jacketed flow-over precursor bubblers with PID temperature control. The precursors were used as-received and were transferred into the precursor delivery bubblers in an argon-filled glovebox. Under these growth conditions, a peak dose pressure of ∼100 mTorr higher than base pressure was observed for EDOT. The sample tray was passivated with the oMLD PEDOT chemistry before deposition on PU Sponges. Si wafers (Silicon Valley Microelectronics) were placed on either side (both upsteam and downstream) of each sponge on the tray during oMLD growth. One oMLD cycle consisted of (A) a MoCl5 dose, (B) carrier gas purge, (C) EDOT dose, and (D) carrier gas purge. As described below, the timing of precursor and purge steps were adjusted to optimize growth onto the PU sponge substrates.
Mechanical compression testing of PU sponges was performed with a motorized test stand (ESM303-Mark-10) equipped with a force gauge (M5-100, Series 5 Advanced Digital Force Gauge, 100 lbF). Graphite rods of 1'' diameter were connected to (a) the base of the test stand and (b) the force gauge attached to the motorized stage. These graphite rods were connected to the housing using plastic fittings to electrically isolate the graphite rods and allow for electrical characterization during mechanical compression/decompression. All mechanical compression was performed at a constant strain rate of 0.1 in min−1. PU sponges were compressed up to 0.5'' (50% strain). To acquire the values of load versus strain the MESURgauge Plus software by Mark-10 was used. Electrical resistance data was measured simultaneously using a potentiostat, as described below.
Electrical impedance spectroscopy (EIS) was performed on sponges to measure the electrical impedance (Z) of the sponge as a function of AC frequency (f) using a Biologic SP-150 potentiostat. These measurements were performed in two modes of operation.
In the first mode of measurement, the electrical impedance across the PEDOT-coated PU sponges was measured during mechanical testing using electrical contacts on two ends of the fully intact sponge (see above). For this, the graphite rods used for mechanical compression testing were electrically connected to a potentiostat using a copper wire attached to a stainless steel set-screw in contact with each graphite rod. EIS experiments were performed over a frequency range of 500 mHz to 1 MHz at an amplitude of 10 mV. The x intercept of Nyquist admittance plots at low frequency (100 Hz) from these measurements was used to report real impedance below.
In the second mode of measurement, sponges were cut in half and electrical contact was made at two points on the inner surface of one half of the sponge within the approximate center of the original PU sponge cube, such that the EIS measurements could be used as a metric for the connectivity of the PEDOT coating throughout the bulk of the sponge. For this mode of measurement, two Keven probe micropositioners equipped with 125 μm diameter beryllium copper alloy probe tips were positioned at either (a) the center and one edge, or (b) opposite edges of the internal surface of the coated PU sponges, and the electrical impedance behavior was compared between these two configurations.
Raman spectroscopy was conducted with a Renishaw in Via Raman spectrometer with 633 nm excitation laser. Data was collected over 600–3000 cm–1 with a sweeping scan rate of 10 cm–1 s−1 and a laser power of 10.1 mW. Due to difficulties in acquiring Raman data on the microporous PU sponges arising from diffuse scattering, 1/16'' thick solid nonporous sheets of 95A durometer PU (McMaster Carr) were used as surrogates for the solid fibers of the PU sponge to assess how MoCl5 impacts the chemical structure of PU. PU sheets were analyzed by Raman spectroscopy before and after exposure to gas phase MoCl5 at 150 °C.
X-ray photoelectron spectroscopy (XPS) was also performed on 1/16'' thick solid PU sheets before and after exposure to gas phase MoCl5 at 150 °C. XPS data was acquired using a Thermo Scientific Nexsa instrument with a monochromatic Al x-ray source. Survey scans employed a 400 μm diameter x-ray beam using constant analyzer energies of 200 eV, respectively. All peaks were charge corrected by shifting the C 1s peak of all spectrums at an energy of 284.8 eV.
Spectroscopic ellipsometry was used to assess PEDOT film thickness on Si wafer samples using a J.A. Wollam Alpha-SE ellipsometer at wavelengths of between 380 and 890 nm at an incident angle 65°. SE data analysis and modeling were performed using the CompleteEASE software package. PEDOT films were fit using three Lorentz oscillators [54–56] centered at 0.049, 3.1, and 4.2 eV. Here, Lorentz oscillators were used instead of the Cauchy model described previously for oMLD PEDOT [50] due to the shorter purge times (vide infra) which evidently produced PEDOT at a different state of charge compared to this prior work.
Scanning electron microscopy (SEM) was carried out using an FEI Quanta 600F operated in high vacuum at an accelerating voltage of 10 kV. Each sponge to be imaged by SEM was cut in half and SEM images were acquired from the inner surface of one half of the sponge, such that the SEM images represent the approximate center of the original PU sponge cube. Wide field images were collected at 35× (HFW = 3.66 mm), and individual fibers imaged at 500× (HFW = 256 μm). Energy dispersive x-ray spectroscopy (EDS) mapping was performed at 10 kV.
3. Results and discussion
3.1. Effect of MoCl5 dose time on electrical properties
The foundational hypothesis motivating our effort here to employ oMLD to deliver PEDOT coatings on PU sponges is that the sequential self-limiting precursor exposures used in oMLD will allow for the formation of a uniform and contiguous network of electrically conducting PEDOT within PU sponges. We expect that this will enhance electrical conductivity relative to wet-chemical methods for delivering PEDOT onto PU foams. As an initial test, we coated PU sponges with 150 oMLD cycles of PEDOT using 10 s EDOT dose time, 100 s MoCl5 dose time, and 100 s Ar purge after each precursor dose. These growth conditions were established in previous work and found to provide saturating doses on flat substrates [48]. After forming the PEDOT-coated PU sponge using oMLD, we employed EIS to measure the electrical impedance (Z) of the sponge as a function of AC frequency (f), as depicted in figure 1. These measurements were performed under ∼10% strain using 1'' diameter graphite rod contacts as described in the experimental methods section.
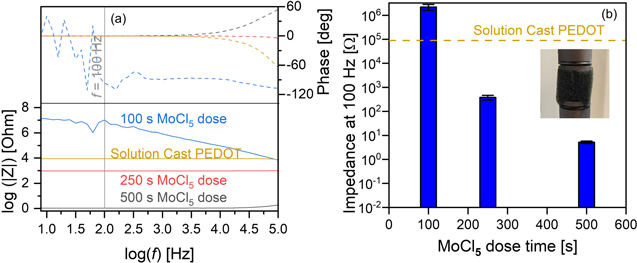
Figure 1. Electrical impedance of PU foams coated using 150 oMLD cycles of MoCl5/EDOT at 150 °C using MoCl5 dose times of 100, 250, and 500 s, compared with solution cast PEDOT coatings, including (a) Bode plot indicating resistive behavior at f < 100 Hz and (b) impedance of each sample from (a) as measured at f = 100 Hz.
Download figure:
Standard image High-resolution imageThe Bode plot of the EIS data in figure 1(a) for the 100 s MoCl5 dose time condition in figure 1(a) indicates a high impedance of Z > 106 Ω at low f ≤ 100 Hz. We expect that this high electrical impedance arises because MoCl5 precursor delivery is insufficient to saturate the full surface area of the PU sponge. The MoCl5 vapor pressure is <10 mTorr, requiring a ≥100 s dose time for complete saturation on flat substrates [48]. By increasing the MoCl5 exposure using 250 s and 500 s MoCl5 dose times, we observe a decrease in Z to 103 Ω and <10 Ω, respectively, at low f ≤ 100 Hz, confirming that an increased MoCl5 dose time provides a more complete PEDOT coating within the PU foam substrate. We note that ideal resistive behavior (phase equals zero) is observed for f < 103 Hz for the solution cast PEDOT, and 250 and 500 s MoCl5 dose time conditions, and the total impedance plateaus to a constant value for f ≤ 100. As such, we employed a frequency of 100 Hz for further electrical impedance characterization below, unless otherwise noted.
In figure 1(b), we compare the electrical impedance as measured at f = 100 Hz for each of the three samples in figure 1(a) relative to a PU sponge coated using solution cast PEDOT. Here, the solution casting of PEDOT onto the PU sponge was performed by mixing EDOT monomers and the MoCl5 oxidant in an ethanol solution containing a PU sponge following procedures described previously [57]. Despite the solution-cast PEDOT forming a visible amount of excess PEDOT on the PU sponge, the electrical impedance we measured for this coating approach was still high at 8.9 × 10⁴ Ω. By contrast, the 500 s MoCl5 dose condition yielded an electrical impedance of 5.2 Ω when measured under the same conditions. The 500 s MoCl5 dose condition produced a resistance 1.7 × 10⁴ times smaller than using solution casting. This provided an initial positive indication that improving the conformality and uniformity of PEDOT coatings using oMLD could enhance the electrical conductivity of the PU sponges beyond solution casting and may provide a pathway for us to generate porous, electrically conductive electrodes with controlled microstructure.
3.2. Effect of MoCl5 dose time on mechanical properties
In a next step, we set out to confirm that the mechanical properties of the PU were not significantly altered by the oMLD PEDOT coating. For this, we employed a mechanical compression tester to measure stress (σ) versus strain (ε) up to 50% compression (ε = 0.5) for sponges formed using the same oMLD conditions as in figure 1. Unfortunately, here we identified a significant deficiency in mechanical properties when using the 500 s MoCl5 dose time to deliver oMLD PEDOT. Presented in figures 2(a) and (b) are photographs taken during the mechanical compression of sponges coated using 100 s and 500 s MoCl5 dose times, respectively. In each panel (a) and (b) of figure 2, we depict photographs of the (i) initial sponge before compression followed by (ii)–(iv) sequential compression up to 50% strain, and then (v) a final photograph of the sponge after removing compression. The PU sponge coated using a 100 s MoCl5 dose time behaved qualitatively like an uncoated sponge—returning to its original shape after compression. By contrast, the PU sponge coated using a 500 s MoCl5 dose time crumbled under applied stress, disintegrating into a course powder after mechanical compression, as depicted in figure 2(b).v. The highest measured pressures under 50% compression were 1.52 psi and 4.72 psi in figures 2(a) and (b), respectively.
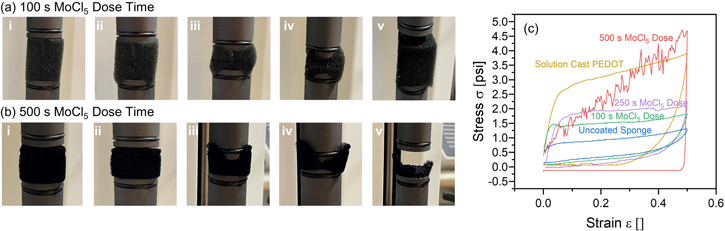
Figure 2. PEDOT-coated PU sponges formed using a (a) 100 s MoCl5 dose time during oMLD growth recover their shape after mechanical compression (i)–(iv) and release (v), however, after using a (b) 500 s MoCl5 dose time, mechanical compression (i)–(iv) disintegrates the sponge and the sponge does not recover its shape after release (v). This qualitative behavior is consistent with (c) mechanical stress–strain testing using a strain rate of 0.1 in min−1 for bare PU sponges, where a 500 s MoCl5 dose time leads to a mechanically brittle sponge, unlike the shape recovery behavior observed for bare PU sponge, solution-cast PEDOT-coated PU sponge, and oMLD PEDOT-coated PU sponges using shorter MoCl5 dose times.
Download figure:
Standard image High-resolution imageTo further quantify this mechanical compression behavior, in figure 2(c) we plot σ versus ε data collected during mechanical compression of PU sponges with PEDOT coatings delivered by oMLD using 100, 250, and 500 s MoCl5 dose times, and compare this versus mechanical compression data collected for uncoated PU sponge and PU sponge coated with PEDOT using solution casting. In these graphs, ε = 0 corresponds to the uncompressed state. As the sponge is compressed (ε increases) at a constant strain rate of 0.1 in min−1, the increase in the necessary stress required to compress the sponge is measured using a force gauge. The uncoated PU sponge reflects typical behavior for an open-cell compressible foam, where the stress initially rises as the sponge fibers undergo elastic deformation. Under sufficient stress, the fibers yield, leading to bulk collapse of the porous foam network, producing a region of relatively constant stress over a wide range of strain (e.g. from 0.1 < ε < 0.4). After reaching 50% strain, the strain is gradually removed at the same strain rate of 0.1 in min−1, and the measured stress reflects the force that the sponge delivers to the piston under decompression. Except for the PU foam coated with 500 s MoCl5 dose time, we observe qualitatively similar σ versus ε curve shapes for all of the sponges in figure 2(c), consistent with open-cell foam collapse. The PU sponges coated with oMLD PEDOT using 100 s and 250 s MoCl5 dose times exhibit average stresses of 1.52 ± 0.05 psi and 1.94 ± 0.05 psi, respectively over the range in strains from 0.1 ≤ ε ≤ 0.4, compared with 0.96 ± 0.08 psi for the uncoated sponge and 3.2 ± 0.2 psi for the PU sponge with a solution-cast PEDOT coating. Likewise, the slope in σ versus ε on onloading indicates a Young's modulus of 27 ± 1 psi and 35 ± 2 psi, for the 100 s and 250 s MoCl5 dose times, respectively, compared with 12.7 ± 0.6 psi for the uncoated sponge and 63 ± 3 psi for the PU sponge with a solution-cast PEDOT coating. By contrast, the PU sponge coated with oMLD PEDOT using a 500 s dose time exhibits a linear increase in stress on compression consistent with the disintegration of the foam fibers. After reaching the maximum strain of 0.5, this sponge exerts no force on the pistons during decompression, which is expected considering the crumbled powder remnants we observe in figure 2(b).v after compression.
We expect that PU becomes brittle under long MoCl5 because of oxidative chemical decomposition [58–60]. PU is known to degrade under oxidizing environments and elevated temperatures. Under these conditions, urethane groups oxidize to form isocyanate and aldehyde products [58]. We expect a similar pathway proceeds here, where MoCl5 oxidizes urethane groups according to R1-NH-CO2-C-R2 + MoCl5 → R1-N=C=O and O=CH-R2 + 2HCl + MoCl3, breaking down the PU chemical structure into volatile decomposition byproducts. We note that Cl2 is known to decompose PU [61], and the MoCl5 oxidant undergoes a two-step reduction of MoCl5→MoCl4→MoCl3 with oxidation potentials of 3.34 and 1.46 V versus SHE [48], both of stronger oxidation potential than Cl2 (1.36 V versus SHE). To confirm that MoCl5 is leading to decomposition of the PU chemical structure, we exposed 1/16'' thick dense PU sheets to a prolonged (1000 s) MoCl5 exposure (no EDOT dose) and performed XPS and Raman spectroscopy to measure the chemical composition before and after MoCl5 exposure. After MoCl5 exposure, we observed a macroscopically visible roughening and discoloration of the PU sheet, indicating that MoCl5 is chemically degrading PU. Using XPS and Raman spectroscopy, we expected to see a decrease in C–O and C=O groups comprising the ester-like group within the urethane based on the mechanism proposed above. Indeed, XPS results in figure 3(a) indicate a decrease in peak intensity at C 1s binding energies of ∼286 and ∼289 eV, consistent with the removal of C–O and C=O, respectively. Likewise, the Raman spectra in figure 3(b) indicate a decrease in the ester C=O feature at 1732 cm−1 after MoCl5 exposure [62–64]. We also observe a decrease in the Raman intensity at 1530 cm−1 after MoCl5 exposure, corresponding to loss of C–N and N–H groups [62–64]. We note that we observe equivalent peak intensity for C–H modes at 1300 cm−1 and 2800–3000 cm−1, and CH2 modes at 1443 cm−1 before and after MoCl5 exposure indicating that these decreases in ester and N–H do not arise from different sampling volumes [62–64]. These data support that MoCl5 oxidatively decomposes PU, leading to the mechanical brittleness we observe under high MoCl5 exposure in figure 2.
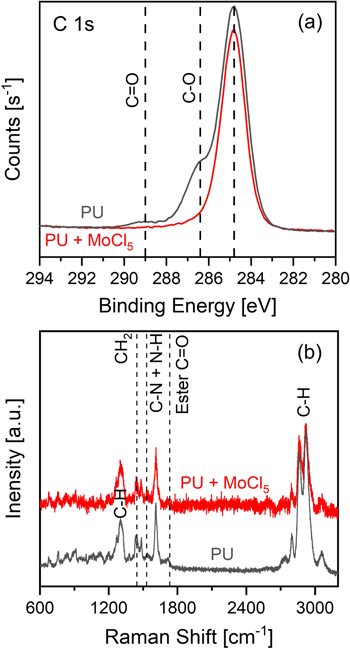
Figure 3. (a) XPS of the C 1s region and (b) Raman spectroscopy of nonporous PU sheets before and after 1000 s MoCl5 exposure at 150 °C indicating oxidative decomposition of urethane groups from MoCl5 exposure.
Download figure:
Standard image High-resolution image3.3. Effect of EDOT purge time on mechanical properties
Unfortunately, the chemical reaction of MoCl5 with PU makes it difficult to coat PU sponges with PEDOT by oMLD because MoCl5 or another strong chemical oxidant is needed to polymerize EDOT [48]. We can decrease the MoCl5 dose to limit PU degradation and preserve the PU sponge mechanical properties as indicated in figure 2, but this leads to higher electrical resistance through the sponge, as shown in figure 1. Considering these constraints, we hypothesized that decreasing the purge times following each precursor dose may overcome these challenges. Our rationale for this approach arose from previous studies examining the effect of purge time on MLD growth processes [53, 65] and the effect of purge time on ALD within polymer substrates [43–46, 66]. In general across these processes, vapor phase precursors are known to dissolve and infiltrate into bulk polymers, requiring 100 s of seconds or more of purge time to fully remove loosely bound precursors from the bulk polymer structure. Even on rigid dense substrates (e.g. Si), MLD purge times below 100 s lead to an increase in polymer growth rate, either from a similar dissolution effect into the bulk MLD film or from the formation of multilayers of monomer on the growth surface [53, 65]. Considering these known phenomena, we expect that an excess of EDOT monomer accumulates either on the surface of the PU or dissolved within the PU bulk during the EDOT dose, and that this EDOT slowly dissipates during the purge step. By decreasing the purge time after the EDOT dose, our strategy was to use this excess EDOT as a transient protective layer that would react with the MoCl5 oxidant and rapidly form a surface PEDOT layer, preventing MoCl5 from arriving at the underlying PU substrate. In other words, our goal was to intentionally perform controlled CVD to direct the polymerization to the surface of the PU fibers rather than within the PU fibers.
To evaluate whether this approach would be viable, we reduced the EDOT purge time from 100 s to 60, 30, 20, and 15 s, keeping the number of oMLD cycles constant at 30 for deposition onto PU. The mechanical properties for these PU sponges treated using different purge times during PEDOT oMLD are reported in figure 4. The mechanical testing data under compression (σ versus ε) is depicted in figure 4(a) for each of these purge conditions, compared with an uncoated PU sponge and a PU sponge coated with PEDOT using solution casting. We find that the PU sponge coated with oMLD PEDOT using a 20 s EDOT purge time exhibits a qualitatively similar σ versus ε curve, where a roughly constant value of stress is measured with increasing strain. This is consistent with bulk foam pore collapse similar to the mechanical behavior observed for uncoated PU and PU coated with PEDOT using solution casting in figure 2(a). In contrast, we find that sponges formed using 60, 30, and 15 s purge times exhibit increasing stress with increasing strain, which may indicate a gradient in mechanical properties throughout the foam. In figure 4(b) we plot the average stress (σavg) measured over the range 0.1 ≤ ε ≤ 0.4 for each of these sponges. We measure σavg = 0.96 ± 0.08 psi for uncoated PU and σavg = 3.2 ± 0.02 psi for PU coated with PEDOT using solution casting. The values of σavg fall between these bounds for all the oMLD-coated PEDOT sponges, with the highest value of σavg= 2.1 ± 0.1 psi measured for the 20 s EDOT purge time. We expect this higher value of σavg for the 20 s EDOT purge time arises from an increased PEDOT thickness on the fibers from CVD reactions (vide infra). Even for the 20 s purge condition, the value of stress to collapse the foam is 38% lower than the stress required to collapse the PU foam coated with PEDOT using solution casting. The error bars in figure 4(b) are the standard deviation in σ averaged over the range 0.1 ≤ ε ≤ 0.4, and we observe a higher variance in sponges coated using 15, 30, and 60 s EDOT purge times, consistent with the graded σ versus ε curve measured in figure 4(a) for these growth conditions.
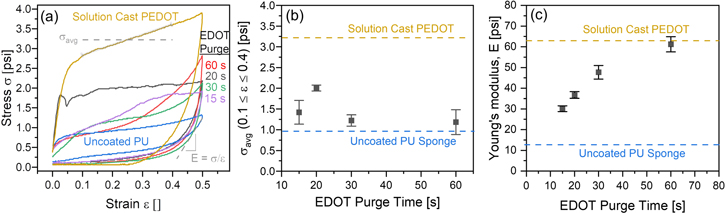
Figure 4. Effect of EDOT purge time on the mechanical properties of PEDOT-coated PU formed using 30 oMLD cycles of EDOT/MoCl5, including (a) stress versus strain during compression at a strain rate of 0.1 in min−1, (b) σavg on compression measured over 0.1 ≤ ε ≤ 0.4 from (a) versus EDOT purge time, and (c) Young's modulus on decompression from (a) versus EDOT purge time.
Download figure:
Standard image High-resolution imageIn figure 4(c) we plot the Young's modulus, E, on decompression for each of the sponges depicted in figure 4(a). We measure E = 12.7 ± 0.6 psi for uncoated PU and E = 63 ± 3 psi for PU coated with PEDOT using solution casting. The values of E fall between these bounds for all the oMLD-coated PEDOT sponges, starting at with a value of E = 30 ± 1 psi using a 15 s EDOT purge time up to a value of E = 61 ± 4 psi using a 60 s purge time. We measure a value of E = 37 ± 2 psi for the 20 s EDOT purge time condition, which is a factor of ∼3 higher than the uncoated PU. The value of error bars in figure 4(c) represent the standard error in the slope of σ versus ε on decompression from least squares linear regression. The trend in Young's modulus versus EDOT purge time in figure 4(c) is consistent with our expectations based on the reaction of MoCl5 with the PU fibers as outlined in figure 3. At higher EDOT purge times, more of the EDOT is removed from the PU fibers, and the MoCl5 readily degrades the PU, leading to increased brittleness of the fibers. As the purge time is decreased, the EDOT molecules remaining on/within the PU act as a reactive barrier preventing MoCl5 from reacting with and degrading the PU. These results confirm our hypothesis that decreasing the purge time following the EDOT dose will prevent reaction of MoCl5 with the PU fibers, making the PEDOT-coated PU foam softer.
3.4. Effect of EDOT purge time on electrical properties
As a side-effect of decreasing the EDOT purge time to prevent MoCl5 from reacting with the PU fibers, we would expect that this will also lead to an increased PEDOT film thickness due to a greater extent of vapor-phase (CVD) reaction between EDOT and MoCl5. To examine this, we measured the thickness of PEDOT formed on Si wafers placed adjacent to the foam pieces within the reactor, as well as the electrical resistance across the foam pieces under ∼10% mechanical compression, as plotted in figure 5. Indeed, we find that starting from an EDOT purge time of 120 s down to a purge time of 30 s, the PEDOT film thickness on Si increases from 19 ± 2 nm at 120 s EDOT purge time to 120 ± 20 nm at 30 s EDOT purge time. For an EDOT purge time of 20 and 15 s, the film thickness drops to 50 ± 8 and 14.0 ± 1 nm. Here the error bars in thickness represent the standard deviations measured on two Si wafers positioned upstream and downstream of the PU sponge in the oMLD reactor. We note that the EDOT and MoCl5 precursors do not only react at the surface of the PU sponge fibers, but infiltrate into the bulk PU fibers down to a depth of 8 μm (vide infra). Therefore, the thicknesses on Si wafers adjacent to the PU sponges are not a direct indication of the amount of PEDOT deposited on/into the PU sponge. We report the PEDOT thicknesses on Si wafers placed adjacent to the PU here to help describe the qualitative effect of EDOT purge time on PEDOT oMLD growth.
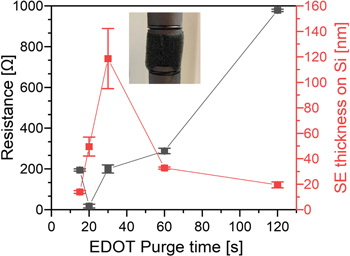
Figure 5. Effect of EDOT purge time after 30 oMLD cycles of EDOT/MoCl5 on the resistance measured on a 1'' foam cube (left axis) and the average thickness measured on two Si wafers placed upstream and downstream of the foam pieces (right axis).
Download figure:
Standard image High-resolution imageConsidering this, the high variation in film thickness upstream and downstream of the PU for the 30 s purge time may arise from either (a) a thickness gradient due to CVD-type reactions or (b) decomposition of the PU sponge, leading to outgassing of decomposition byproducts that may condense on the Si adjacent to the PU sponge. Raman spectroscopy performed on Si wafers placed both upstream and downstream of the PU sponge coated using a 30 s purge time (not shown) does not provide evidence of PU residue present on either sample, indicating that the higher thickness value downstream of the PU is related to a thickness gradient due to CVD-type reactions. We emphasize that the absence of PU Raman signal in the Si downstream of the PU sponge for the 30 s purge time does not imply that the PU did not decompose, but only that PU decomposition byproducts did not incorporate into the film that formed on the downstream Si. A longer EDOT purge time is expected to yield more PU decomposition and less CVD reaction, while a shorter EDOT purge time is expected to yield less PU decomposition and more CVD reaction. Furthermore, the higher PEDOT thickness and larger variation in thickness for the 30 s purge time versus the 20 s purge time suggests a higher vapor phase EDOT concentration after 30 s of purge than 20 s of purge. This indicates that more EDOT has escaped from the PU at the longer 30 s purge time, which is consistent with less PEDOT deposited on the PU for the 30 s purge time versus the 20 s purge time, consistent with the lowest electrical resistance measured for a 20 s purge time in figure 5.
We attribute the decrease in PEDOT thickness at a 15 s purge to the gas-phase mixing of precursors upstream of the sponge, limiting precursor delivery to the sponge. The trend in thickness versus EDOT purge time is generally consistent with the electrical properties, where the lower electrical resistance is measured on sponges where a thicker PEDOT film is observed on Si witness wafers. We interpret that the lowest electrical resistance measured using a 20 s EDOT purge arises from effectively balancing PEDOT deposition with limited PU decomposition, consistent with the largest increase in mechanical properties using a 20 s EDOT purge as reported in figure 4, where the 20 s EDOT purge yields the highest average stress during bulk foam collapse.
Taken together, the results in figures 4 and 5 suggest that a 20 s EDOT purge time is most viable for forming PEDOT films onto PU sponges using oMLD of the purge times tested—this purge time resulted in mechanical properties consistent with bulk foam collapse in figure 4(a), the lowest electrical resistance in figure 5, and moderate increases in the average stress and Young's Modulus values of ∼2 times and ∼3 times higher, respectively, than uncoated PU foam in figures 4(b) and (c). However, to be viable in generating porous electrodes, the oMLD PEDOT coatings must uniformly coat the PU sponge through to the center of each foam piece.
3.5. Effect of oMLD cycles on PEDOT uniformity and PU properties
To examine the depth to which PEDOT was formed within the PU foams, we sliced each foam piece in half and employed Kelvin-probe micropositioners to measure the electrical resistance from the center of the sponge to the outside edge (figures 6(a), (b)) versus from one outside edge to the opposite outside edge (figures 6(c), (d)). We plot the resistance measured using each of these configurations as a function of the number of EDOT/MoCl5 oMLD cycles in figure 6(e). For these, and all further experiments below, we employed the optimized growth conditions of a 20 s EDOT dose, 20 s EDOT purge, 500 s MoCl5 dose, and 20 s MoCl5 purge based on the data in figures 1, 4, and 5, and we varied the number of oMLD cycles from 10 to 100. The center-to-edge and edge-to-edge resistance values measured for 1'' foams formed using each of these conditions are plotted in figure 6.
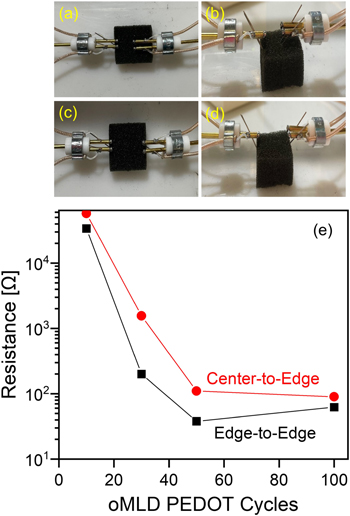
Figure 6. 1'' PU foams coated with oMLD-PEDOT were sliced in half and micropositioner Kelvin probes were placed in center-to-edge configurations as shown from the top (a) and side (b), as well as in edge-to-edge configurations as shown from the top (c) and side (d), and the electrical resistance was measured in each of these configurations (e) for different numbers of oMLD PEDOT cycles.
Download figure:
Standard image High-resolution imageHere, as we increase the number of oMLD cycles from 10 to 50, we observe a decrease in the electrical resistance by ∼3 orders of magnitude for both the center-to-edge and edge-to-edge measurement conditions. We attribute this decrease in resistance to an increase in PEDOT thickness/loading with an increasing number of cycles. A greater amount of PEDOT material will increase the electrically conductive network throughout the PU fibers, and thereby reduce the electrical resistance of the sponge. We observe roughly the same electrical resistance for both 50 and 100 oMLD cycles, suggesting that additional material provides diminishing returns in electrical connectivity after ∼50 oMLD cycles. This may arise in part from residual oxidation of the PU as described in figure 3 as the number of oMLD cycles increases (i.e. higher total MoCl5 exposure). To first order, one would expect that the electrical resistance for center-to-edge would be ∼1/2 of the electrical resistance for edge-to-edge, neglecting differences in the foam network that may impact electron conduction pathways. However, the center-to-edge electrical resistance is 2–8 times higher than the edge-to-edge electrical resistance for all numbers of oMLD cycles in figure 6. This suggests that the electrical connectivity pathways may not be as robust to the center of the sponge as around the external perimeter of the sponge, consistent with the partial CVD growth at this purge time as discussed above surrounding figure 5. Nonetheless, the general trend in electrical resistance versus number of oMLD cycles and the order-of-magnitude values of electrical resistance for center-to-edge tracks closely with the values measured for edge-to-edge, indicating that the PEDOT film is delivered all the way to the center of the sponge, and that increasing number of oMLD cycles increases the thickness/loading of PEDOT throughout the whole volume of the PU sponge.
To further confirm PEDOT loading at the center of each 1'' foam cube, we performed SEM measurements on the center area of the PU sponges in figure 6 after cutting them in half. In figure 7, we show SEM micrographs of PU sponges coated with 30 oMLD cycles (a)–(c), 50 oMLD cycles (d), and 100 oMLD cycles (e). All samples in figure 7 were formed using a 20 s EDOT dose, 20 s EDOT purge, 500 s MoCl5 dose, and 20 s MoCl5 purge based on the studies in figures 1, 4, and 5 above. The SEM images in panels (a), (d), and (e) of figure 7 were collected using backscatter electron detection (BSD) while carefully maintaining identical conditions (beam current, working distance, acquisition time, and detector brightness and contrast). By controlling the portion of the signal yield attributable to variable system parameters, the resulting intensity (brightness) is more strictly correlated to absolute material density and can thus be compared across samples. In figure 7(a) we see that the PU fibers contain a high-intensity lining on the external surface of each fiber, indicating that a higher density PEDOT coating was formed around each lower density PU fiber. To confirm this interpretation, we performed EDS analysis on this same fiber as indicated in figure 7(b) (note some beam damage after prolonged electron beam exposure) and mapped the Mo and S composition using EDS. Here we show both Mo and S together because these elements are unique to the PEDOT coating. We note that oMLD PEDOT films grown using EDOT and MoCl5 are known to contain residual MoClx at a near stoichiometric quantity with EDOT monomers [47, 48]. Comparing the intensity data in figure 7(a) to the EDS data in figure 7(c) we observe that, indeed, the increased intensity near the edge of each PU fiber corresponds to an increased quantity of S and Mo consistent with a PEDOT layer. This SEM/EDS data confirms that the EDOT and MoCl5 precursors are reaching the fibers within the center of each 1'' sponge piece and reacting to form a conformal PEDOT layer on these fibers.
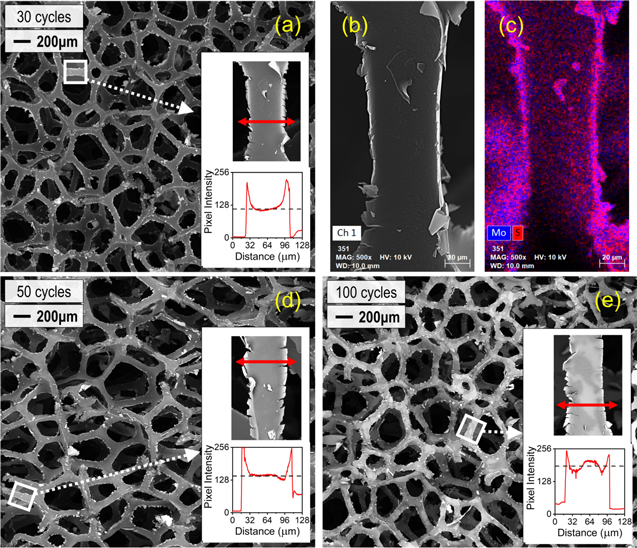
Figure 7. Scanning electron microscopy (SEM) characterization at the center of 1'' PU foam cubes after 30 (a)–(c), 50 (d), and 100 (e) oMLD cycles of EDOT/MoCl5. All the samples here have been coated under the optimized growth conditions of a 20 s EDOT dose, 20 s EDOT purge, 500 s MoCl5 dose, and 20 s MoCl5 purge. Panels (a), (d), and (e) demonstrate (via backscatter imaging) the extent of the coating over a 3.66 mm field, with the insets characterizing the coating on individual fibers as a function of pixel intensity across the face. EDS hypermapping in (b) and (c) confirms the high-intensity regions to be correlated with Mo and S, consistent with EDOT/MoCl5 precursors.
Download figure:
Standard image High-resolution imageTo confirm that the decrease in resistance with increasing number of oMLD cycles shown in figure 6 corresponds to an increase in the thickness/loading of PEDOT, we compare the BSD SEM micrographs after 30 oMLD cycles (figure 7(a)), 50 oMLD cycles (figure 7(d)) and 100 oMLD cycles (figure 7(e)). Qualitatively we observe an increase in the average intensity of each SEM image with an increasing number of oMLD cycles, consistent with an increase in PEDOT thickness/loading. We note that the thickness of PEDOT on Si wafers placed adjacent to each PU sponge analyzed in figure 7 were measured to be 32 nm, 88 nm, and 120 nm for 30, 50, and 100 oMLD cycles, respectively. We also measured the mass change of the PU sponges after oMLD growth. The initial mass of uncoated sponges was 363 ± 6 mg, and the mass of the sponges depicted in figure 7 after oMLD growth were 270 mg, 320 mg, and 367 mg, following 30, 50, and 100 oMLD cycles, respectively. These final masses correspond to −25%, −12%, and +1% changes in mass, respectively, relative to the initial PU foam mass. We attribute the net decrease or neutral mass change to the chemical decomposition and release of volatile byproducts from the PU fibers during MoCl5 exposure, as described above surrounding figure 3. We note that the decomposition and removal of mass from PU by MoCl5 exposure is reminiscent of molecular layer etching [67] and atom layer etching processes [68] reported in recent years, but the initial indications in this work do not suggest that this etching process is self-limiting for MoCl5 exposure to PU. Further insights into the deposition of oMLD PEDOT onto PU foam fibers is gained by examining higher resolution SEM images of individual PU fibers in the insets of figures 7(a), (d), and (e). In each of these three panels of figure 7, we show an individual PU fiber and plot the pixel intensity along the cross-section of each fiber as indicated. In general, we observe that the average intensity within each fiber increases with an increasing number of oMLD cycles as indicated by the horizontal dashed lines in each inset. This is consistent with the qualitative observation of increasing intensity with increasing number of oMLD cycles across the wide field in figures 7(a), (d), and (e), and supports an increased mass loading with increasing oMLD cycles. However, these SEM images also reveal additional insights into the nature of the oMLD growth process on the PU fibers. First, we observe rough/torn edges on each of the PU fibers after oMLD growth. We attribute this to the disintegration and etching of PU upon MoCl5 exposure as described above surrounding figure 3. We also note that there is a distinct increase in intensity with maxima at the peripheries of each fiber, to a depth of up to ∼8 μm. This dimension is ∼100 times larger than the thickness of 50 nm measured on Si wafers adjacent to the PU sponge and suggests that the MoCl5 and EDOT precursors are infiltrating into the bulk PU fibers, providing both a primary external PEDOT coating and secondary PEDOT layer infiltrated into the PU fibers. This behavior is consistent with prior observations for the infiltration of organometallic precursors into bulk polymers [43–46, 66].
These combined processes of (1) PU etching by MoCl5 and (2) vapor infiltration of EDOT and MoCl5 into the PU fibers are expected to give rise to nonlinear changes in mechanical properties versus the number of PEDOT oMLD cycles. In figure 8(a) we report the σ versus ε curves during mechanical compression and decompression for PU sponges coated with 10, 30, 50, and 100 oMLD cycles. In figure 8(b) we report the average σavg measured over 0.1 ≤ ε ≤ 0.4 for each of these sponges. The value of σavg increases from 0.96 psi for uncoated PU up to 2.1 ± 0.1 psi measured for 30 oMLD cycles, and then decreases to 1.9 ± 0.1 psi at 50 oMLD cycles and 1.6 ± 0.4 psi at 100 oMLD cycles in figure 7(b). Likewise, in figure 8(c) we plot E on decompression for each of the sponges depicted in figure 8(a). The value of E increases with an increasing number of oMLD cycles up to a value of 47.2 psi for 50 oMLD cycles and then a decrease by 14% to a value of 40.5 psi after 100 oMLD cycles. These trends in σavg and E are consistent with our expectations based on the combined effects of (1) the infiltration and incorporation of more PEDOT with a higher number of oMLD cycles and (2) the reaction of MoCl5 with the PU fibers as outlined in figure 3. Rigid, dense PU has a Young's modulus ∼500 psi [69], whereas PEDOT has a Young's modulus of ∼200 000 psi [70]. This ∼400-fold higher Young's modulus of PEDOT relative to PU means that a greater mass fraction of PEDOT within a PU sponge will give rise to higher values of σavg and E. However, under extended MoCl5 exposure, more PU will be etched away, leading to a decrease in σavg and E. We attribute the increase and levelling off that we observe for σavg and E versus the number of oMLD PEDOT cycles in figure 8 to the superposition of these effects.
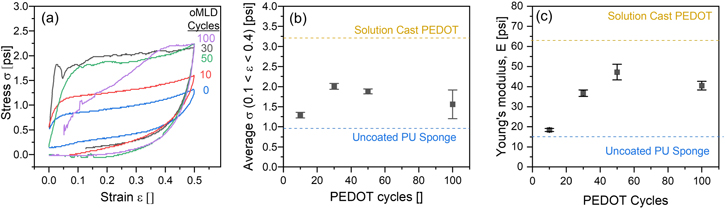
Figure 8. Effect of the number of oMLD growth cycles on the mechanical properties of PEDOT-coated PU formed using 30 oMLD cycles with a 20 s EDOT dose, 20 s EDOT purge, 500 s MoCl5 dose, and 20 s MoCl5 purge, including (a) stress versus strain during compression at a strain rate of 0.1 in min−1, (b) σavg on compression measured over 0.1 ≤ ε ≤ 0.4 from (a) versus number of oMLD cycles, and (c) Young's modulus on decompression from (a) versus number of oMLD cycles.
Download figure:
Standard image High-resolution image3.6. Stability of PEDOT-coated PU sponges
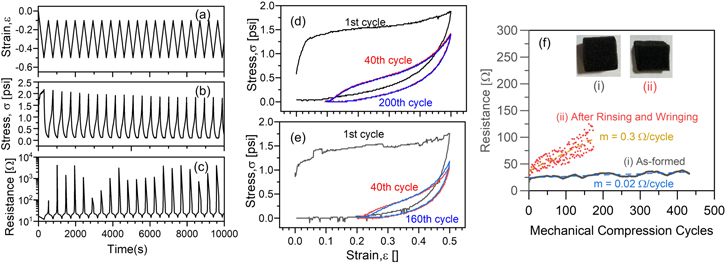
To be useful in electrochemical devices, these sponge electrodes must effectively balance (1) high electrical conductivity, (2) low compressive stress for pore collapse, and (3) low Young's modulus for more elastic recovery of foam pores. Based on the composite data collected above, we identified that, of the conditions explored in this work, 50 oMLD PEDOT cycles grown using a 20 s EDOT purge time provide the best balance of electrical conductivity and mechanical compressibility. However, to be useful as porous compressible electrodes, these PU foams must maintain these electrical and mechanical properties under repeated mechanical compression and exposure to electrolyte solutions. Based on this, we performed extended mechanical cycling of PU foams coated with PEDOT using these conditions and examined changes in the electrical conductivity and mechanical properties in figure 9. Here, we control the strain (figure 9(a)) using the compression tester described above and simultaneously measure the stress (figure 9(b)) and electrical resistance (figure 9(c)) during extended mechanical cycling for up to 400 mechanical compression/decompression cycles. We report the mechanical stress versus strain data for these PEDOT-coated PU sponges as-formed (figure 9(d)) and after repeated rinsing in tap water, manually wringing out the liquid, and then air-drying (figure 9(e)). We also report changes in the electrical resistance as a function of mechanical compression cycles (figure 9(f)) for these sponges as-formed (i), and after repeated rinsing and wringing (ii).
Figure 9. Stability of mechanical and electrical properties of PEDOT-coated PU sponges coated with 50 oMLD cycles using a 20 s EDOT purge time both as-formed and after repeated compression cycling and repeated rinsing in water and manual wringing, including (a) strain, (b) stress, (c) electrical resistance during first 20 mechanical compression cycles, and (d) σ versus ε curves for 1st, 40th, and 200th compression/decompression cycle for as-formed PEDOT-coated PU sponge and (e) σ versus ε curves for 1st, 40th, and 160th compression/decompression cycle for PEDOT-coated PU sponge after repeated rinsing in tap water and manual wringing; as well as (f) minimum values of electrical resistance for each mechanical cycle for (i) as-formed PEDOT-coated PU and (ii) after rinsing in tap water and manual wringing. The dashed lines and labeled values of slope, m, in (f) correspond to linear fits of electrical resistance versus compression cycle.
Download figure:
Standard image High-resolution image
Panels (a)–(c) of figure 9 are data for an as-formed PEDOT coated PU sponge loaded with 50 oMLD cycles of PEDOT using the optimal growth conditions identified above. In figures 9(b) and (c), we observe that the stress and strain undergo dynamic changes during the first 20 mechanical compression cycles. In figure 9(d), we process the data from figures 9(a) and (b) and plot the σ versus ε curves for select cycles, with similar data shown for a PEDOT-coated PU sponge after rinsing and wringing in figure 9(e). We observe that the mechanical response reaches steady state after 40 compression cycles, with minimal difference between the σ versus ε curves after 40 and 200 compression cycles for the as-formed PEDOT-coated PU, and minimal differences between the σ versus ε curves after 40 and 160 compression cycles for the PEDOT-coated PU after repeated rinsing in tap water and manual wringing. We note that this repeated mechanical cycling was performed in such a way that the strain was reduced on decompression until zero force was measured, at which point compression was reinitiated, starting the next compression cycle. Because of this, the minimum strain on decompression reached a steady state value of ∼0.1 for the as-formed PEDOT-coated PU (figure 9(d)), and a value of ∼0.2 for the PEDOT-coated PU after rinsing/wringing (figure 9(e)). As above, these data were collected at a strain rate of 0.1 in min−1. This steady state mechanical compression data in figures 9(d) and (e) is analyzed in more detail below, but the convergence to repeatable steady-state mechanical compression behavior after >100 cycles generally suggests that repeated mechanical cycling does not lead to significant degradation of the mechanical properties of these sponges.
Although the PEDOT-coated PU sponges both as-formed and after rinsing/wringing reach steady state behavior, the mechanical properties we observe vary between the two. For the as-formed PEDOT-coated PU sponge, the Young's modulus on decompression during the first cycle was 29.1 psi, and decreased to 22.5 psi after 40 compression cycles and 22.1 psi after 200 compression cycles. For comparison, after repeated rinsing and mechanical wringing the Young's modulus on decompression during the first cycle was 41.0 psi, and decreased to 18.8 psi after 40 compression cycles and 17.0 psi after 160 compression cycles. Similarly, the average energy required to compress the as-formed PEDOT-coated PU foam from a strain of 0.2 to a strain of 0.5 was 26.9 mJ after 40 compression cycles and 26.4 mJ after 200 compression cycles. The energy recovered on decompression was 13.2 mJ after 40 compression cycles and 13.4 mJ after 200 compression, corresponding to ∼50% energy recovery at this strain rate of 0.1 in min−1. For comparison, the average energy required to compress the PEDOT-coated PU foam after rinsing/wringing from a strain of 0.2 to a strain of 0.5 was 13.8 mJ after 40 compression cycles and 13.4 mJ after 160 compression cycles. The energy recovered on decompression was 6.5 mJ after 40 compression cycles and 6.7 mJ after 160 compression cycles, corresponding to ∼50% energy recovery. These data indicate that the rinsing and wringing process may remove some of the PEDOT-coated PU sponge, and/or damage the integrity of the polymer network within the PU foam, leading to a smaller amount of energy required to compress the sponge.
In figure 9(f) we report the minimum electrical resistance measured at ε = 0.5 versus the number of compression/decompression cycles for both the as-formed PEDOT-coated PU, and PEDOT-coated PU following rinsing and wringing. As-formed PEDOT-coated PU exhibits a low electrical resistance of 20 Ω during initial mechanical cycling, that only increases by 0.02 Ω per compression/decompression cycle on average over >400 mechanical compression cycles. After rinsing and wringing, the PEDOT-coated PU exhibits a higher electrical resistance of 30 Ω during initial mechanical cycling, which increases by 0.3 Ω per compression/decompression cycle on average over >150 mechanical compression cycles. Both of these sponges exhibit mean electrical resistances of ≤100 Ω or less during the extent of mechanical testing shown in figure 9. The higher electrical resistance observed following rinsing and ringing may arise from either (a) changes in ionic dopant concentration and state of charge or (b) mechanical degradation of the PEDOT sponge network following exposure to the manual rinsing and wringing procedure. These results are qualitative demonstrations that high electrical conductivity can be maintained even after exposure to electrochemically relevant conditions.
4. Conclusions
This work demonstrates the formation of electrically conductive and mechanically compressible porous sponge electrodes through oMLD of PEDOT onto PU sponge supports. We identified that PU undergoes oxidative decomposition and degrades on exposure to MoCl5, leading to mechanical embrittlement. To overcome this challenge and deliver PEDOT coatings onto PU sponges, we took advantage of vapor infiltration processes of the chemical precursors into the PU sponge fibers and reduced the purge times following the EDOT precursor dose such that MoCl5 reacted with excess EDOT contained in/on the PU rather than with the PU itself. Using this approach, we demonstrated the ability to achieve a contiguous network of PEDOT throughout the bulk of 1'' cube PU sponges. We measure electrical resistances as low as 20 Ω across the 1'' foam cube while maintaining Young's modulus and average stress on foam collapse of only 2–3 times higher than measured for unmodified PU foam. We measured electrical resistance of ≤100 Ω from end-to-end on the sponge after manual rinsing and ringing and >150 compression/decompression cycles. The use of oMLD to deposit PEDOT provides four orders of magnitude higher electrical conductivity and a 2–3 times lower Young's Modulus as compared with solution casting. We attribute these improvements to (a) the formation of a conformal, uniform, and contiguous network of PEDOT with control over PEDOT thickness achievable by oMLD and (b) higher electrical conductivity of vapor-deposited PEDOT over solution-cast PEDOT films. This synthesis approach provides a platform for the generation of compressible, conductive electrodes with independent control over foam microstructure and redox-active material thickness. This platform can be used in future work to overcome diffusion limitations during electrochemical processes.
Acknowledgments
MM, GL, KGB, QKW and MJY acknowledge support from the National Science Foundation, Division of Chemical, Bioengineering, Environmental, and Transport Systems. This material is based upon work supported by the National Science Foundation under Grant No. 2131282. We thank Brian Porter at the Missouri University of Science and Technology for assistance with XPS measurements. We thank Rod Schlotzhauer, Christopher Strehl, and Ghassan Al Bahhash at the University of Missouri for assistance with fabrication of the electrical impedance test cells, and Joseph Mathai at the University of Missouri for assistance with Raman spectroscopy. We also thank Prof Pat Kinlen, Prof Reginald Rogers, and Prof Matthew Maschmann at the University of Missouri for useful discussions.
Data availability statement
All data that support the findings of this study are included within the article (and any supplementary files).
Supporting Information (0.3 MB PDF)