

Abstract
The development of safe and efficient nanocomposites remains a huge challenge in targeted therapy of glioma. Nanostructured lipid carriers (NLCs), which facilitate specific site drug delivery, have been widely used in glioma treatment. Herein, we aimed to investigate the underlying mechanisms and therapeutic impact of paclitaxel (PTX) and doxorubicin (DOX) loaded NLC (PTX-DOX-NLC) on glioma stem cells (GSCs). To this end, we used a melt-emulsification technique to generate PTX loaded NLC (PTX-NLC), DOX loaded NLC (DOX-NLC), and NLC loaded with both drugs (PTX-DOX-NLC). We firstly confirmed the stability of PTX-DOX-NLC and their ability to gradually release PTX and DOX. Next, we evaluated the effects of PTX-DOX-NLC on apoptosis and proliferation of GSCs by flow cytometry and CellTiter-Glo assay. Besides, the expression of relevant mRNA and proteins was determined by RT-qPCR and Western blot analysis, respectively. Mechanism of action of PTX-DOX-NLC was determined though bioinformatic analysis based on RNA-seq data performed in GSCs derived from different NLC-treated groups. In addition, a mouse xenograft model of glioma was established to evaluate the anti-tumor effects of PTX-DOX-NLC in vivo. Results indicated thar PTX-DOX-NLC showed greater inhibitory effects on proliferation and promotive effects on apoptosis of GSCs compared with PTX-NLC, DOX-NLC, free PTX, and free DOX treatment. Mechanistic investigations evidenced that PTX-DOX-NLC inhibited tumor progression by suppressing the PI3K/AKT/mTOR signaling in vitro and in vivo. Taken together, PTX-DOX-NLC played an inhibitory role in GSC growth, highlighting a potential therapeutic option against glioma.
Export citation and abstract BibTeX RIS
1. Introduction
Glioma is one of the most prevalent types of brain tumor [1] and characterized by heterogeneous angiogenesis and invasiveness [2]. Despite of the numerous treatments, including surgical resection, radiotherapy, and chemotherapy, the current clinical benefits are limited by recurrence and resistance, which finally leads to short overall survival [3]. Presence of glioma stem cells (GSCs) is a marker of the most malignant phenotype of glioma, which entails enhanced cell metastasis and invasion leading to tumor recurrence, treatment resistance, and thus bringing an unfavorable prognosis [4, 5]. Recently, GSCs have attracted wide interest as a promising therapeutic target for glioma [6]. Moreover, anti-glioma thereby can be significantly improved by increasing the load of therapeutic drugs into GSCs and enhancing their migration capacity and persistence [7].
Nanostructured lipid carriers (NLCs), a type of drug delivery system, have been widely used in the field of biomedicine for several decades, and have been used in the experimental treatment of various brain diseases including brain cancer [8]. NLCs have an established role as potential nano-carriers for the development of effective targeted chemotherapy drugs for cancer treatment [9]. Currently, paclitaxel (PTX) is a common chemotherapy drug, which serves as a first- or second-line treatment for a variety of cancers [10]. Doxorubicin (DOX), a DNA topoisomerase II inhibitor, is a member of the family of anthracycline anti-cancer drugs, which is adopted to treat various kinds of cancers [11]. More importantly, evidence has emerged for the potential of therapeutic delivery of PTX or DOX by liposomes in anti-glioma thereby [12, 13]. Here, we attempted to examine the specific effect of NLCs loading PTX and/or DOX as a potential therapeutic instrument acting on GSCs.
Protein Kinase B (Akt) is a serine/threonine kinase, which is activated in a variety of cancers and can regulate proteins involved in angiogenesis, migration, and proliferation of cancer cells [14]. The phosphatidylinositol 3-kinase (PI3K) signaling is regarded as being commonly deregulated in human cancer, thereby eliciting a crucial impact in inducing tumorigenesis [15]. Mammalian target of rapamycin (mTOR) is a serine/threonine kinase that can regulate various basic cellular processes, and mutation of which has been confirmed in several human cancers [16]. Overactivation of PI3K/Akt/mTOR signaling exerts a promoting role in tumorigenesis, therefor presenting a novel anti-cancer target candidate [17]. Specifically, it has been demonstrated that PI3K/Akt/mTOR signaling is involved in the pathogenesis of glioma [18], moreover, PI3K/Akt/mTOR signaling can modulate self-renewal of GSCs in glioma [19]. Based on these previous studies, we hypothesized that PTX and/or DOX-loaded NLCs could potentially inhibit the progression of GSCs via inactivation of the PI3K/Akt/mTOR signaling.
2. Materials and methods
2.1. Ethics statement
The experiments involving animals were performed according to protocols approved by the Institutional Animal Care and Use Committee of North China University of Science and Technology Affiliated Hospital. All experiments were conducted in compliance with the recommendations in the Guide for the Care and Use of Laboratory Animals of the National Institutes of Health.
2.2. Microarray-based gene expression profiling
The targets of PTX and DOX were retrieved from the drug-gene interaction database (DGIdb, www.dgidb.org). Glioma-related GSE79097 dataset (the platform annotation file: GPL15207) was downloaded from the Gene Expression Omnibus (GEO) database (https://ncbi.nlm.nih.gov/geo/). The dataset includes 3 normal samples and 11 tumor samples. Next, the R language 'limma' package (http://bioconductor.org/packages/release/bioc/html/limma.html) was used for differential analysis on the obtained GSE79097 dataset to screen the differentially expressed genes in glioma [20]. False discovery rates (FDRs) were calculated using the Benjamini and Hochberg methods, and the ∣log FoldChange∣ ≥ 1, FDR-corrected p value <0.05 was set as the screening criterion. Log FoldChange >1 suggests that the expression of this gene is significantly higher in glioma than that in normal control, while log FoldChange <−1 suggests that this gene expression is significantly lower in glioma than that in normal control. A heat map depicting the expression of the 50 top-most differentially expressed genes was plotted using the R 'pheatmap' package (https://cran.r-project.org/web/packages/pheatmap/). The overlap of PTX and DOX targets and significantly differentially expressed genes was then analyzed using the jvenn tool (http://jvenn.toulouse.inra.fr/app/example.html). The interaction network of drug-disease-genes was constructed by the Cytoscape 3.5.1 software [21]. To further study the signaling involved in the differentially expressed genes, the R language 'clusterProfiler' package (http:/bioconductor.org/packages/release/bioc/html/clusterProfiler.html) was applied for enrichment analysis via the Kyoto Encyclopedia of Genes and Genomes (KEGG) [22].
2.3. Preparation of NLC
NLC loaded with PTX and DOX was prepared using the melt-emulsification technique [23]. A mixture containing 100 mg COMPRITOL® 888 ATO, 100 mg soybean phosphatidylcholine, and 100 mg oleic acid were heated to prepare a thermal lipid phase. PTX (50 mg) and DOX (50 mg) were dissolved in 1 ml dimethyl sulphoxide (DMSO) and added with the thermal lipid phase. Then, 20 mg DOTMA was dissolved in 10 ml distilled water to obtain the aqueous phase. The aqueous and lipid phase were placed together in an oil bath at 80 °C and magnetically stirred for 15 min. The hot lipid phase was slowly added to the aqueous phase, followed by dispersing at high speed (10 000 rpm) for 5 min. The crude oil emulsion obtained above was treated for 5 min with an ultrasonic probe set at a power of 3 W. The hot emulsion was cooled to 4 °C in an ice bath and mechanically stirred for 30 min DMSO was removed by dialysis against deionized water. The hot emulsion was freeze-dried to obtain powdered PTX-DOX-NLC samples, which were stored at 4 °C for later use. PTX- and DOX-loaded NLC samples were prepared separately as described above.
2.4. Characterization of properties of NLC
The particle size of NLC was determined. In brief, NLCs were diluted 3000 times in mass ratio with ultrapure water. A nanometer particle size analyzer (Malvern Instruments Ltd, Malvern, Worcestershire, England) was applied to determine the particle size, particle size distribution, and surface charge of NLC.
Examination of drug loading capacity (DLC) and drug loading efficiency (DLE) of NLC: the content of DOX in NLC was analyzed by UV spectrophotometry at 480 nm. A total of 1 mg NLC was dissolved in 1 ml DMSO as the test product. DOX (0–100 μg ml−1) was prepared with the same solvent and the absorption wavelength was measured at 480 nm to produce a standard curve. The content of PTX in microspheres was analyzed by high performance liquid chromatography (HPLC). In this procedure, the NLCs were dissolved in dichloromethane [21]. A Symmetry C18 chromatographic column was adopted as the stationary phase and acetonitrile/water (v/v = 4:1) as mobile phase, with 20 μl sample injection volume. Absorption wavelength was measured at 227 nm using an ultraviolet spectrophotometer for quantitative analysis. DLC and DLE were calculated respectively based on the following formula: DLC (%) = Wloaded drug/Wdrug loaded NCL × 100%; DLE (%) = Wloaded drug/Wfree drug × 100%.
Drug release characteristics of NLC in vitro: the drug release characteristics of PTX or DOX-loaded NLCs as well as PTX-DOX-NLC were determined as previously described [24, 25]. In brief, NLCs were suspend in 5 ml phosphate buffered saline (PBS) and transferred to a dialysis bag with a molecular weight cut-off of 3500 Da, and then placed in a 45 ml release medium and dialyzed with stirring at 100 rpm at 37 °C. A 4 ml portion of incubation solution was removed and replaced with the same volume of fresh PBS. The amount of DOX and PTX released was determined by ultraviolet spectrophotometry and HPLC, respectively.
2.5. PTX and DOX-loaded NLC
The ratio of combined drug loading PTX and DOX was optimized, with the IC50 of anti-proliferation as the parameter, where the PTX/DOX values of the drug loading ratio were as the following: 1:5, 1:2, 1:1, 2:1, 5:1 (w/w). Each ratio was diluted as the listed concentration ratio (table 1) to detect cell activity. Graphpad was employed to calculate the IC50 of PTX and DOX at each ratio, and the group with the lowest IC50 was selected as the optimal ratio.
Table 1. Concentration ratio of PTX/DOX values.
| PTX/DOX = 1:5 | PTX(μM) | DOX(μM) | PTX/DOX = 1:2 | PTX(μM) | DOX(μM) | PTX/DOX = 1:1 | PTX(μM) | DOX(μM) |
|---|---|---|---|---|---|---|---|---|
| 0.0625 | 0.3125 | 0.15625 | 0.3125 | 0.3125 | 0.3125 | |||
| 0.125 | 0.625 | 0.3125 | 0.625 | 0.625 | 0.625 | |||
| 0.25 | 1.25 | 0.625 | 1.25 | 1.25 | 1.25 | |||
| 0.5 | 2.5 | 1.25 | 2.5 | 2.5 | 2.5 | |||
| 1 | 5 | 2.5 | 5 | 5 | 5 | |||
| PTX/DOX = 2:1 | PTX(μM) | DOX(μM) | PTX/DOX = 5:1 | PTX(μM) | DOX(μM) | |||
| 0.3125 | 0.15625 | 0.3125 | 0.0625 | |||||
| 0.625 | 0.3125 | 0.625 | 0.125 | |||||
| 1.25 | 0.625 | 1.25 | 0.25 | |||||
| 2.5 | 1.25 | 2.5 | 0.5 | |||||
| 5 | 2.5 | 5 | 1 |
2.6. Examination of cell viability
The sorted CD133-positive (CD133+) U87 cells were seeded into 96-well plates with 5000 cells/well and cultured in 200 μl medium. Different drug concentration gradients (based on the determined drug combination ratio) (0, 0.3125, 0.625, 1.25, 2.5, and 5 μM) or time gradients (0, 12, 24, 36, 48, 60, and 72 h) were set, with three replicates for each concentration. After 72 h of culture, the cell viability was detected with CellTiter-Glo kit. Celltiter reagent (100 μl) was added to each well and mixed at room temperature on a shaker for 10 min. Cell viability was determined on a Glomax automatic fluorometer. The experiment was performed in the dark.
2.7. Soft agar colony formation assay
Cell suspension (1 × 10⁴–2 × 10⁴) was mixed with 0.4% agar in phenol red-free culture medium, and plated on top of a solidified layer of 0.8% agar in serum-free phenol red-free Roswell Park Memorial Institute (RPMI)-1640 medium in a 6-well plate. After the apical agar was solidified, normal growth medium supplemented with indicated treatments (Blank NLC, Free DOX group, Free PTX group, DOX-NLC group, PTX-NLC group, and PTX-DOX-NLC group), which was added on top of the apical layer and renewed every 3 d. After 2–3 weeks, the colonies were stained with 1 mg ml−1 iodonitrotetrazolium violet (Shanghai ziyi Reagent Co., Ltd, Shanghai, China) overnight at 37 °C, and the colonies with diameter exceeding 2 mm were counted.
2.8. RNA extraction
Cells in 6-well plates were collected and lysed in 1 ml cold TRIzol. Tumor tissues were grinded in the presence of liquid nitrogen, followed by dissolving in TRIzol (1 ml per 50–100 mg) with the assistance of a homogenizer. The concentration of total RNA was determined on aNanodrop2000.
2.9. Reverse transcription quantitative polymerase chain reaction (RT-qPCR)
Reverse transcription was performed according to the instructions of the reverse transcription kit (CAS:205311, QIAGEN, Valencia, CA, USA) to generate complementary DNA. Primers for RT-PCR (table 2) were designed using primer 5.0 software on the basis of sequences reported in the Gembank database, and were synthesized by Shanghai Sangon Company (Shanghai, China). RT-qPCR was performed using SYBR premix Ex Taq (RR420B, Takara Bio, Japan) and the relative expression of target genes was calculated by the 2−ΔΔCt method with β-actin as the internal control gene.
Table 2. Primer sequences for RT-qPCR.
| Genes | Primer sequence (5'-3') |
|---|---|
| PI3K | F: ACCACACGTTCCTAAGCTGG |
| R: TCCCTGCACGCAGAGATTTT | |
| Akt | F: AACTACAACTTCTTCCCTCGCAA |
| R: CAAAGTTATGTCCACTGTCTCT | |
| mTOR | F: TCCCTGCACGCAGAGATTTT |
| R: TTGATTTCTCCTGGCTGTCTC | |
| Actin | F: TCCTCCCTGGA GAAGAGCTA |
| R: TCAGGAGGAGCAATGATCTTG |
Note. RT-qPCR, reverse transcription quantitative polymerase chain reaction; PI3K, phosphatidylinositol 3-kinase; Akt, Protein Kinase B; mTOR, mammalian target of rapamycin; F, forward; R, reverse.
2.10. Western blot analysis
Total protein of cells was extracted using radio-immunoprecipitation assay lysis buffer and the concentration was determined using bicinchoninic acid (BCA) protein assay kit (P0010, Beyotime Institute of Biotechnology, Shanghai, China). Samples of 30 μg of isolated proteins were separated by 10% sodium dodecyl sulfate-polyacrylamide gel electrophoresis (SDS-PAGE). After separation, the protein was transferred to polyvinylidene fluoride (PVDF) membrane, and then blocked with 5% bovine serum albumin (BSA) for 1 h. The membrane was probed with diluted primary mouse anti-human antibodies to phosphorylated (p)-PI3K, p-Akt, mTOR, and actin (all from SANTA CRUZ, CA, USA) overnight at 4 °C. The membrane was then probed with goat anti-rabbit secondary antibody conjugated with horseradish peroxidase (HRP) for 1 h at room temperature. Electrogenerated chemiluminescence was applied for visualization in the dark. The Image J software was used for gray scale analysis to determine the relative expression of proteins.
2.11. CD133+ cells sorted by magnetic-activated cell sorting
U87 cells were incubated with ethylenediaminetetraacetic acid (EDTA) digestion solution (containing 2.5 mmol L−1 EDTA and 1% FBS, pH7.4) for 30 min at 4 °C. The cells were suspended in 300 μl suspension buffer to a concentration of 1 × 10⁷ cell ml−1. CD133+ and CD133 negative (−) U87 cells were sorted with the MiniMACS separation column according to the operating instructions and saved for future use.
2.12. Tumor xenografts in nude mice
Thirty-six healthy female mice (aged 5 weeks) were housed adaptively in the specific pathogen free animal laboratory cages with 60%–65% relative humidity, at 22 °C–25 °C with free access to food and water under 12 h light/dark cycle for one week. The sorted CD133+ U87 cells were subcutaneously inoculated into the underarms of the mice. Thereafter, the mice were randomly divided into 6 groups of six mice based on the treatment received. Tail vein injection was then adopted for administration of drugs or vehicles (DOX, PTX, DOX-loaded NLC, PTX-loaded NLC, or PTX and DOX-loaded NLC) for 21 consecutive days. During this period, tumor volume and body weight of the tumor-bearing mice were monitored and recorded. On the 28th day, mice were euthanized by intraperitoneal injection of excess barbital sodium. End-point tumor size and tumor weight were measured and the harvested tumors were fixed and prepared for histological analysis.
2.13. Immunohistochemistry
Paraffin sections of mouse tumor specimens were washed with tap water for 2 min after dewaxing and gradient alcohol rehydration. Endogenous peroxidase activity was quenched by incubating the sections with 3% hydrogen peroxide (H2O2) in methanol for 20 min. Sections were repaired in water bath with antigen repair solution (citrate buffer, pH 6.0) for antigen retrieval. Afterwards, the sections were blocked with goat serum blocking solution (C-0005, Shanghai Haoran Biotechnology Co., Ltd, Shanghai, China) at room temperature for 20 min. Sections were probed with rabbit anti-human antibodies to CD133 (1:200, Abcam, Cambridge, UK), Ki-67 proliferative index (ki-67; 1:200, Abcam), p-PI3K (1: 200, Abcam), p-Akt (1:200, Abcam), and mTOR (1: 200, Abcam) overnight at 4 °C, and then with the IgG (ab6785, 1:1000, Abcam) at 37 °C for 20 min. After that, HRP (Imunbio Biotechnology Co., Ltd, Beijing, China) was added and incubated at 37 °C for 20 min. Sections were visualized with 3,3'-diaminobenzidine (ST033; Guangzhou Weijia Technology Co., Ltd, Guangzhou, China) and the nuclei were counterstained with hematoxylin (PT001; Shanghai Biological Bogu Technology Co., Ltd, Shanghai, China) for 1 min and returned to blue by treatment with 1% ammonia. Then, sections were dehydrated with gradient alcohol, cleared with xylene, and sealed with neutral gum for microscopy. Five high-power microscopic fields were randomly selected from each section, with at least 100 cells in each field.
2.14. Biochemical analysis
Healthy BALB/c mice (n = 12) were weighed and randomly divided into two groups (n = 6). PTX-DOX-NLC or PBS was injected intravenously via the tail vein. About 1 ml of blood was collected from the tail vein of the mouse within 24 h after injection, and immediately centrifuged at 5000 rpm for 3 min to collect serum for blood biochemical analysis to determine the level of liver (liver alkaline phosphatase (ALP), aspartate aminotransferase (AST), alanine aminotransferase (ALT)) and renal (blood urea nitrogen (BUN)) functional markers [24, 26–28].
2.15. Statistical analysis
The data were processed using SPSS 21.0 statistical software (IBM Corp. Armonk, NY, USA). Measurement data were expressed as mean ± standard deviation. Comparison among multiple groups was conducted by one-way analysis of variance (ANOVA) with Tukey's post hoc test. Cell proliferation data at different time points were compared by two-way ANOVA with Bonferroni's post hoc test. Repeated measurement ANOVA with Bonferroni's post hoc test was used to compare tumor data at different time points. p < 0.05 was considered as significantly different. All experiments were performed three times independently.
3. Results
3.1. PTX and DOX may mediate the development of glioma by regulating the PI3K/Akt/mTOR signaling
We first retrieved the drug target database DGIdb and obtained the corresponding gene interaction targets of PTX and DOX. Then we performed a differential gene expression analysis on a glioma-related expression dataset GSE79097, which revealed 3011 differentially expressed genes, including 1372 highly-expressed genes and 1639 lowly-expressed genes (figure 1(A)). A heat map illustrating the top 50 differentially expressed genes is shown in figure 1(B). Following Venn diagram analysis of the aforementioned genes, 37 genes were found at the intersection (figure 1(C)). An interaction network regarding the drug-disease-gene is shown in figure 1(D). In addition, KEGG enrichment analysis showed that 37 genes were mainly enriched in microRNAs in cancer and PI3K-Akt signaling (figure 1(E)). Moreover, we found links between the PTX/DOX target genes and PI3K/Akt/mTOR signaling (map04151) by retrieving the KEGG database (figure 1(E)). The aforementioned bioinformatics results suggested that PTX and DOX may mediate the development of glioma by regulating the PI3K/Akt/mTOR signaling, which inspired us to investigate the regulation of PI3K/Akt/mTOR signaling by PTX-DOX-NLC in glioma.
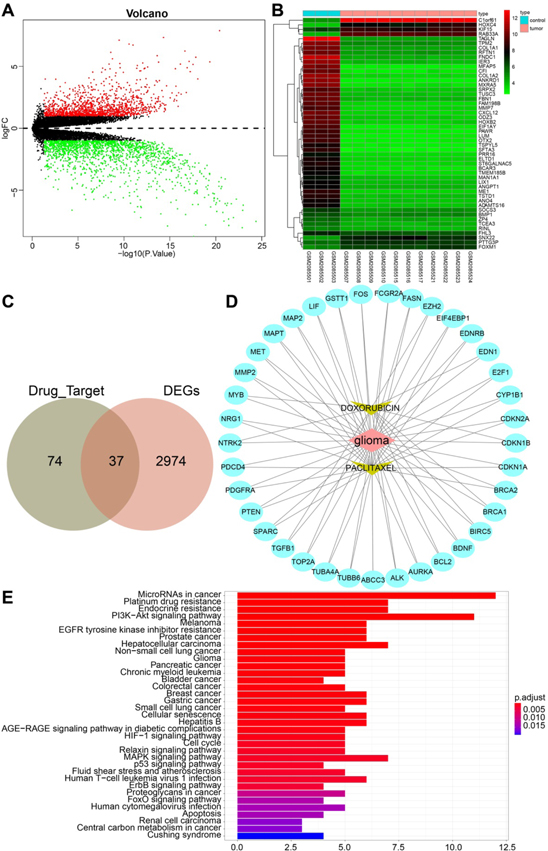
Figure 1. Gene expression analysis on a glioma-related expression dataset GSE79097. (A) Volcano plot of differently expressed genes obtained from the GSE79097 dataset in 3 normal samples and 11 tumor samples. The x-axis represents -log10 p value, the y-axis represents logFC value; red and green dots indicate highly-expressed genes and lowly-expressed genes with ∣logFC∣ ≥ 1, P value < 0.05, respectively. (B) The expression of the top 50 differentially expressed genes from the glioma-related expression dataset GSE79097 was illustrated in a heat map. (C) Drug-gene targets and differentially expressed genes were identified by using of Venn Diagram. (D) The protein-protein interaction network of PTX, DOX and differentially expressed genes in glioma was constructed by the Cytoscape software. (E) KEGG enrichment analysis of the intersected 37 genes. The abscissa represents the gene ratio, and the ordinate represents the KEGG items.
Download figure:
Standard image High-resolution image3.2. Characterization of PTX and DOX-loaded NLCs
PTX and DOX-loaded NLC was prepared by the fusion emulsification technique (figure 2(A)). The results showed that the mean diameter of NLC ranged from 115 and 125 nm, with a uniform particle size distribution of each type of nanoliposome. The median particle size of drug-free NLCs was 119.72 nm, and that of DOX-loaded NLCs was 122.83 nm. The detection of Zeta potential, a key factor to predict and evaluate the colloidal dispersion stability, displayed, that compared with drug-free NLCs, PTX- and DOX-loaded NLCs exhibited lower Zeta potential. Moreover, PTX-DOX-NLC had the lowest Zeta point. Taken together, the particle size, particle size distribution, surface charge number, and polydispersity index of the prepared liposomes revealed their favorable dispersibility, which would promote their applicability for delivery to cancer cells (figure 2(B)). Although PTX-DOX-NLC had lower DLC and DLE compared with PTX-loaded or DOX-loaded NLCs, their stability was not affected, as reflected by the particle size and Zeta potential (figure 2(C)). We further evaluated drug release behaviors of PTX-DOX-NLC, DOX-loaded NLC, and PTX-loaded NLC in vitro. The results revealed that the PTX and DOX were gradually released during the test, which conformed to the Higuchi equation. The release rate of PTX and DOX reached more than 70% within 24 h, indicating that PTX-DOX-NLC had the capacity to gradually and steadily release PTX and DOX (figure 2(D)).

Figure 2. Characterization of PTX-DOX-NLC. (A) TEM image of NLC. Scale bar: 100 nm. (B) The particle size distribution, PDI, and zeta potential of NLCs (PTX-loaded, DOX-loaded, and PTX-DOX-NLCs) detected by a nanometer particle size analyzer. (C) DLC and DLE of NLCs. (D) Drug release profiles of PTX and DOX from PTX-DOX-NLC.
Download figure:
Standard image High-resolution image3.3. PTX-DOX-NLC inhibits GSCs growth
We initially observed that CD133+ cells could grow in clumps in stem cell medium to form stem cell globules (figure 3(A)), confirming that the obtained cells were GSCs. Next, the expression of Nestin, GFAP, and β-tubulin was determined in isolated CD133+ U87 cells by immunofluorescence staining. The result showed that Nestin was strongly positive, and GFAP and β-tubulin were negative (figure 3(B)). Meanwhile, the optimized combination ratio of PTX and DOX for NLC loading was also determined by evaluating their effect on cell viability, as reflected by the IC50. The results showed that IC50 was the lowest when PTX and DOX were loaded in a 1:1 ratio, rather than combinations. Therefore, this PTX/DOX ratio was selected for subsequent studies (figure 3(C)). Celltiter-Glo was applied to detect the cell activity of different groups (Blank NLC, Free DOX group, Free PTX group, DOX-NLC group, PTX-NLC group, and PTX-DOX-NLC group) after treatment with different concentrations (0, 0.3125 μM, 0.625, 1.25, 2.5, and 5 μM) (figure 3(D)). We found that all interventions suppressed the cell viability of GSCs in a dose-dependent manner compared to the control group, in which cells were treated with un-loaded NLC. Moreover, PTX-DOX loaded-NLC achieved stronger inhibitory effect on GSCs' viability than either PTX or DOX loaded-NLC groups, as well as the free drugs.

Figure 3. PTX-DOX-NLCs suppress GSC proliferation and promoted their apoptosis. (A) Images of CD133+ cells sorted from U87 cells. (B) Characterization of sorted CD133+ cells by detecting Nestin, GFAP, and β-tubulin via immunofluorescence staining. (C) Proliferation activity of GSCs examined by Celltiter-Glo after treatment with different PTX/DOX ratio. (D) Proliferation curve of GSCs after treatment with different NLC groups at different concentration. (E) Proliferation curve of GSCs after treatment with different NLC groups for different periods. (F) Apoptosis of GSCs evaluated by flow cytometry assay after treatment with different NLC groups. (G) Colony formation ability of GSCs assessed by soft agar colony formation test after treatment with different NLC groups. Measurement data were expressed as mean ± standard deviation. Comparison among multiple groups was conducted by one-way ANOVA with Tukey's post hoc test. Cell proliferation data at different time points were compared by two-way ANOVA with Bonferroni's post hoc test. *p < 0.05; **p < 0.01; ***p < 0.005; ****p < 0.001.
Download figure:
Standard image High-resolution imageCell activity of GSCs was also measured after exposing to different NLC groups for different periods (0, 12, 36, 48, 60, and 72 h) (figure 3(E)). The results revealed that the cell viability of GSCs was suppressed in a time-dependent manner while the PTX-DOX-NLC group showed a significantly stronger inhibitory effect in comparison to all other groups (Free DOX, Free PTX, DOX-NLC, PTX-NLC). The impact of PTX-DOX-NLC on GSC apoptosis was also assessed by treating GSCs with different NLCs for 24 h followed by apoptosis assay. Results from flow cytometry-based apoptosis assay suggested that, compared with the NLC group where cells were treated with un-loaded NLCs, all drug-loaded NLCs (as well as NLC-free drugs) resulted in increased apoptosis in GSCs (figure 3(F)). Furthermore, the effect of PTX-DOX-NLC on the colony formation potency of GSCs were also evaluated via soft agar colony formation assay. We observed that all drug-presenting interventions resulted in reduced colony formation potency in GSCs compared with that in the control group where cells were incubated with NLC alone. More importantly, the inhibitory effect of colony formation was most significant in PTX-DOX-NLC treated group (figure 3(G)). Taken together, these data suggested that NLC co-delivering PTX and DOX achieved better anti-proliferative and apoptosis induction effects in GSCs.
3.4. PTX-DOX-NLC inhibits PI3K/Akt/mTOR signaling in GSCs
The mechanism of the inhibitory role of PTX-DOX-NLC in GSCs was further explored. RT-qPCR and Western blot analysis were employed to measure the mRNA and protein expressions of PI3K, Akt, and mTOR in GSCs treated with NLC, DOX-NLC, PTX-NLC, or PTX-DOX-NLC. The results revealed that the mRNA (figure 4(A)) and protein levels (figure 4(B)) of PI3K, Akt, and mTOR in GSCs treated with PTX-DOX-NLC was significantly downregulated relative to that treated with NLC. Hence, both PTX and DOX suppress proliferation and induce apoptosis in GSCs via regulating PI3K/Akt/mTOR signaling.
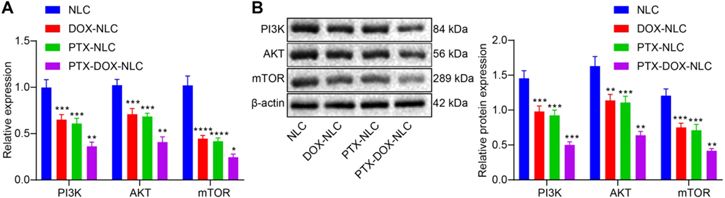
Figure 4. Mechanisms of PTX-DOX-NLC on GSCs. (A) RT-qPCR detection of mRNA expression of PI3K, Akt, and mTOR in GSCs from indicated group. (B) Western blot analysis for determination of protein expression of PI3K, Akt, and mTOR in GSCs from indicated group. Measurement data were expressed as mean ± standard deviation. Comparison among multiple groups was conducted by one-way ANOVA with Tukey's post hoc test. *p < 0.05; **, p < 0.01; ***, p < 0.005; ****, p < 0.001. Three biological replicates were set.
Download figure:
Standard image High-resolution image3.5. PTX-DOX-NLC inhibits glioma progression via suppressing PI3K/Akt/mTOR signaling in GSCs
To further evaluate our speculation that PTX-DOX-NLC inhibits glioma growth via suppressing proliferation and inducing apoptosis in GSCs by regulating PI3K/Akt/mTOR signaling, a human xenograft model of glioma was established in mice. For this purpose, nude mice transplanted with CD133+ cells were randomly divided into 6 groups, and received different treatments for 21 consecutive days, and the tumor growth curve were plotted 30 days post drug administration. The result showed that the growth of xenograft tumors was significantly inhibited by free DOX, free PTX, DOX-NLC, PTX-NLC, and PTX-DOX-NLC, compared with growth in the mice treated with NLC alone. More importantly, the inhibitory effects were most significant in the PTX-DOX-NLC treated group (figure 5(A)). Meanwhile, the body weight of nude mice was also monitored, which showed no difference among the groups, suggesting that the drug injection had no conspicuous toxic side effects for nude mice (figure 5(B)). In addition, the liver (ALP, AST, and ALT) and renal (BUN) functional markers were also monitored after injection of PTX-DOX-NLC or PBS, and no significant difference was observed, suggesting no conspicuous metabolic toxic side effects to nude mice (figure S1 (available online at stacks.iop.org/NANO/32/225101/mmedia)). After the mice were euthanized, the tumors were removed and weighed, which showed reduced weight in the mice treated with free DOX, free PTX, DOX-NLC, PTX-NLC, and PTX-DOX-NLC, compared with those treated with NLC alone, with the inhibitory effect being the most significant in the PTX-DOX-NLC treated mice (figure 5(C)).
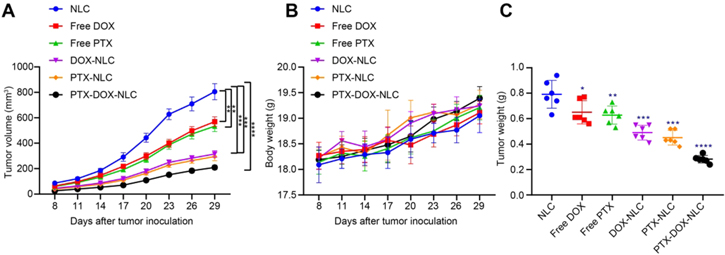
Figure 5. PTX-DOX-NLC restrains the proliferation and promotes apoptosis of GSCs by inhibiting the PI3K/Akt/mTOR signaling. (A) The xenograft tumor growth curve in nude mice after injection with different NLCs for 21 d. (B) Tumor weight of nude mice determined at 30 days post drug administration. (C) Tumor volume of nude mice measured at 30 d post drug administration. Measurement data were expressed as mean ± standard deviation. Comparison among multiple groups was conducted by one-way ANOVA with Tukey's post hoc test. Repeated measurement ANOVA with Bonferroni's post hoc test was used to compare tumor data at different time points. *p < 0.05. **p < 0.01; ***p < 0.005; ****p < 0.001.
Download figure:
Standard image High-resolution imageWe further analyzed the expression of a GSC marker (CD133), proliferation marker (ki67), key proteins of PI3K/AKT/mTOR signaling (p-PI3K, p-AKT, and mTOR), and caspase3 in the xenograft tumors (figure S2). The result showed that, compared with control group in which mice were treated with NLC alone, the expression of CD133, ki67, p-PI3K, p-AKT, and mTOR was decreased and caspase3 was increased by the treatments of free DOX, free PTX, DOX-NLC, PTX-NLC, as well as PTX-DOX-NLC. Moreover, the treatment with PTX-DOX-NLC resulted in the most significant effects (figure 5(D)). Thus, we concluded that PTX-DOX-NLC could suppress the proliferation and accelerate apoptosis of GSCs by inhibiting the PI3K/Akt/mTOR signaling in vivo.
4. Discussion
Currently, nanomedicine along with other new drug delivery technology is exerting increasing impacts on modern medicine, especially in the context of the development of new cancer diagnosis and treatment methods [29]. Accumulating evidence has revealed that NLCs can deliver anti-drugs to cancer cells to treat various cancers such as glioma [30]. Moreover, it has been recently documented that DOX and PTX both contribute to glioma treatment [31, 32]. DOX is a hydrophilic anthracycline compound with the property of binding to DNA and inhibiting nucleic acid synthesis, while PTX, an antimicrotubule agent, promotes microtubule assembly from tubulin dimers and stabilizes microtubules by preventing depolymerization [33]. The combination of DOX and PTX in nano-loaded forms for cancer treatment showed enhanced response rate and patient survival rate due to the synergist effects of different mechanism of DOX and PTX on cancer cells [34]. Additionally, these two drugs do not exhibit cross-resistance in cancer treatment [35]. Thus, the current study mainly explored the potential of loading PTX and DOX into NLCs and its role in GSC proliferation and apoptosis via effects on related molecular mechanisms. Our data mainly demonstrated that PTX-DOX-NLCs suppressed the proliferation and accelerate apoptosis of GSCs by blocking the PI3K/Akt/mTOR signaling.
Our initial finding was that PTX-DOX-NLCs could inhibit viability, proliferation as well as survival of GSCs. Novel nanoparticles with peptide functionalization and high drug loading are applied as a drug delivery system for regulating and controlling the release of PTX to glioma [36]. Findings obtained from a previous study have demonstrated that nanosized lipodisks carrying PTX possess tumor-suppressing properties in glioma [37]. Delivery of PTX by dual-modified cationic liposomes has been shown to trigger GSC apoptosis and impede tumorigenesis in glioma [38]. In addition, another research reports that nanoparticles with Tyr-3-octreotide modification possess great potential for treatment of glioma [39]. Besides, oxidized nanocrystalline mesoporous carbon particle, a potential drug delivery vehicle, which is conductive to delivering DOX into glioma, exerts an inhibitory effect in the development of glioma [40]. A hypoxic radiosensitizer-polyprodrug nanoparticle carries DOX into glioma cells, releasing DOX under hypoxic conditions, which, in turn, contributes to glioma chemotherapy and radiotherapy [41]. Superparamagnetic iron oxide nanoparticles harboring DOX and indocyanine into glioma cells exhibits a promotive role in anti-glioma treatment efficacy [42]. All these results concur with present results in showing potential of new drug delivery systems.
The present study also confirmed that blocking of PI3K/Akt/mTOR signaling conferred pro-apoptotic and anti-proliferation role of PTX-DOX-NLCs in GSCs, as evidenced by reduced expressions of PI3K, Akt and mTOR. Hyperactivation of PI3K/Akt/mTOR signaling has been demonstrated in most gliomas [43]. Similar to our results, layered double hydroxide nanoparticles loading with etoposide exhibited a satisfactory result in reversing chemoresistance and eradicating GSCs via suppression of PI3K/Akt/mTOR signaling [44]. Additionally, PI3K/Akt/mTOR signaling participates in the regulation of radiation-resistance in GSCs [45], whereas, a corroborating study recently demonstrated that blocking of PI3K/Akt/mTOR signaling could lead to an inhibited self-renewal and tumorigenic ability of GSCs [46]. More importantly, the promotion of chemosensitivity of PTX can be achieved by suppression of PI3K/Akt/mTOR signaling [47].
Lastly, the present study also validated that PTX-DOX-NLC was able to suppress the proliferation and facilitate apoptosis of GSCs in a mouse glioma model by blocking the PI3K/Akt/mTOR signaling, as reflected by reduction in expressions of CD133, ki67, p-PI3K, p-Akt, mTOR and elevation in caspase3 expression. CD133, one of the tumor stem cell markers, has often been reported in the pathogenesis of human glioma, where a high level is associated with poor overall survival in patients with gliomas [48]. It is well-documented that ki67 serves as a proliferation marker, which has become a potential anti-cancer target due to its characteristic overexpression in malignant cells, while being almost undetectable in normal cells [49]. Caspase-3, a member of cysteine proteases family, is responsible for most of the proteolysis occurring during apoptosis, such that determination of cleaved caspase-3 activity is thought as a reliable marker of apoptosis [50]. Recent evidence has suggested that nanoparticles carrying DOX into tumors promoted cell apoptosis and suppressed cell proliferation in glioma in vitro and in vivo [51]. PTX is greatly beneficial to stimulating apoptosis of glioma cells and increasing the survival time of glioma-bearing rats via the involvement of Akt inhibition [52]. Other research showed that PTX-loaded nanoparticles increase the survival time of glioma xenograft mice [53]. Thus, lines of evidence provided by previous research supports our proposal that co-delivery of PTX and DOX into glioma results in cell apoptosis of glioma [54].
5. Conclusion
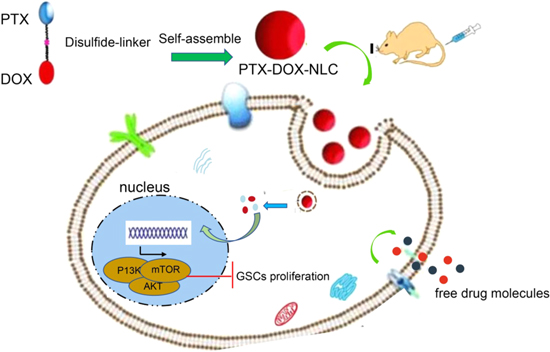
In summary, these findings in our study collectively demonstrated that NLCs could deliver PTX and DOX simultaneously into GSCs to restrain proliferation and stimulate apoptosis of GSCs via inhibiting the PI3K/Akt/mTOR signaling (figure 6). Therefore, our exploration of PTX and DOX loaded NLCs yields a better understanding of their regulatory mechanisms in GSCs, which might present a novel potential therapeutic strategy for glioma treatment. Besides, we propose that NLCs may function as a useful nanocarrier of anti-cancer drugs.
Figure 6. Schematic diagram of the molecular mechanisms by which PTX-DOX-NLC arrests glioma progression by mediating the PI3K/AKT/mTOR signaling.
Download figure:
Standard image High-resolution image
Funding sources
None.
Conflict of interest
All authors declared no conflicts of interest.