

Abstract
In this work, sponge impregnated with iron pentacarbonyl was utilized to obtain a novel composite in which the carbonyl iron (CI) was embedded in a graphitized carbon matrix (CI-C). The CI that results from the thermal pyrolysis of iron pentacarbonyl can homogeneously disperse into the pore structures of the sponge skeleton, which not only improves the stability of the CI, but also modifies the impedance matching character. Moreover, the sponge bulk turns into graphitized carbon during the heat treatment (graphitized catalysis of magnetic metal on carbon at high temperature). Due to the respective strong dissipation ability of CI and the graphitized carbon matrix, the as-prepared CI-C sample exhibits a good microwave absorption performance, including expanding the effective absorption bandwidth and reduced weight, compared to pure CI. Moreover, the sample with 30 wt% paraffin loading not only shows strong reflection loss absorbing ability, but also possesses continuous dual-absorption peaks (9.96 GHz, −38.7 dB, and 13.8 GHz is −37.6 dB). This work not only extends the application of carbonyl iron as a lightweight microwave absorber with dual-absorption peaks but also initiates a new approach for artificially designed carbon-based composites via a simple sponge-impregnation method.
Export citation and abstract BibTeX RIS
Introduction
Over recent decades, electromagnetic (EM) energy has attracted much attention due to its indispensability in various fields, from daily life to industrial manufacture, and even in national defense and space exploration [1–3]. Too much radiant energy poses a serious threat to human health [4, 5]. Research on EM energy harvest and conservation to govern EM pollution has become a hot topic throughout the world [6, 7]. As far as impedance matching is concerned, a masterly design of dielectric/magnetic media heterojunction composites seems to be of great importance. NiFe2O4-rGO has been successfully prepared using a facile strategy for confined implantation of NiFe2O4 clusters. The tailored NiFe2O4 clusters tune the EM absorption properties [8]. Monodisperse Fe3O4/C core–shell nanosheets were synthesized by a facile and low-cost carbothermal reduction approach using α-Fe2O3 nanosheets as precursors. The composites containing 250 nm nanosheets reach a maximum reflection loss (RL) of −43.95 dB at 3.92 GHz [9].
Although much work about dielectric/magnetic composites has been completed, there still exists a relatively big gap between complex permittivity εr and permeability μr. Given that, magnetic media with higher magnetic properties are required. Recently, it has been demonstrated that carbonyl iron (CI) has great potential as EM wave absorbing material because of its fantastic properties including relatively high permeability (μr) and high saturation magnetization (Ms) at the microwave frequency band [10, 11]. However, the chemical/physical properties of CI may restrict its combination with other ingredients. Commercial CI cannot be well dispersed in common solvent due to its strong polarity as well as its high density [12]. Given the challenges, metal-organic chemical vapor deposition (MOCVD) technology was developed. Highly purified Fe(CO)5 was employed as a raw material, and CI can be acquired during thermal decomposition procedures. In consideration of the characteristics of the precursor Fe(CO)5, a typical biomass precursor (the sponge) was selected. Sponge is a kind of flexible and porous material with low density and good solvent absorbing capacity [13, 14].
Firstly, iron pentacarbonyl solution was fully absorbed by sheared sponge. Then the bulk was dried in air and heated in a nitrogen atmosphere. Due to the restriction of the sponge skeleton, the obtained CI particles were uniformly dispersed inside the pore architectures. In addition, sponge bulk would turn into graphitized carbon during the heat treatment (original organic chemical bonds break and get bonded again) and catalysis of the resulting iron (graphitized catalysis of magnetic metal on carbon at high temperature) [15, 16]. Benefiting from the uniform embedded CI on a carbon matrix, not only is the stability of CI improved, but also the holistic impedance matching is modified [17]. Coupled with the strong dissipation capacity of CI and graphitized carbon, the as-prepared sample with different paraffin loading content (50 wt%, 40 wt% and 30 wt%) exhibit excellent microwave absorption performances (expanding bandwidth and reduced weight). It is worth noting that sample SP73 not only exhibits strong RL absorbing ability, but also possesses continuous dual-absorption peaks. The first absorption peak at 9.96 GHz possesses an RL value of −38.7 dB, and the RL value of another peak at 13.8 GHz is −37.6 dB. This work not only optimizes the microwave absorption performance of CI, but also illustrates the interior mechanisms for dual-absorption peaks.
Experimental
Preparation of IP-sponge
Iron pentacarbonyl (IP) impregnated sponge was obtained by the following process. A sponge bulk of 60 × 60 × 100 mm3 was immersed into IP solution for 5 min to fully absorb the IP solution, then it was dried in the vacuum oven at 60 °C for 3 h to remove the redundant IP and organic solvent. The obtained precursors are named IP-sponge.
Preparation of CI-embedded carbon matrix (CI-C)
The IP-sponge bulk was annealed under a sequential heating procedure (procedure one: 5 °C min−1, 300 °C, 30 min; procedure two: 3 °C min−1, 600 °C, 5 h) in a nitrogen atmosphere. After the reaction decreased to room temperature, CI-embedded carbon matrix was obtained, which is denoted as CI-C. As a comparison, sponge bulk without impregnation was also calcinated under the same conditions as that of the IP-sponge bulk, and the obtained pure carbon sample is named PC. In addition, a mixture of CI powder and carbon powder was also obtained by simply mechanically mixing the commercial CI powder and carbon powder (production obtained by heat treatment of pure sponge) together, and the mixture is denoted as MS. In addition, the samples with 50 wt%, 40 wt%, and 30 wt% paraffin loading are named as SP55, SP64 and SP73, respectively.
Measurement
The obtained samples were characterized by x-ray diffractometer (XRD, Bruker D8 ADVANCE), Raman spectroscopy (Renishaw InVia), scanning electron microscope (SEM, Hitachi S4800), transmission electron microscopy (TEM, JEOL JSM-2010), BET (ASAP 2010), vibrating sample magnetometer (VSM, Lakeshore, Model 7400 series) and so on. The electromagnetic parameters were obtained by homogeneously mixing paraffin and as-prepared samples with the toroidal-shaped test specimens (Φin: 3.04 mm, Φout: 7.00 mm) using Agilent PNA N5244A vector network analyzer.
Results and discussion
A simple flow chart of the sample preparation process is presented in figure 1(a). Sponge is a kind of porous material with a strong ability to absorb solvent. IP solution was fully absorbed by sheared sponge. Then the bulk was dried in air for a period of time. After a heat treatment at low temperature (below 300 °C), the carbonyl iron was slowly generated with the decomposition of IP following the equation Fe(CO)5 = Fe + 5CO. Due to the restriction of the sponge skeleton, the obtained CI particles were uniformly dispersed inside the pore architectures. Meanwhile, sponge bulk would turn into graphitized carbon during the heat treatment (original organic chemical bonds break and get bonded again) and catalysis of the resulting iron (graphitized catalysis of magnetic metal on carbon at high temperature). As can be seen from figure 1(b), three obvious diffraction peaks can be matched completely with the lattice planes of iron, indicating the successful preparation of CI. Interestingly, it is hard to detect the diffraction peaks of carbon due to the rather strong diffraction intensity of CI. Hence, a magnification of the XRD spectrum (red curve) between 10 to 45 was also conducted. The two distinct diffraction peaks demonstrate the acquisition of graphitized carbon. For comparison, sample PC, which is obtained from the pyrolysis of pure sponge without impregnation of IP, is simply amorphous carbon (figure S1 is available online at stacks.iop.org/NANO/30/195703/mmedia). The Raman spectrum of the CI-C sample is shown in figure 1(c). Two characteristic bands at around 1369 cm−1 (D band) and 1581 cm−1 (G band) can be clearly observed. In general, the intensity ratio of band D to band G (ID/IG) is often used to characterize the graphitization degree, where the D band corresponds to sp3 carbon atoms and the G band corresponds to sp2 carbon atoms from the nano-graphite structures. The calculated ID/IG values of CI-C and PC are 0.90 and 0.97, respectively, which indicates the better graphitization degree of CI-C than that of PC [18].
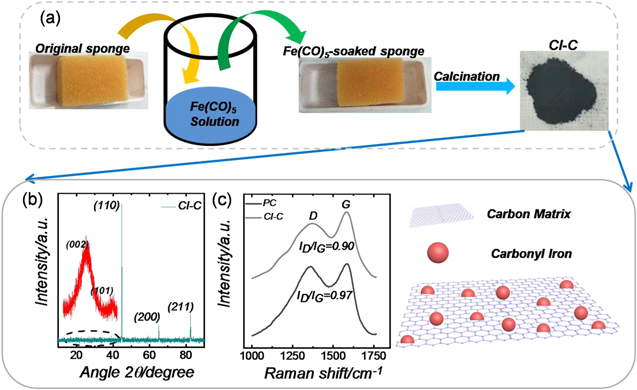
Figure 1. Flow chart of sample preparation illustrated with a picture of visual products (a), XRD pattern of CI-C sample (red curves in the inset are the magnification spectrum between 10 to 45°) (b), Raman spectra of PC and CI-C samples (c).
Download figure:
Standard image High-resolution imageIn order to evaluate the variation in the specific surface and the porosity of samples, the nitrogen adsorption-desorption test was carried out, as shown in figure 2. The isotherm of the CI-C sample shows a typical IUPAC type IV pattern with a sharp upturn at the high pressure region. The hysteresis loop exhibits a combination of H1 and H3 characteristics that correspond to cylindrical and slit-shaped pore geometries structures, respectively [19, 20]. The surface area of the CI-C sample is about 71.25 m2 g−1, and the concentrated distribution of pore size between 0–25 nm indicates the acquisition of mesoporous carbon materials.
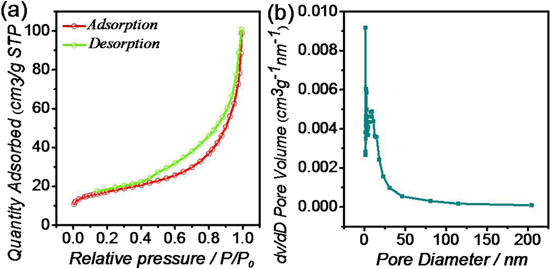
Figure 2. Nitrogen absorption-desorption isotherms (a) and corresponding Barret–Joyner–Halenda pore-size distribution (b) of CI-C samples.
Download figure:
Standard image High-resolution imageMorphology and composition analysis were also done by SEM, TEM and TEM-EDS technologies. As seen from figures 3(a) and (b), the CI-C composites exhibit a porous nature with different sizes of particles embedded. In order to explore the specific composition of the composites, the related EDS spectra were shown in different areas of figures 3(c) and (d). Both of the elemental EDS spectra reveal that the composite is composed of elements Fe and C. From figure 3(c), the atomic ratio of iron for the selected region (figure 3(a)) is 40.74 wt%. When the selection area concentrates on the particles of figure 3(b), the related atomic ratio of iron increases dramatically (figure 3(d)), reflecting that the embedded particles may be carbonyl iron. Furthermore, carbon element is homogeneously distributed in the composite base (figure 3(f)), and particles or aggregated particles correspond to iron element (figure 3(g)), which is in accordance with the result of the EDS spectra. The results are also proved by the TEM images in figures 4(a)–(h). Some agglomeration can be found, which is derived from the unexpected crystal growth during thermal decomposition.
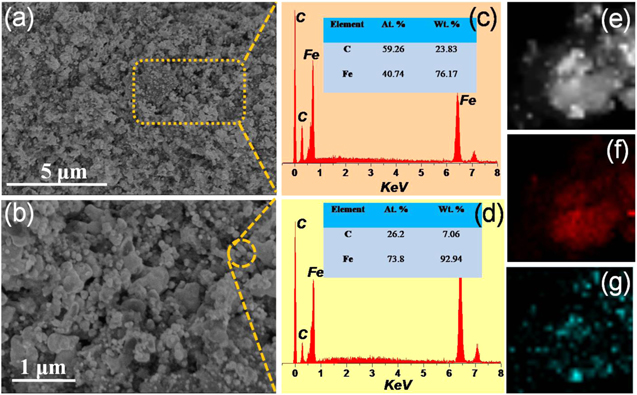
Figure 3. SEM images (a), (b) of CI-C sample; EDS spectra (c), (d) for CI-C sample from the selected areas from (a) and (b); EDS mapping of elements C (f) and Fe (g) of image (e) for sample CI-C.
Download figure:
Standard image High-resolution image
Figure 4. TEM images of CI-C sample at different magnifications.
Download figure:
Standard image High-resolution imageTo explore the electromagnetic absorption performance of the as-prepared CI-C sample, electromagnetic parameters were obtained using a vector network analyzer. As presented in figure 5, the complex permittivity of samples varies a lot from SP55 to SP73. Sample SP73 exhibits a distinct dielectric resonance behavior, which is beneficial to its great microwave absorbing performance as well as the dual absorption peaks. Due to the different paraffin loading contents, we may infer that the proper paraffin content-derived interfacial polarization of SP73 results in the strong dielectric resonance. In contrast, complex permeability varies at a relatively small scope. The increasing imaginary permeability values of three samples indicate the enhanced magnetic loss ability. 3D plots of RL values versus frequency and thickness, 2D curves of microwave absorption at different thicknesses for samples SP55, SP64 and SP73 were all calculated using the measured complex electromagnetic parameters based on the transmission line theory [21, 22].


where Zin is the input characteristic impedance, Z0 represents the impedance of free space, εr and μr are complex electromagnetic parameters, c is the light velocity, and d is the absorber thickness. As can be seen from figure 6, sample SP55 exhibits common microwave absorption performance, with an RL value of below −10 dB. As the paraffin loading content decreases, the microwave absorbing ability gradually increases [23, 24]. In addition, all the samples show an absorption response towards low frequency with increasing thickness. It is worth noting that sample SP73 not only exhibits a strong RL absorbing ability, but also possesses continuous dual-absorption peaks [25]. The first absorption peak at 9.96 GHz possesses an RL value of −38.7 dB, and the RL value of another peak at 13.8 GHz is −37.6 dB. In order to prove the performance superiority of the as-prepared samples, sample MS was also prepared by simply mechanically mixing CI powder with carbon powder (production obtained by heat treatment of pure sponge). Its electromagnetic parameters (figure S2) are much lower than those of sample CI-C, basically equal to pure CI. Similarly, the microwave absorption performance (figure S3) is also not outstanding, which is mainly due to the little contribution of conduction loss and interfacial polarization. The results demonstrate the performance superiority of sample CI-C.

Figure 5. Electromagnetic parameters of samples SP55, SP64, and SP73.
Download figure:
Standard image High-resolution image
Figure 6. 3D representation of RL values versus frequency and thickness; 2D curves of microwave absorption at different thicknesses for sample SP55 (a)–(c); SP64 (d)–(f); and SP73 (g)–(i).
Download figure:
Standard image High-resolution imageGenerally, attenuation capacity and impedance matching are the main standards when judging the electromagnetic absorption mechanisms. Attenuation constant α can be expressed by [26, 27]
The equation shows that the imaginary part of electromagnetism (ε'', μ'') is crucial to the enhancement of microwave attenuation. Moreover, impedance matching is also characterized by impedance matching ratio Z, which is obtained based on the following equation [28].

It reveals that the key point in increasing the introduction of microwaves is to shorten the gap between complex permittivity and permeability. It can be found from figure 7 that impedance matching and attenuation ability are negatively correlated. Take sample SP55 as an example; its dissipation capacity is too low to give a strong microwave absorption performance, although its impedance matching is relatively high. It suggests that a balance between microwave introduction and consumption is important [29].
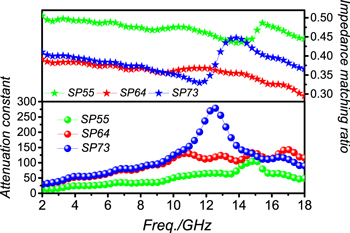
Figure 7. Attenuation constant (α) and impedance matching ratio (Z) for samples SP55, SP64 and SP73.
Download figure:
Standard image High-resolution imageThe dielectric dissipation mechanisms [30] are first studied based on the dielectric loss tangent and Cole–Cole curves. Dielectric loss tangent tan δε (ε''/ε') is often used to characterize the general dielectric attenuation ability. We can find out from the equation that the imaginary permittivity is the essential part in improving the dielectric dissipation capacity. Figure 8(a) shows that sample SP73 possesses a really high tan δε value in the frequency region of 11–14 GHz, indicating its strong dielectric attenuation ability in that frequency range. Dielectric polarization processes are also detected according to Cole–Cole curves. A semicircle in the curves represents one dielectric polarization process [31]. More semicircles, more dielectric polarization processes. As can be seen from figures 8(b)–(d), all samples exhibit evident dielectric polarization processes. However, sample SP64 has more polarization processes (more semicircles) than the other samples.
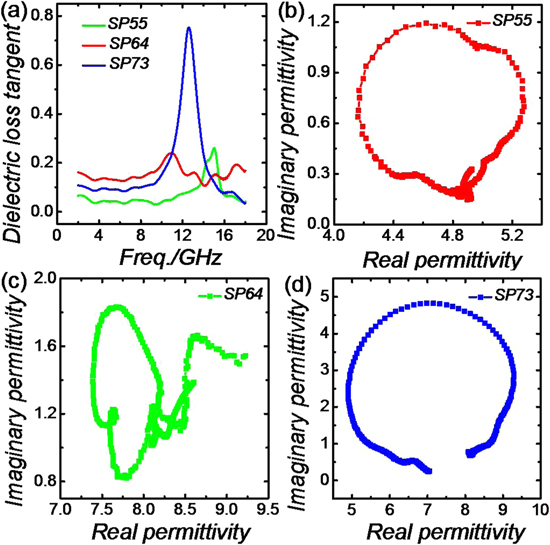
Figure 8. Dielectric loss tangent of samples SP55, SP64 and SP73 (a). Cole–Cole curves of SP55 (b), SP64 (b), and SP73 (c).
Download figure:
Standard image High-resolution imageThe magnetic dissipation mechanisms are also detected by magnetic loss tan δμ (μ''/μ'), hysteresis loop, eddy current and dimensional resonance. Magnetic loss tangent is often used to calculate the general magnetic attenuation ability. From figure 9(a), the magnetic loss ability improves gradually from SP55 to SP73, indicating the enhanced magnetic loss capacity. For the sample CI-C (figure 9(b)), the saturation magnetization (Ms) values and coercivity (Hc) value are 176.2 emu g−1 and 95.5 Oe, respectively. Strong magnetic behavior and hysteresis mainly originate from the embedded CI particles. An eddy current is also detected to find out whether it contributes much to the magnetic dissipation process. The eddy current is derived from the magnetic flux density change in the applied EM field, and is related to thickness (d) and the conductivity of absorbers [32, 33]:

If the magnetic attenuation just originated from the eddy current, C0 values would be a constant with the increasing frequency. As can be seen from figure 9(c), the C0 values of all the samples vary a lot at the tested frequency, which demonstrates that the eddy current is not the dominant contributor in determining electromagnetic wave absorption in this work. In addition, dimensional resonance is also researched based on the equation [21]:

If the resonance peak results from dimensional resonance, the absorber thickness d would be equal to an integral multiple of half a wavelength. The wavelength was calculated by the following equation:

After a comparison between practical d and calculated wavelength (figures 9(d)–(f)), obviously the d is not equal to the integral multiple of half a wavelength. The result also eliminates the possibility of dimensional resonance acting in the enhanced microwave absorption.
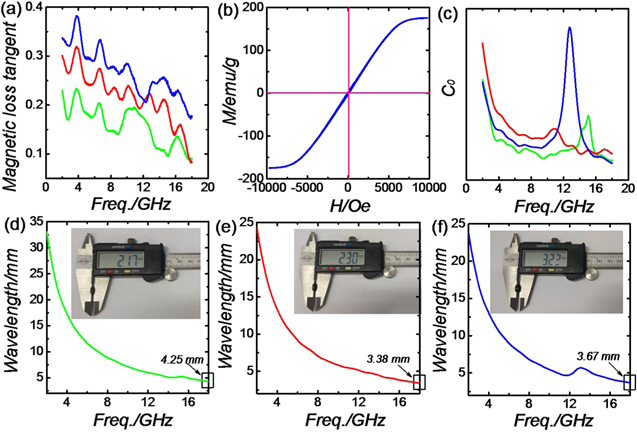
Figure 9. Magnetic loss tangent and eddy current of three paraffin-mixed samples (a), (c); hysteresis loop of CI-C sample (b); frequency dependence of the electromagnetic wave transmitting in sample SP55 (d), SP64 (e), and SP73 (f). Inset shows photographs of thickness, tested using Vernier caliper.
Download figure:
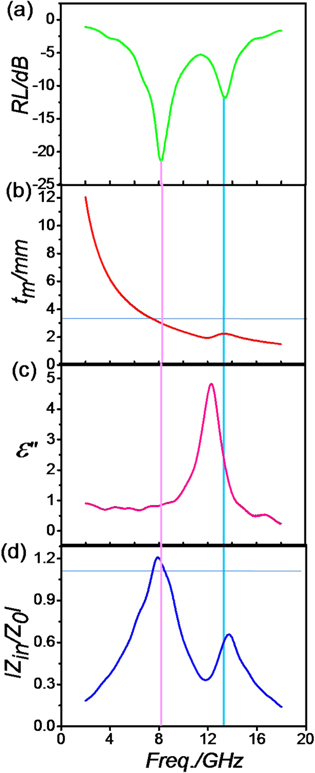
Standard image High-resolution imageFurther detailed studies of dual-absorption peaks are carried out for sample SP73. Here, we take the RL curves at 3.3 mm as an example to analyze the related mechanisms behind the two absorption peaks. The two RL peaks mainly appear at 8.2 GHz and 13.4 GHz, respectively (figure 10(a)). As seen from figure 10(b), the experimental thickness (3.3 mm) is consistent with the simulation thickness, which demonstrates that the first resonance absorption is derived from interference dissipation [34]. As seen from figure 10(c), the dielectric resonance locates at the region of 11–15 GHz. Although the secondary absorption peak (13.4 GHz) does not lie in the peak of dielectric resonance in ε'', it basically demonstrates that the secondary absorption peak is derived from dielectric resonance [35]. Moreover, we deduce that the shift of maximum absorption peak is derived from other factors like magnetic resonance or interfacial effect. The impedance matching values are both not equal to 1.0 (figure 10(d)), which suggests to us that further research on microwave introduction into the interior of the absorber is required.
Figure 10. RL value (a), calculated theoretical thickness under λ/4 conditions (b), imaginary permittivity (c), and normalized impedance matching ǀZin/Z0ǀ at 3.3 mm of matching thickness.
Download figure:
Standard image High-resolution image
Conclusions
In summary, CI embedded graphitized CI-C was fabricated by simply calcinating iron pentacarbonyl immersed sponge. After the heat treatment, CI particles were homogeneously dispersed into the skeleton of the sponge, which not only improved the stability of the CI, but also modified the materials' impedance matching characters. In addition, the sponge would also become graphitized carbon during the thermal treatment. Benefiting from the strong attenuation ability of CI and graphitized carbon, the as-prepared CI-C sample shows much enhanced microwave absorption ability (wide bandwidth and lightweight). When the paraffin loading content is 30 wt%, the composite appears to have dual-absorption peaks at 9.96 GHz (38.7 dB) and 13.8 GHz (−37.6 dB), respectively. The designed sample not only optimizes the microwave absorption performance of pure CI, but also demonstrates the mechanisms of dual-absorption peaks.
Acknowledgments
Financial support from the Aeronautics Science Foundation of China (2017ZF52066), the National Nature Science Foundation of China (11575085), the Qing Lan Project, Six Talent Peaks Project in Jiangsu Province (No. XCL-035), Funding for Outstanding Doctoral Dissertation in NUAA (BCXJ 18–07), the China Scholarships Council program (No. 201806830013), the Open Research Fund of Jiangsu Provincial Key Laboratory for Nanotechnology of Nanjing University, Jiangsu 333 Talent Project, and the Priority Academic Program Development of Jiangsu Higher Education Institutions (PAPD) are gratefully acknowledged.