

Abstract
Visible-light-active freestanding zirconia (ZrO2) nanotube (FSZNT) arrays were fabricated by a facile electrochemical anodization method in fluoride containing ethylene glycol electrolyte added to it was 1 vol% of potassium carbonate (K2CO3) at 60 V for 1 h. Poor adhesion at the metal∣oxide interface was induced by K2CO3 leading to the formation of FSZNT flakes. The effect of the crystal structures of the FSZNTs e.g., amorphous, amorphous/tetragonal, and tetragonal/monoclinic was investigated towards the photocatalytic reduction of 10 ppm hexavalent chromium, Cr(VI) at pH 2 under sunlight. The results demonstrate the amorphous FSZNTs exhibited the highest Cr(VI) removal efficiency than the crystalline FSZNTs (95% versus 33% after 5 h). The high photocatalytic activity of the amorphous FSZNTs can be attributed to enhanced Cr(VI) adsorption, high visible light absorption, and better charge carrier separation. The low photocatalytic activity of the crystalline FSZNTs annealed at 500 °C was mainly attributed to poor Cr(VI) adsorption, low visible light absorption, and less photoactive monoclinic-ZrO2.
Export citation and abstract BibTeX RIS
1. Introduction
Hexavalent chromium (Cr(VI)) compounds are usually released from industries like steelmaking [1], tanneries, electroplating, leather, and textile coloring [2]. Depending on the pH, Cr(VI) in the environment can exist as chromate  hydrogen chromate
  or dichromate
  These compounds are strong oxidizing agents and hence are rather corrosive and appear to be much more toxic systemically than trivalent chromium, Cr(III) [3]. The exposure to Cr(VI) can leads to skin and stomach irritation or ulceration, dermatitis, liver damage, kidney circulation, nerve tissue damage, and death [4]. Cr(VI) has been classified as a Group 1 human carcinogen by the International Agency for Research on Cancer and as a Group A inhalation carcinogen by the US Environmental Protection Agency (US-EPA) [5]. As recommended by the US-EPA, the maximum permissible limit for Cr(VI) in drinking water is 0.1 mg L−1 [6]. Therefore, it is essential to keep the concentration of Cr(VI) in wastewater below this limit before it can be safely discharged to the environment. Moreover, Cr(VI) is highly mobile than Cr(III) and more difficult to be removed from water. Therefore, the presence of Cr(VI) ions in wastewater from industrial establishment, even in minute concentration must be minimized.
There are several conventional methods to remove Cr(VI) from industrial wastewater such as adsorption, membrane filtration, ion exchange, and electrochemical treatment [4]. However, the drawbacks of these methods are incomplete removal, high energy consumption and operational cost, and generation of waste products that need an additional method for safe disposal [7]. Alternatively, Cr(VI) in wastewater can be converted to less toxic and less mobile Cr(III) by reduction process. Reduction can happen in a presence of an electron donor introduced in the Cr(VI) loaded wastewater. Electron donors can also be generated on a semiconductor material by irradiating the material with light of appropriate photon energy. The photogenerated electrons must however have sufficient potential to reduce Cr(VI) to Cr(III). Once reduced, the formed Cr(III) can be precipitated out of solution in the form of Cr(OH)3. This photocatalytic reduction approach achieves both a reduction in Cr toxicity and removal of the Cr from wastewater provided by a suitable semiconductor and available light source (preferably sunlight) at the treatment site.
Zirconia (ZrO2) is a n-type semiconductor with a band gap, Eg ∼ 5–6 eV [8]. High negative value of the conduction band (CB) edge makes ZrO2 as a suitable photocatalyst for water splitting [9, 10], oxidation organic dyes [11, 12], and reduction of inorganic contaminants [13–16]. Nevertheless, the wide band gap of ZrO2 restricts its use under ultraviolet (UV) irradiation which accounts for less than 5% of the solar energy [17]. Therefore, numerous studies have been devoted to extend the light absorption of ZrO2 under visible light irradiation such as by coupling with other oxide [18], or doping with metal [19] and/or non-metal elements [20]. Defective and disordered ZrO2 has also attracted attention from researchers for the formation of visible light induced photocatalytic process [21].
Photocatalytic studies have always been performed using crystalline ZrO2 with little attention been paid on amorphous ZrO2. It is commonly accepted that the amorphous oxide contains high concentration of defects which inhibit charge carriers migration leading to the rapid electron–hole  recombination [22]. Conversely, enhanced photocatalytic activity of the amorphous oxides had been reported by several researchers for photoreduction of Cr(VI) [23], photodegradation of methylene blue [24], and photodegradation of rhodamine B and 4-chlorophenol [25]. Therefore, the structural disorder in the amorphous oxide may not be essentially detrimental for achieving an effective photocatalyst.
In this work, ZrO2 nanotubes (ZNTs) were produced by anodization of zirconium (Zr) foil in fluoride ethylene glycol (EG) electrolyte. The as-anodized nanotubes were well-aligned and rather amorphous [11, 15, 16, 26]. Moreover, as the electrochemical anodization process is controlled by ionic migration across the growing oxide, the ZNTs are expected to have significant amount of structural defects [27] and ionic contamination [28]. Here, we also observed that the anodic ZrO2 film formed was easily detached from the underlying Zr substrate which we concluded due to the presence of K2CO3 in the EG electrolyte. We then intentionally removed the anodic ZrO2 from the substrate as to yield the freestanding ZrO2 nanotube (FSZNT) arrays in a form of loose flakes. There are two main approaches implemented for the fabrication of FSZNTs in the literature: anodization parameters regulation [11, 29, 30] and chemically induced delamination [31]. Here, the first approach was adopted. The presence of K2CO3 in EG was found to be beneficial in reducing the adhesion of the anodic film mainly due to CO2 gas generation at the oxide∣metal interface [10, 15].
The use of FSZNTs in Cr(VI) reduction process offer several advantages: the photocatalytic reduction ability of the oxide can be precisely evaluated as the oxide is free from the influence of the Zr substrate, the exact amount of catalysts loading can be determined, utilization of both sides of the nanotubes, and minimization of substrate leaching in acidified Cr(VI) solution. In fact, the use of ZrO2 in nanotubular structure has much more advantages than bulk oxide. ZNTs have been reported to exhibit superior performance in several applications due to their large specific surface area, quantum confinement effect, and high concentration of surface defect states [32]. For instance Qin et al [33] observed rapid Cr(VI) removal on nanotubes compared to nanosheets indicating that morphology of the oxide plays a vital role in determining the properties of the material. Moreover, aligned nanotubes are expected to display much better carriers transport especially along the long-axis of the oxide and hence recombination can be minimized. Often anodic nanotubes have wall thickness of <20 nm. As the wall thickness of the nanotubes is rather small, charge carriers can diffuse to the oxide surface with little hindrance reducing the recombination. Furthermore, well separated, and aligned nanotubes can display an efficient light harvesting property translating to more electrons generation. The incident light can also be trapped and scattered between nanotube walls or intertubes spacing leading to enhanced light penetration depth [34]. Again, this will lead to more charge carriers generation that can participate in Cr(VI) reduction process.
As mentioned, not a lot has been explored on the use of amorphous ZrO2 especially ZrO2 in nanotubular structure as photocatalyst to reduce the heavy metal ions. In this work, the effect of crystal structures (amorphous versus crystalline FSZNTs) was investigated towards photoreduction of Cr(VI) under sunlight. Crystallization of the oxide was done by varying the annealing temperature (300 °C–500 °C) subjected to the FSZNTs. Several characterization techniques including x-ray diffraction (XRD), high resolution transmission electron microscopy (HRTEM) and photoluminescence (PL) spectroscopy have been employed to correlate the crystallinity of the FSZNTs with their photoinduced activity. It is known that the PL from excited ZrO2 is dependent on the dimensionality of the oxide [35]. For instance, ZrO2 nanofibers displayed emission peaks at different position than spherical powders and display more stable red emission than nanoparticles [32]. Moreover, thermal annealing could also affects the PL emissions due to alteration in crystal structure and defects [35]. To the best of our knowledge, there is no report on the comparison between amorphous and crystalline FSZNTs as photocatalysts for Cr(VI) reduction to Cr(III) under visible light irradiation. An attempt is made here to correlate the structural properties of the FSZNTs to their ability in reducing Cr(VI) ions.
2. Materials and methods
2.1. Sample preparation
Pure Zr foils (0.25 mm thickness; 99.8% purity; Strem Chemicals, USA) were cut into 1 cm × 4 cm. The foils were ultrasonically cleaned in acetone, isopropanol, and ethanol, followed by rinsing in deionized water and air dried. The electrochemical setup was consisted of Zr foil as an anode and platinum as a cathode. The distance between anode and cathode was 30 mm. The anodization was carried out in electrolyte consisted of ethylene glycol (EG) +0.3 wt% ammonium fluoride (NH4F) + 1 vol% K2CO3 at 60 V for 1 h with a sweep rate of 1 V s−1. The electrolyte was vigorously stirred during the anodization process. Once completed, the anodized Zr was removed from the electrolyte bath and cleaned with acetone and deionized water before air dried. Upon drying the anodic film was seen to be easily peeled off but not uniformly from the substrate forming loose flakes of FSZNTs. The FSZNT flakes were then collected via series of anodization process. Then, the FSZNTs were annealed in air for 300 °C–500 °C with a heating rate of 5 °C min−1 for 2 h followed by natural convection cooling. Color changes were observed after annealing was completed.
2.2. Characterization
Morphologies of the as-anodized and annealed FSZNTs were observed under field emission scanning electron microscopy (FESEM; Variable Pressure, Zeiss Supra 35, Germany). The crystal structure was examined by XRD with Cu Kα1 radiation (XRD; Bruker D8, Bruker GmBH, Germany) and high resolution transmission electron microscopy (HRTEM; JEM-2100F, JEOL, Japan). Percentage of phases was quantitatively determined using the Panalytical Xpert Highscore Plus software via Rietveld refinement method. Surface functional groups were analysed using Fourier transform infrared spectroscopy (FTIR; Perkin Elmer, USA) by using the KBr pellet technique. Phase transition temperature was determined by using the thermogravimetry-differential thermal analysis (TG-DTA; Rigaku, Japan). PL spectrum was obtained using the monochromatic beam generated from He–Cd laser at excitation wavelength of 325 nm and recorded using a monochromator (Nikon G250, Japan). The UV-Visible absorbance spectra were recorded using the UV-Visible Spectroscopy (Perkin Elmer, USA).
2.3. Cr(VI) photoreduction
Photoreduction test was carried out by immersing 1 g L−1 of FSZNT flakes in 10 ppm Cr(VI) aqueous solution of potassium dichromate (K2Cr2O7) filled in a quartz tube as shown in figure 1. The pH of Cr(VI) solution was adjusted using sulfuric acid (H2SO4). Before irradiation, the reaction mixture was placed under dark for 1 h to allow the adsorption–desorption equilibrium at the interface of solid photocatalyst and Cr(VI) solution. Then, the samples were exposed under sunlight for 5 h. All the experiments were performed during the Sunny days (in Malaysia) from 10 am to 3 pm. During the course of light irradiation, 3 mL aliquot was withdrawn for every 1 h to monitor the decolouration of Cr(VI) solution. Cr(VI) reduction was determined colourimetrically at 540 nm using the diphenylcarbazide (DPC) method [36]. The concentration of Cr(VI) remaining in the solution was determined by using the UV-Visible spectrophotometry (Varian Cary 50 Conc; USA) at λmax = 540 nm [37]. The reusability of the FSZNTs photocatalyst was assessed by testing the samples under similar working conditions for three cycles. Prior to each cycle, the used FSZNT flakes were filtered and rinsed by deionized water several times before dried in oven at 80 °C for 1 h.
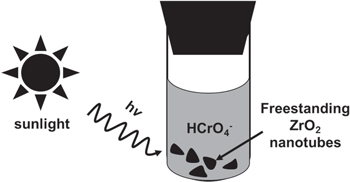
Figure 1. Cr(VI) solution photocatalytic reduction experiment in the presence of FSZNTs under sunlight illumination.
Download figure:
Standard image High-resolution image3. Results and discussion
Figure 2 shows FESEM micrographs of as-anodized and annealed FSZNTs (annealed at 300 °C, 400 °C, and 500 °C) and the corresponding photographs of the FSZNTs. The as-anodized FSZNTs are labeled here as FSZNTs-AA, whereas the annealed samples are designated as FSZNTs-annealing temperature (e.g. FSZNTs-300 represents the FSZNTs annealed at 300 °C). FSZNTs-AA as shown in figures 2(a), (b) have length of 13.6 μm [15] with outer diameter (Do), inner diameter (Di), and wall thickness (Wt) of 60.5 nm, 34.9 nm, and 12.8 nm, respectively. Brunauer–Emmett–Teller surface area of the FSZNTs-AA is 25.3 m2 g−1 [15]. The success in the formation of nanotubes in K2CO3 added EG is noteworthy as typically acidic electrolyte is needed for nanotubes formation. The mechanism of ZNTs formation in K2CO3 added EG was elaborated in our previous report [15]. Basically, K2CO3 weaken the adhesion at metal∣oxide interface due to the generation of CO2 gas [10, 15] during the course of anodization process. This can be evident from vigorous gas evolution at the Zr anode during the anodization process and their traces observed on the foil [10]. These observations were not obtained when K2CO3-free electrolyte was used [10]. With slight bending, the surface oxide was easily separated from the Zr foil forming flakes as shown in figure 2(c). The process can be repeated to yield significant amount of flakes which can be seen from the photograph in figure 2(c) as flat and brownish in color. However, once these flakes were annealed, they bent a bit due to stress relaxation as shown for FSZNTs-300 (figure 2(f)). The morphology of the FSZNTs-300 is however similar to as-anodized sample (figures 2(d) and (e)) indicating that the temperature used for annealing was too low for significant morphology changes. Similarly, the morphology of ZNTs annealed at 400 °C does not show obvious changes (figures 2(g) and (h)), but the color of the flakes changes to blackish-brown (figure 2(i)). However, annealing at 500 °C transformed parts of the tubes to particles as shown in figures 2(j) and (k). The corresponding photograph of ZNTs-500 in figure 2(l) shows that the flakes are whitish-brown in color.

Figure 2. FESEM micrographs of the as-anodized and annealed FSZNT flakes. Surface-views: figures (a), (d), (g), and (j), cross-sectional views: figures (b), (e), (h), and (k). The physical images of the nanotube flakes are shown in figures (c), (f), (i), and (l). Figures (a) and (b) reprinted from [15], Copyright (2017) with permission from Elsevier.
Download figure:
Standard image High-resolution imageFigure 3 shows the XRD patterns for the as-anodized and annealed FSZNTs. The corresponding ICSD reference patterns for monoclinic-ZrO2 (m-ZrO2) (ICSD #: 98-007-2021) and tetragonal-ZrO2 (t-ZrO2) (ICSD #: 98-002-8004) are shown in figures 3(e) and (f), respectively. The FSZNTs-AA are amorphous as indicated by the broad XRD peaks in figure 3(a). Little changes can be seen for FSZNTs-300 sample (figure 3(b)) but diffraction peak corresponding to (011) t-ZrO2 at 30.2° is starting to become more obvious. Therefore, FSZNTs-300 is thought to be predominantly amorphous with small crystallites of t-ZrO2. Increasing the annealing temperature to 400 °C resulted in the crystallization of both t-ZrO2 and m-ZrO2 (figures 3(c), (d)). From figure 3(c), strong t-ZrO2 peaks are observed at 30.2°, 35.3°, 50.3°, and 53.9° corresponding to (011), (110), (112), and (021) planes. m-ZrO2 phase on the other hand have prominent peaks at 24.4° (110), 28.2° (11  ), 31.5° (111), and 34.1° (002). The percentage of m-ZrO2 for this sample is calculated to be 62.3% as shown in figure 3(g). Sample annealed at 500 °C (figure 3(d)) displays more intense m-ZrO2 peaks signifying more m-ZrO2 crystallization (86.8%) at this temperature (figure 3(h)). The percentage of t-ZrO2 phase is decreased from 37.7% (for FSZNTs-400) to 13.2% implying that much of t-ZrO2 had transformed to m-ZrO2 at 500 °C.

Figure 3. XRD patterns of (a) FSZNTs-AA, (b) FSZNTs-300, (c) FSZNTs-400, and (d) FSZNTs-500. Reference patterns for (e) m-ZrO2 and (f) t-ZrO2. Percentage of phases for (g) FSZNTs-400, and (h) FSZNTs-500.
Download figure:
Standard image High-resolution imageThe crystal structure of the as-anodized and annealed FSZNTs was further studied by analyzing the HRTEM micrographs. Figures 4(a), (c), (e), and (g) are the low magnification micrographs, while figures 4(b), (d), (f), and (h) are the corresponding high magnification images. Nanotubular structure of the FSZNTs-AA can be observed in figure 4(a). The selected area electron diffraction pattern in the inset of figure 4(b) indicates that FSZNTs-AA are amorphous. Annealing at 300 °C resulted in the formation of t-ZrO2 nanocrystallites (∼5 nm) embedded in the amorphous ZrO2 matrix (figures 4 (c), (d)). As shown, lattice fringes with d-spacing of 0.295 nm can be identified which is correlated to (011) t-ZrO2. This is consistent with the XRD pattern of the oxide as shown in figure 3(b).
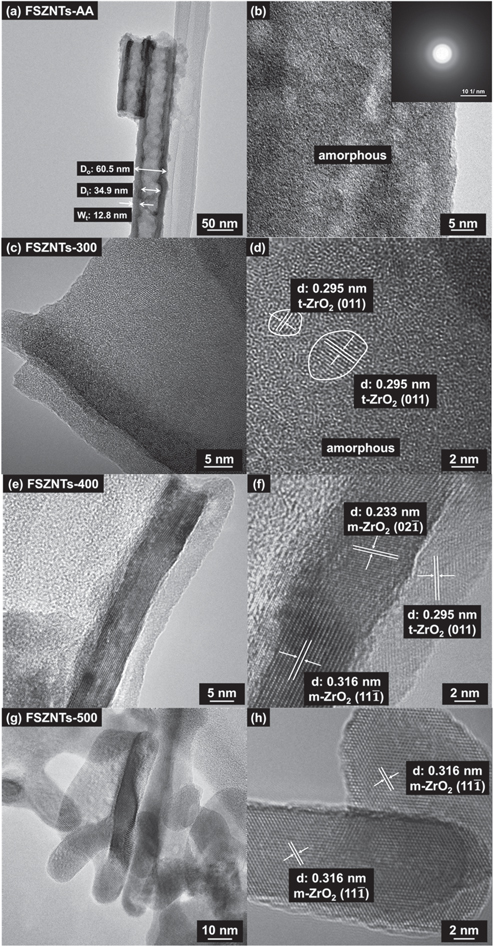
Figure 4. HRTEM micrographs of (a), (b) FSZNTs-AA, (c), (d) FSZNTs-300, (e), (f) FSZNTs-400, and (g), (h) FSZNTs-500. Figures (a), (c), (e), and (g): low magnification, figures (b), (d), (f), and (h): high magnification.
Download figure:
Standard image High-resolution imageFSZNTs annealed at 400 °C are obviously more crystalline as shown in figures 4(e), (f). Agreeing with XRD pattern of the sample, the oxide is comprised of a mixture of t-ZrO2 and m-ZrO2. Lattice fringes with d-spacings of 0.295 nm, 0.233 nm, and 0.316 nm which correspond to (011) t-ZrO2, (02  ) m-ZrO2, and (11
  ) m-ZrO2, respectively can be identified from the micrograph. Annealing at 500 °C resulted in phase transformation that accompanied by volume changes within the oxide. Under HRTEM, the walls of the nanotubes appear to be in a form of particles (figure 4(g)). At higher magnification (figure 4(h)), the particle is comprised of crystalline phase with d-spacing of 0.316 nm which corresponds to (11
  ) m-ZrO2. This is in agreement with the XRD pattern of the sample whereby much of the oxide has now crystallized to monoclinic phase.
TG-DTA analysis was conducted to investigate the phase transformation in the FSZNTs. As shown in figure 5, an exothermal peak is observed at 438 °C possibly due to crystallization of the amorphous oxide and growth of nanocrsytallites of t-ZrO2 [38, 39]. Since the specific surface free enthalpy for t-ZrO2 (0.77 J m−2) is much lower than the specific surface free enthalpy for m-ZrO2 (1.13 J m−2), there is a tendency of the amorphous ZrO2 to be transformed into t-ZrO2 rather than m-ZrO2 [31]. Annealing at low temperature may have resulted in the transformation of more amorphous to t-ZrO2 phase but as seen from the XRD pattern, at 400 °C, m-ZrO2 has started to appear as well. It is known that t-ZrO2 is a high temperature phase that normally present above 1127 °C [40] whereas m-ZrO2 is the room temperature stable phase. However, the stabilization of t-ZrO2 phase at room temperature can be done by altering the crystallite size of ZrO2 whereby small crystals can restrict phase transformation hence stabilizing t-ZrO2 at room temperature [41]. Excess of oxygen vacancies [42] induced by doping can also lead to the stabilization of t-ZrO2. In here, we observed on the formation of t-ZrO2 for the as-anodized and low temperature annealed ZNTs perhaps due to the excess oxygen vacancies in anodic ZrO2. Therefore, at 400 °C, growth of grains may have led to the formation of m-ZrO2. At 500 °C, m-ZrO2 started to dominate as oxygen vacancies annihilation and grain growth occur at this temperature. From the TG-DTA, significant weight loss at 800 °C possibly attributed to the complete transformation of t-ZrO2 to m-ZrO2.
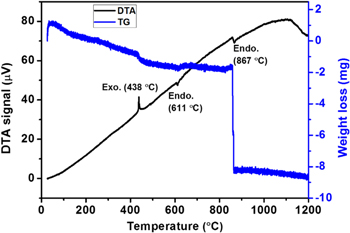
Figure 5. TG-DTA of the FSZNTs heat treated from room temperature to 1200 °C in air.
Download figure:
Standard image High-resolution imageFigure 6 shows the FTIR spectra for the as-anodized and annealed FSZNTs. Broad absorption band at 3436 cm−1 is assigned to the hydroxyl (–OH) groups. Weak bands at 2856 and 2927 cm−1 are attributed to C–H. 1384 and 1630 cm−1 are correlated to the vibration of absorbed water [43]. 1082 cm−1 is ascribed to the carbonate groups that possibly adsorbed from the atmosphere [44] and from the K2CO3-added electrolyte. The absorption bands below 1000 cm−1 are corresponding to the Zr–O vibration, indicated the formation of Zr–O–Zr networks [45]. The intensity of –OH and O–H bands are weakened after annealing due to dehydration of absorbed water that in line with Guo et al [43] findings. However, the –OH band is retained even after annealing at 500 °C due to chemically bound –OH groups on the ZrO2 surface [46].

Figure 6. FTIR spectra of (a) FSZNTs-AA, (b) FSZNTs-300, (c) FSZNTs-400, and (d) FSZNTs-500.
Download figure:
Standard image High-resolution imageFigure 7 shows the optical absorbance spectra for the as-anodized and annealed FSZNTs. FSZNTs-AA shows the highest absorbance within UV range and absorption is extended to visible light region despite reducing as the wavelength is increased. As shown in figure 8, the optical band gap of the FSZNTs is within the range of 6.0–6.5 eV; typical values for ZrO2. ZrO2 is a wide gap semiconductor and hence absorption under UV region is corresponding to the excitation of VB electrons to the CB which occurs normally at ∼230 nm [11]. Even though the band gap is large, high concentration of defects and oxygen vacancies in the sample could be responsible for the visible light absorption [47, 48]. Annealing leads to crystal growth which annihilated much of the structural defect in the oxide and hence the absorption is much reduced for FSZNTs-300 (figure 7). Nevertheless, FSZNTs-400 with the most t-ZrO2 phase (and hence with high oxygen vacancies as well) demonstrates rather good absorption in the visible range which in line with other studies [21, 48]. 500 °C annealed sample appears to have the lowest absorbance among all the FSZNTs measured. Recall that this sample has the lowest t-ZrO2 phase with m-ZrO2 as the dominant phase thus much of the oxygen vacancies are thought to be annihilated for this sample.

Figure 7. Optical absorbance spectra of the as-anodized and annealed FSZNTs.
Download figure:
Standard image High-resolution image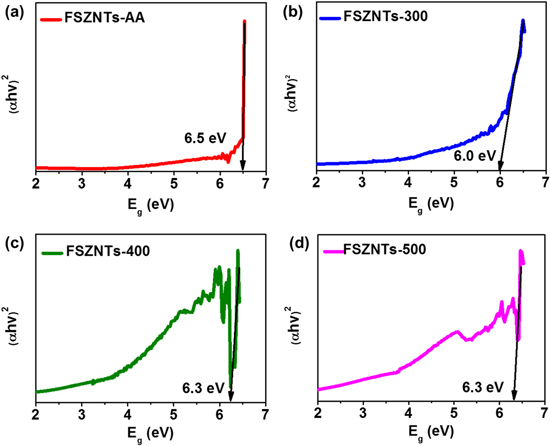
Figure 8. Optical band gap of (a) FSZNTs-AA, (b) FSZNTs-300, (c) FSZNTs-400, and (d) FSZNTs-500.
Download figure:
Standard image High-resolution imagePL spectra for the as-anodized and annealed FSZNTs are shown in figure 9. Under excitation at 325 nm (3.82 eV), the FSZNTs-500 shows the strongest emission peak implying rapid recombination of charge carriers (figure 9(a)). High clarity of PL spectra for the as-anodized and annealed FSZNTs at 300 °C and 400 °C are shown in figure 9(b). Low PL intensity of the FSZNTs-300 may indicate better charge carrier's separation. The position of emission peaks for the FSZNTs-AA, FSZNTs-400, and FSZNTs-500 are at 392 nm (3.16 eV), 454 nm (2.73 eV), 482 nm (2.57 eV), and 573 nm (2.16 eV) corresponding to violet, blue, and yellow spectrum, respectively. Whereas the FSZNTs-300 (figure 9(c)) shows four emission peaks at 392 nm (3.16 eV), 454 nm (2.73 eV), 602 nm (2.06 eV), and 655 nm (1.89 eV) pertaining to violet, blue, orange and red spectrum, respectively. Different positions of PL emission peaks for the FSZNTs-300 are possibly due to changes in crystals structure of the oxide whereby oxygen perturbation could occurred due to amorphous to tetragonal transformation.
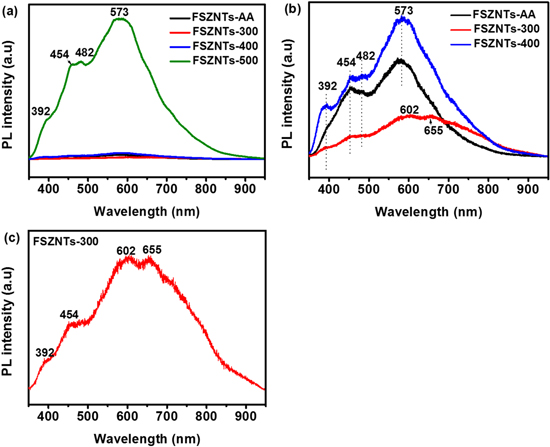
Figure 9. PL spectra of (a) as-anodized and annealed FSZNTs, (b) PL spectra of FSZNTs-AA, FSZNTs-300, and FSZNTs-400, and (c) PL spectrum of FSZNTs-300.
Download figure:
Standard image High-resolution imageAs illustrated in figure 10, two possible mechanisms are thought to account for the PL emissions in ZrO2 nanotubes: intrinsic defects and impurities [35, 42, 49]. Impurities in the FSZNTs may originate from anion insertion from the electrolyte; possibly fluorine, potassium and hydroxyl ions. The intrinsic defects can be a missing oxygen atom from the bulk or surface of ZrO2 lattice. The oxygen vacancies and impurities in ZrO2 can induce the formation of new energy levels in the band gap [50]. The formation of neutral oxygen vacancies  and ionized oxygen vacancies in ZrO2 crystals can be described as follows (equations (1)–(4)):


whereby  is a neutral oxygen vacancy,
  is a singly ionized oxygen vacancy,
  is a doubly ionized oxygen vacancy,
  is an oxide anion in a regular lattice site, and
  is a photoinduced electron [50]. The captured electron in the oxygen vacancy site can influence the adjacent Zr atoms leading to reduction of Zr4+ into Zr3+ (equation (5)) [35]. As illustrated in figure 10, the excited electron can be quickly trapped by Zr3+ or oxygen vacancies (
 or
or  ) leading to formation of Farbe center and hole (equation (6)). The recombination of Farbe centre with hole produces the excited states of emitter [(Farbe+)*] (equation (7)). The transfer of (Farbe+)* to the ground state produces the color emission [42] (equation (7)). Even though the band-to-band excitation is not possible due to wide band gap of ZrO2, the excitation of electron from the VB to the defect states produces electron–hole pairs which can be regarded as similar to band-to-band excitation [51].
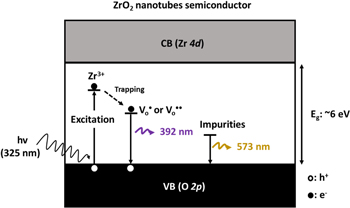
Figure 10. Proposed mechanism of PL emissions in the FSZNTs.
Download figure:
Standard image High-resolution imageFigure 11 shows the photocatalytic reduction of 10 ppm Cr(VI) solution at pH 2 in the presence of amorphous and crystalline FSZNTs under sunlight. Without photocatalyst (blank sample), 28% of Cr(VI) removal was observed after 5 h possibly due to water photolysis (equation (8)) [15, 52]. The reduction was not happened under dark, suggesting the role of photocatalyst and sunlight for the reduction of Cr(VI).

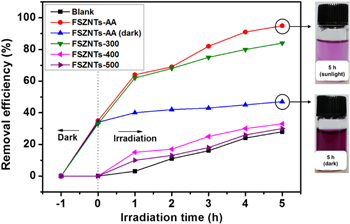
Figure 11. Photocatalytic reduction of Cr(VI) over as-anodized and annealed FSZNTs under sunlight.
Download figure:
Standard image High-resolution imageAs shown in figure 11, 95% Cr(VI) removal was observed on the FSZNTs-AA after 5 h. Slightly lesser reduction was observed in the presence of FSZNTs-300 (84%) and less significant reduction can be seen for the FSZNTs-400, and FSZNTs-500 with their Cr(VI) removal efficiencies of 33%, and 30%, respectively. High photocatalytic activity of the FSZNTs-AA and FSZNTs-300 can be attributed to enhanced Cr(VI) adsorption on amorphous phase. This can be seen from the dark part of figure 11 whereby 35% reduction is noted for both samples. The high Cr (VI) ions adsorption can be attributed to the high density of surface –OH and carbonate groups that can be evident in the FTIR spectra shown in figure 6. The density of –OH and carbonate groups was gradually decreased when annealed at higher temperature. This translates to less Cr(VI) adsorption on FSZNTs-400 and FSZNTs-500. As seen from figure 11, Cr(VI) removal in dark condition is negligible.
The mechanism of Cr(VI) adsorption on the surface of FSZNTs-AA or 300 is schematically shown in figure 12. The point of zero charge (PZC) for hydrous ZrO2 is estimated to be 2.2–3 [53, 54]. When the pH of Cr(VI) solution is less than the pHPZC (pH 2), the photocatalyst surface becomes positively charged due to protonation of the –OH groups into  The negatively charged Cr(VI) ions in the form of
  easily attracted to the positively charged
  via electrostatic attraction. However, when the pH of Cr(VI) solution is greater than the pHPZC, the Cr(VI) adsorption was not encouraged due to electrostatic repulsion [53]. pH effect on the Cr(VI) removal was then studied.
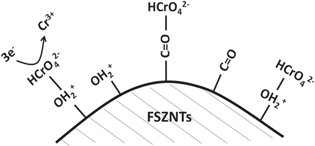
Figure 12. Mechanism of Cr(VI) adsorption on the surface of FSZNTs.
Download figure:
Standard image High-resolution imageAs shown in figure 13, 69% Cr(VI) removal was obtained at pH 2 after 2 h of exposure and the removal efficiency is markedly reduced to 63%, 26%, and 19% with increasing pH at 3, 4, and 5, respectively. This further proves that by lowering the pH, more efficient Cr(VI) removal can be observed. More so, at low pH the reduction potential for  /Cr3+ will be shifted to a more positive potential which is greater than the CB shift of the oxide as seen from equation (9) [58]. As a result, there is a high thermodynamic driving force for electron transfer from the oxide to the adsorbed Cr(VI) for successful reduction to happen.

Figure 13. Effect of pH on photoreduction of Cr(VI) under sunlight for 2 h.
Download figure:
Standard image High-resolution imageDespite band-to-band excitation is not possible in ZrO2 due to its large band gap, the CB electrons can be produced by electron transition from the VB to CB through the intermediate defect states via double excitation [55] as schematically shown in figure 14. On the other hand, the excited electron also could be trapped at defect states before reacting with adsorbed Cr(VI) [56]. The reduction potential for  /Cr3+ under the standard condition is E0 = +1.35 V versus normal hydrogen electrode (NHE) at pH = 0 [57]. Hence, the Cr(VI) reduction is possible over ZrO2 because the reduction potential for
  /Cr3+ is more positive than the CB potential of ZrO2 (i.e., −1.0 eV versus NHE at pH = 0) leading to reduction of Cr(VI) to Cr(III) by the photogenerated electrons (equation (9)). Whereas, since the oxidation potential for H2O/O2 is more negative than the VB of ZrO2 (i.e., +4.0 eV versus NHE at pH = 0), the water is oxidized into O2 by the photogenerated holes as stated in equation (10). Therefore, the Cr(VI) reduction of FSZNTs-AA and FSZNTs-300 can be thought to occur via synergistic reactions between adsorption and photoreduction processes. As for the FSZNTs-400 and 500 samples, the poor reduction behavior of Cr(VI) may be attributed, as mentioned to the negligible adsorption of
  ions. Moreover rapid recombination of electron–hole pairs (as shown from PL in figure 9) may also reduce the possibility of direct electrons transfer from the oxide to the Cr(VI). In addition, poor photocatalytic performance of the FSZNTs-500 can be attributed to high concentration of m-ZrO2 phase which is proposed to be a poor photocatalysts as reported by Rozana et al [11].


Figure 14. Proposed mechanism of Cr(VI) photoreduction over FSZNTs.
Download figure:
Standard image High-resolution imageIt is apparent both water photolysis (equation (8)) and water oxidation (equation (10)) produce O2 gas that could affect the Cr(VI) reduction. According to Wu et al [58], O2 can compete with Cr(VI) for the photogenerated electrons from photocatalyst producing superoxide radical  (equation (11)). Because of this Cr(VI) reduction can be rather sluggish. This in line with Wang et al [59] whereby low reduction efficiency of Cr(VI) was observed in the presence of O2. Nevertheless,
  can react with H+ ions in the solution to produce
  hydrogen peroxide (H2O2), and hydroxyl radical
  (equations (12)–(14)).
 and H2O2 can then reduce Cr(VI) to Cr(III).
  on the other hand can oxidize the Cr(III) to Cr(VI) [58]. All of these competing processes make the reduction process rather complex.
It is therefore anticipated that the reduction of Cr(VI) over the FSZNTs occurred possibly via several routes: (i) directly from CB electrons, (ii) indirectly from electrons derived by water photolysis, and (iii) indirectly from the 
 and H2O2 species derived from reaction of O2 with the photogenerated electrons [58]. The dominating process is yet to be understood and studied.


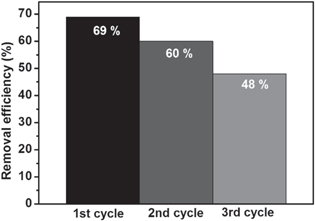
The reusability of the FSZNTs-AA photocatalyst for reduction of Cr(VI) was evaluated for three cycles under similar working conditions at pH 2 for 2 h. As shown in figure 15, the Cr(VI) removal efficiency was gradually decreased from 69% (1st cycle) to 60% (2nd cycle) and 48% (3rd cycle) that can be attributed to saturation of the photocatalyst surface with Cr(III) leading to low Cr(VI) adsorption. The presence of Cr(III) on the photocatalyst surface after photoreduction can be evident with Luo et al [60] findings. More ought to be done as to precipitate out the Cr(III) as to re-generate and re-use the catalysts.
Figure 15. Reusability of FSZNTs-AA photocatalyst for three cycles under sunlight after 2 h.
Download figure:
Standard image High-resolution image
4. Conclusions
Visible-light-active FSZNTs were fabricated by anodization in EG/0.3 wt% NH4F/1 vol% K2CO3 electrolyte at 60 V for 1 h without annealing. The amorphous FSZNTs exhibited superior photocatalytic performance compared to the crystalline FSZNTs due to enhanced Cr(VI) adsorption, high photon absorption, and better charge carrier separation. The low photocatalytic activity of the FSZNTs, which annealed at 500 °C was ascribed to Cr(VI) adsorption, low visible light absorption, and high fraction of less photoactive m-ZrO2.
Acknowledgments
The Heavy Metal Mitigation project is supported by USM-Research University Grant for Toyohashi University of Technology, Japan-USM collaboration (1001/PBAHAN/870048). Crystallization of anodic oxide work is supported by the Fundamental Research Grant Scheme, Ministry of Higher Education Malaysia (1001/PBAHAN/6071363). KPT-UniMAP's SLAB Scholarship for postgraduate scholar is also acknowledged.