

Abstract
X-ray microscopy instruments have the unique ability to achieve nondestructive imaging with higher spatial resolutions than traditional x-ray computed tomography (CT) systems. This unique ability is of interest to industrial quality control entities, as they deal with small features in precision manufactured parts (with tolerances in the order of ±25 µm or better). Since many of today's technology and manufacturing companies demand increasingly higher levels of precision, accuracy, and reliability for dimensional measurements on feature sizes that are much smaller than 5 mm, it would be ideal to further expand the imaging capabilities of x-ray microscopy to the field of precision metrology. To address such demand, this paper describes the development of a measurement workflow, through a package consisting of hardware and software, to improve the accuracy of dimensional data obtained with 3D x-ray microscopes (XRMs)—also known as sub-micrometer CT systems. The measurement workflow, called Metrology Extension (MTX), was designed to adjust and configure the XRM instrument work-zone to perform dimensional measurement tasks. The main adjustments of an XRM instrument through the MTX workflow, which must be implemented before scanning parts of interest for dimensional evaluation, include applying a distortion map correction on the image projections produced by the x-ray detector and a voxel scale correction. The main purpose of this article is to present, evaluate, and analyze the experimental results of various measurement tests to verify the metrological performance of several XRM systems operating with the MTX workflow. The main results show that these systems can produce repeatable and reproducible measurements, with repeatability standard deviations of the order of 0.1 μm and reproducibility standard deviations of less than 0.5 μm. In addition, coordinate-based 3D XRM measurements produce dimensional accuracies comparable to those offered by high-precision tactile coordinate measurement machines (with deviations within the range of ±0.95 µm). Therefore, once the MTX workflow is executed, XRM instruments can be used to measure small volumes, in the order of (5 mm)3 or less, with improved dimensional accuracy.
Export citation and abstract BibTeX RIS

Original content from this work may be used under the terms of the Creative Commons Attribution 4.0 license. Any further distribution of this work must maintain attribution to the author(s) and the title of the work, journal citation and DOI.
1. Introduction
The use of industrial x-ray imaging for dimensional metrology has become an important aspect of modern quality control. Three-dimensional (3D) imaging techniques, such as x-ray computed tomography (CT), currently contribute to geometric dimensioning and tolerancing of device components, such as mechanical parts, for various technology and manufacturing companies [1–3]. X-ray CT is used as a nondestructive dimensional quality control tool in various industries, such as automotive, electronics, aerospace, medical devices, and additive manufacturing, to name a few examples. However, even under optimal measurement conditions, CT dimensional metrology technologies have traditionally been limited to spatial resolutions no better than 4–10 μm. This leads to several challenges in measuring small samples (with volumes on the order of a few mm3)—e.g. low signal-to-noise ratio in CT data and limited detection of contrast changes and spatial details. Additionally, in today's precision manufacturing standards, there is a growing demand for tighter tolerances (±25 µm or better) requiring quality control instruments that possess a higher degree of measurement accuracy than most currently available x-ray CT measuring systems.
Although sub-micrometer resolution laboratory CT systems, often referred to as 3D x-ray microscopes (XRMs), were introduced more than a decade ago [4–7], these instruments have been used primarily for failure analysis, material science, and process development. Except for some preliminary results previously presented by the authors in conference proceedings [8, 9], there are no other reports in the current literature, to the authors' knowledge, reporting precision dimensional metrology applications with XRMs. The main approach for CT dimensional metrology, until now, has been the use of x-ray projection-based geometries employing flat panel detectors with effective pixel sizes (pixel pitch) ranging from 127 µm to 200 µm [1, 10–12]. To overcome some of the limitations of such CT measuring systems in terms of imaging resolution, this paper introduces a measurement workflow—a solution consisting of hardware and software—for performing accurate dimensional metrology using the resolution capabilities of 3D XRMs. Evaluation of this newly developed measurement workflow, using multisphere phantoms, shows that it can produce repeatable and reproducible measurements; with repeatability standard deviations of the order of 0.1 µm and reproducibility standard deviations of about 0.35 μm.
Section 2 of this article further expands on the details of 3D x-ray techniques and the use of multisphere phantoms to verify the accuracy of dimensional measurement instruments, with references to recent literature for the interested reader. A description of the metrology workflow for 3D XRMs used in this paper, including specific details on measurement strategies for accuracy verification, is presented in section 3. From the XRM data obtained for a recently developed multisphere phantom, the accuracy of volume reconstructions are evaluated by comparing 3D XRM-based dimensional measurements with calibrated/reference data (or operative 'true values') obtained from a tactile coordinate measurement machine (CMM) 4 . Experimental data is also presented to verify the repeatability and reproducibility of the XRM measurements, with a detailed analysis of the results. Section 4 provides some examples of possible industrial applications for the 3D XRM metrology workflow presented in this article. Lastly, to outline the merits of the work presented throughout the paper, concluding observations are provided in section 5. The main results show that 3D XRM instruments can perform dimensional measurements in small-scale volumes, on the order of (5 mm)3 or less, providing measurement accuracies comparable to those offered by high-precision tactile CMMs (with deviations between the XRM data and CMM calibrated/reference values within the ±0.95 µm range). Although, due to the differences in operating principles between XRMs and CMMs, there remain philosophical questions about the comparability of XRM and CMM data [1, 11, 13], in order for the measurement results of both techniques to be comparable, the XRM-based dimensional measurements were performed with sampling/probing strategies that resemble those of CMMs (i.e. by using feature construction based on coordinate probing points with a least-squares fit and a Gaussian filter—see section 3).
2. 3D x-ray techniques and dimensional metrology
In this section, the differences between x-ray CT and XRM instruments are established. A formal definition of geometrical magnification is introduced and the role of optical magnification in improving the spatial resolution of data reconstruction is highlighted. A brief discussion of dimensional metrology with 3D x-ray data is also presented.
2.1. X-ray CT and XRM systems
In traditional industrial x-ray systems, designed for nondestructive evaluation and industrial metrology tasks, the main approach has been to use projection-based architectures in which two-dimensional images, or radiographs, are created by x-rays in a cone-beam that passes through an object and projects radiographs onto a flat panel detector (figure 1(a)). From several radiographic images collected at different angular positions, using localized x-ray absorption measurements, a CT reconstruction algorithm can create a volumetric representation of the object from which internal and external features can be extracted for dimensional measurements [1].
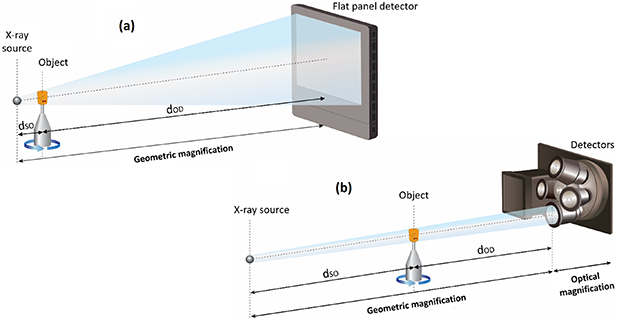
Figure 1. Schematic representation of x-ray CT and XRM systems: (a) a cone-beam x-ray CT setup with a flat panel detector; (b) two-stage magnification architecture of a ZEISS Xradia Versa 3D XRM with tunable objectives of different optical magnifications. The combination of geometric and optical magnification enables higher resolution capabilities in XRMs as compared to flat panel x-ray CT systems.
Download figure:
Standard image High-resolution imageWith flat panel-based CT systems, the object must be positioned as close to the x-ray source as possible, while remaining within the cone beam, to obtain highly magnified radiographic images at the detector and produce 3D data reconstructions with the highest resolution possible. The geometrical magnification (Mg) of a projection-based system is a function that depends on the source-to-object distance ( ) and the object-to-detector distance (
 ),
),
The maximum operating Mg
value in industrial and laboratory-based x-ray projection instruments is generally determined by the minimum working distance  , which is limited by the sample size—the sample needs to spin in the rotary stage without hitting the x-ray source (see figure 1). In general, the spatial resolution of a CT system depends on parameters such as the focal spot size of the x-ray source, the degree of collimation of the x-ray beam, the projection geometry, the size of the sample, the dimensions of the detector, the precision of mechanical motion controllers, and on details of the computer algorithms used for 3D reconstruction [13–16]. With an x-ray source focal spot in the order of 2–5 μm and a flat panel detector of 2048 × 2048 pixels with a pixel pitch in the range of 127–200 μm, the best spatial resolution achievable is typically limited to the range of 4–10 μm for cylindrical objects with diameters in the 2–25 mm range. Larger samples limit the geometrical magnification Mg, thus reducing the best achievable resolution of CT scans to several tens of micrometers.
There are two common approaches to further increasing the image resolution capabilities of flat panel CT instruments: a reduction in the x-ray focal spot and/or the use of a higher resolution flat panel detector. However, this would not eliminate the limitations on geometric magnification imposed by larger samples (>25 mm diameter). An alternative would be to incorporate optical lenses after x-ray detection to create a scintillator-lens-CCD
5
detector coupling, as shown in figure 1(b), to optically magnify the image before reaching the CCD detector. This strategy enables XRM images with spatial resolutions down to 500 nm—see table A1 and figure A1 (in appendix
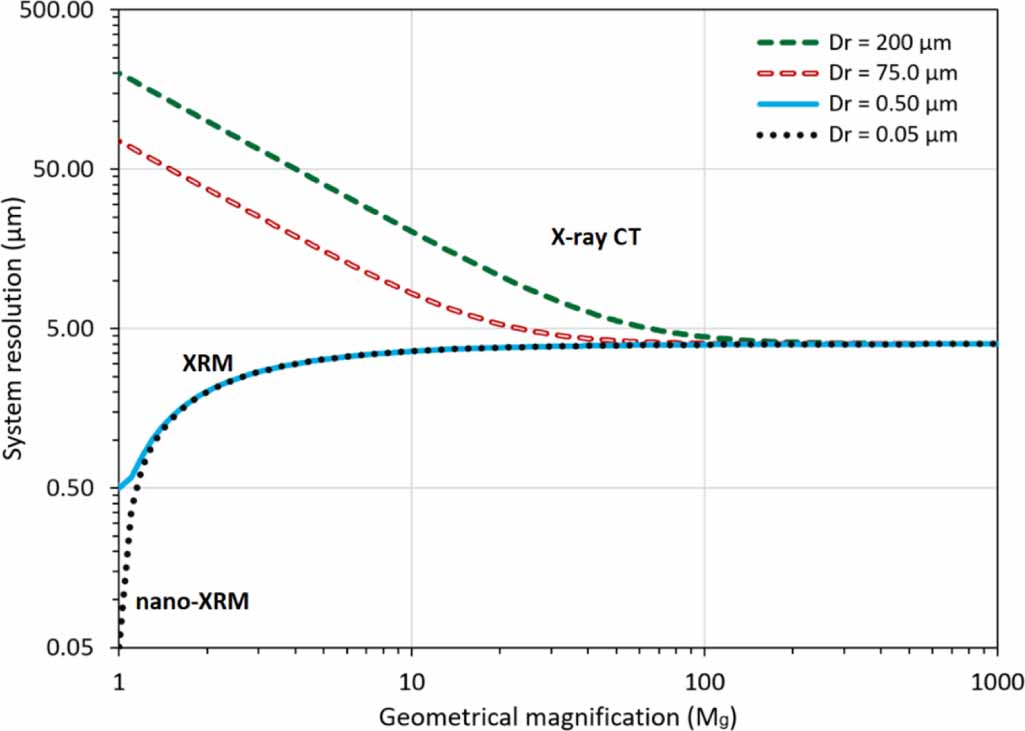
Whereas typical pixel resolutions of commercial flat panel detectors are within the range of 75–200 μm, effective detector pixel sizes in XRM systems can be as low as 16 nm [4, 7]. Figure 2 illustrates scenarios of system resolutions versus Mg
for four diferent detector resolutions: 200 μm and 75 μm for flat panel CT systems and 0.5 μm and 50 nm for XRM detectors. When comparing x-ray CT with XRM instruments, system resolutions behave differently for Mg values below 100 . In x-ray CT, the resolution of the system worsens as Mg decreases (i.e. when the sample size increases). On the other hand, by leveraging optical magnification, XRMs allow to preserve (and improve) the system's spatial resolution as Mg decreases, without major limitations on sample size
6
—as long as the sample physically fits inside the instrument and does not limit x-ray transmission (the measuring range will be determined by the penetration depth of x-rays into the sample, which is dependent on the sample's material composition and the energy spectrum of the x-ray source [13]). The curves in the graph (figure 2) were derived from the approximated system's resolution formula given in [4],
. In x-ray CT, the resolution of the system worsens as Mg decreases (i.e. when the sample size increases). On the other hand, by leveraging optical magnification, XRMs allow to preserve (and improve) the system's spatial resolution as Mg decreases, without major limitations on sample size
6
—as long as the sample physically fits inside the instrument and does not limit x-ray transmission (the measuring range will be determined by the penetration depth of x-rays into the sample, which is dependent on the sample's material composition and the energy spectrum of the x-ray source [13]). The curves in the graph (figure 2) were derived from the approximated system's resolution formula given in [4],

Figure 2. Spatial resolution of x-ray CT and XRM systems as a function of geometric magnification for different detector resolutions when the size of the x-ray source focal spot is S = 4 μm. A dotted curve has been added, for reference only, from a hypothetical nano-XRM instrument.
Download figure:
Standard image High-resolution imagewhere  is the spatial resolution of the detector and
  is the x-ray source focal spot size.
2.2. Dimensional metrology
After the reconstruction phase of x-ray CT or XRM data is completed, a representation of the object's internal and external surfaces can be produced with the use of thresholding algorithms for edge detection and material boundary/surface determination [21–25]. Thereafter, the geometric characteristics of those surfaces can be used as a reference for dimensional metrology. But to minimize errors and improve the accuracy of dimensional measurements, a suitable method is required to determine the voxel size 7 associated with 3D data reconstruction is required. In flat panel CT systems, voxel size dimensions are determined by Mg and the x-ray detector's pixel pitch [1, 13, 26]. In the last two decades, methods have already been proposed to determine and correct voxel size errors in industrial CT scanners using multisphere phantoms 8 [27–29]. In fact, since around 2005, several manufacturers have marketed flat panel x-ray CT systems for dimensional metrology. As a result of sub-voxel interpolation algorithms commonly used for surface determination, dimensional measurements with sub-voxel accuracies are now ordinarily reported from CT data. Previous studies have shown that when geometric features ranging from 0.5 mm to 60 mm are dimensioned, the expanded uncertainties (k = 2) associated with flat panel-based CT measurements are typically in the 5–50 µm range [10, 11, 30].
Still, depending on the sample size, flat panel-based CT systems may have limited spatial resolution capabilities (section 2.1). The spatial resolution of the data generated by such systems is, at best, on the order of micrometers or tens of micrometers. Spatial resolution limitations can hinder essential surface details that, in addition to improve the accuracy of CT-based dimensional data, could enable other nondestructive analyses, such as morphological characterization of internal walls and evaluation of material porosity, which require high spatial resolution features. As an alternative, this paper proposes the use of sub-micrometer resolution XRM instruments for dimensional metrology, an idea that has not been widely explored until some recent work introduced (by the authors) at conference settings [8, 9]. This article builds on that work and introduces new data that verify the dimensional accuracy of metrology workflows with XRM data. The repeatability and reproducibility of the XRM metrology workflow proposed in this paper, which employs a small version of a multisphere phantom (contained in a cylindrical volume of 4 mm diameter and about 1.8 mm height), are also verified by various data comparisons.
3. XRM workflow for dimensional metrology
A metrology workflow developed by Carl Zeiss X-ray Microscopy, Inc. hereinafter referred to as the Metrology Extension (MTX), is used to improve the accuracy of 3D XRM dimensional data. The MTX workflow includes applying a distortion map correction to the image projections produced by the detecting system and a voxel scale correction before XRM measurement. These corrections are necessary to improve the dimensional accuracy of data reconstruction and of any feature measurements based on the final reconstructed 3D XRM data; although the accuracy of the dimensional data will also depend on other crucial steps during the measurement process, such as surface determination and sampling strategy, as previously discussed elsewhere [1, 10, 11]. Adjustments and pre-setting of the instrument's work-zone to perform dimensional measurement tasks on an XRM instrument
9
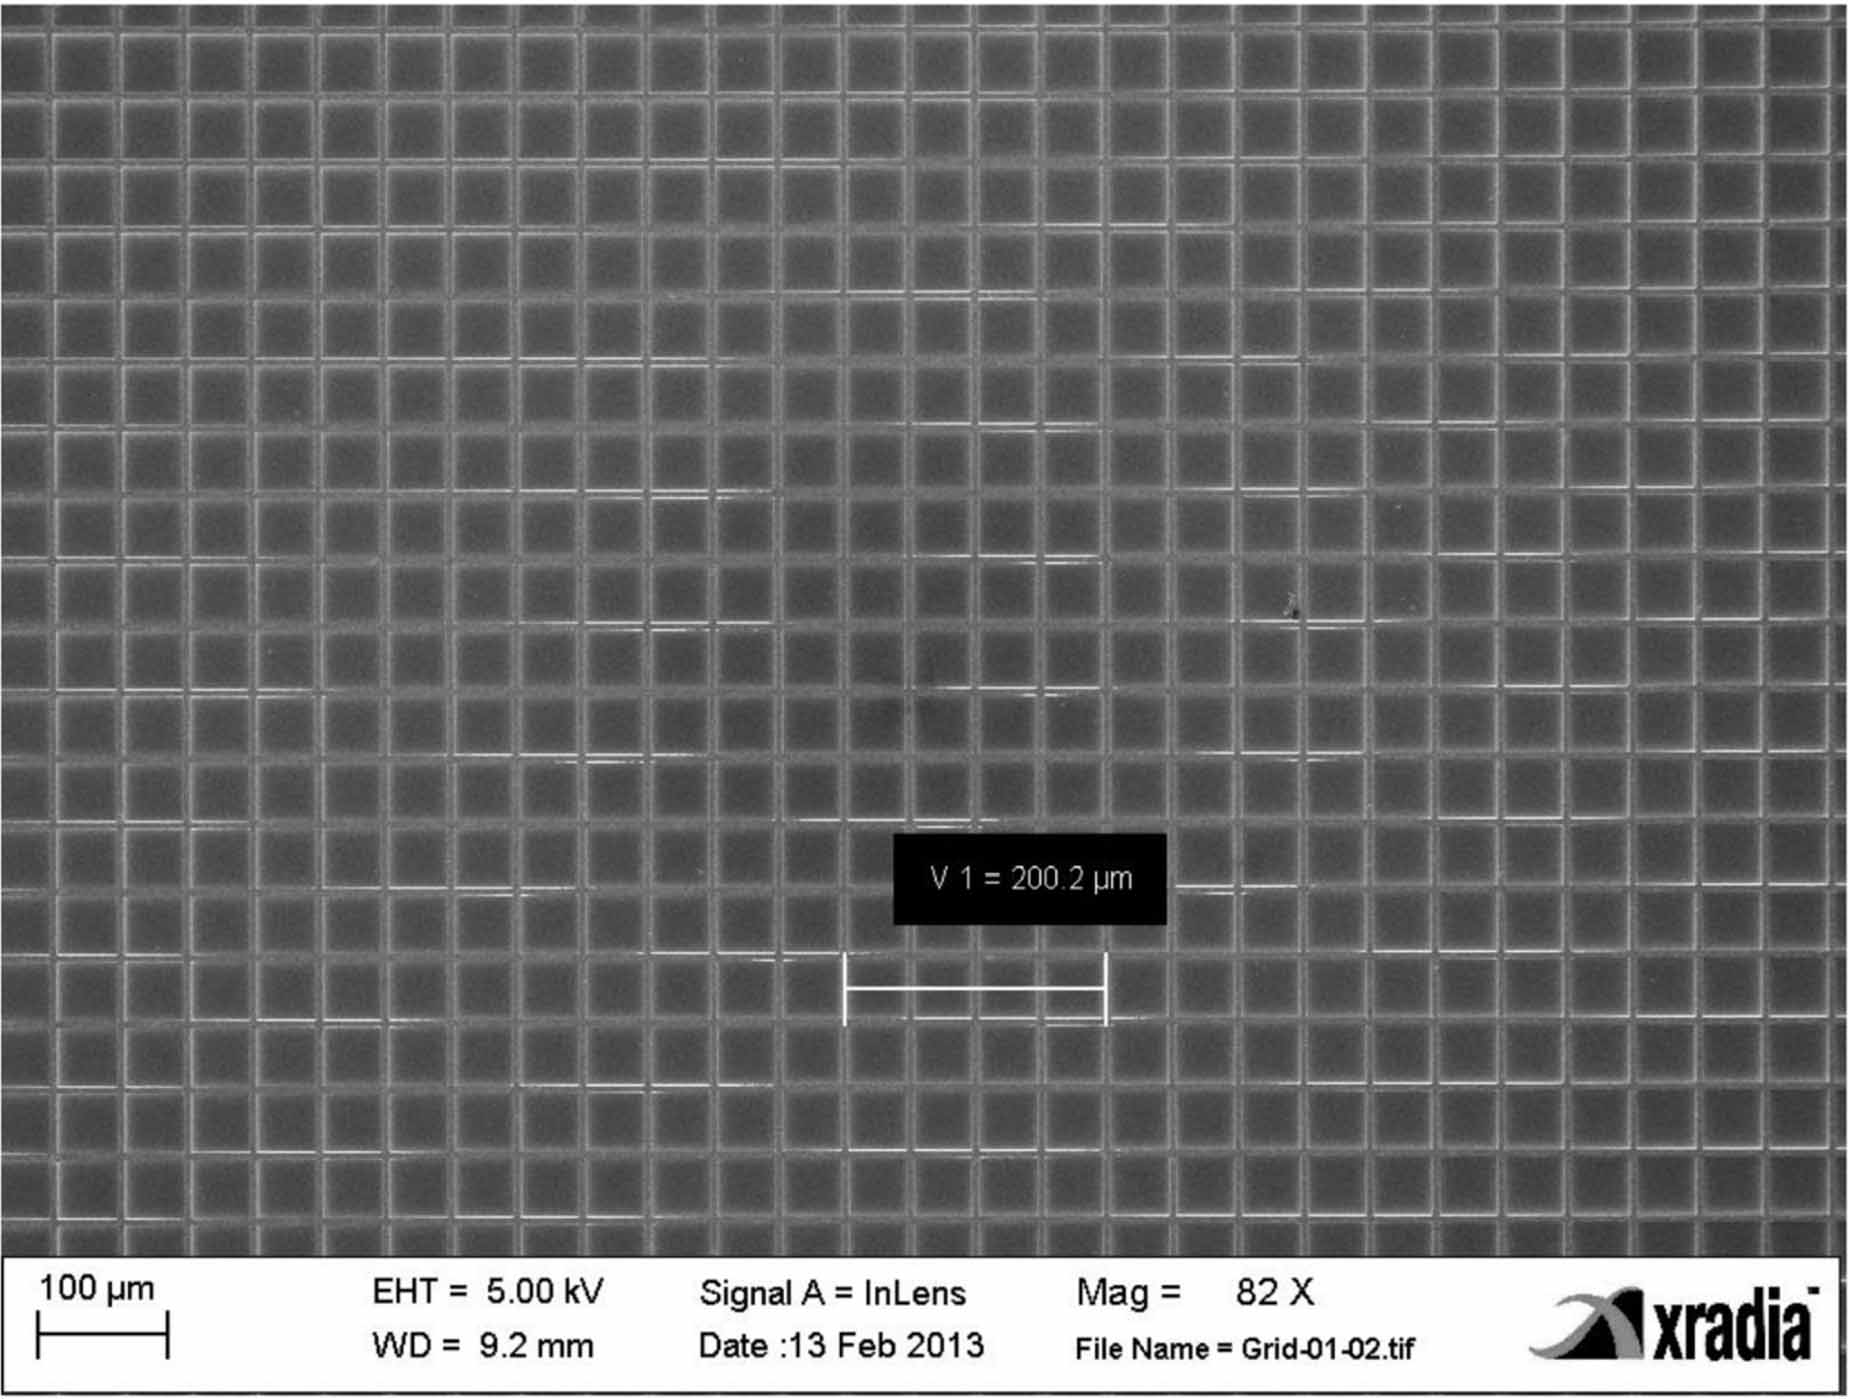
can be implemented through the MTX workflow, prior to scanning the workpieces of interest, e.g. in a weekly or daily basis. Figure 3 shows how the MTX workflow works and integrates into the 3D XRM measurement process. Geometric distortion correction in ZEISS Xradia Versa instruments is performed by using a square grid array composed of grid lines spaced 50 μm apart—see figure B1 (in appendix
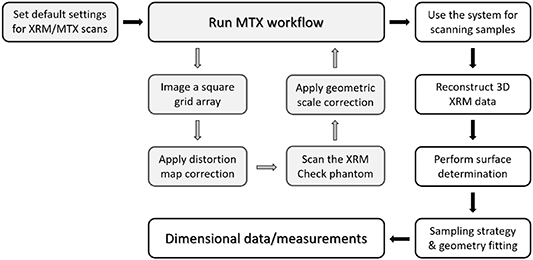
Figure 3. MTX workflow integrated into the 3D XRM measurement process so that accurate dimensional data can be provided.
Download figure:
Standard image High-resolution imageThe only two reference documents with procedures for testing dimensional 3D x-ray systems are the VDI/VDE 2630-1.3 [36] and the ASME B89.4.23 [37], which were published as part of ongoing efforts toward standardization of procedures for performance verification and acceptance testing of CT systems used for dimensional metrology. These guidelines provide test protocols for evaluating systems conformance to manufacturers' accuracy specifications, generally indicated by maximum permissible error (MPE) statements. There is also a working document (draft) that is being discussed internationally by the CT task force of the International Standards Organization (ISO), technical committee 213 working group 10, which aims to create an international standard (series ISO 10360-11). The release date for its publication is still unknown.
In accordance with the VDI/VDE 2630-1.3 guideline, Carl Zeiss Industrielle Messtechnik GmbH [8, 38] developed a length standard multisphere called the 'XRM Check' to verify the accuracy of dimensional CT measurements on small volumes that fit in a 5 mm field-of-view (FOV). This length standard consists of 22 identical 300 μm diameter ruby spheres attached to a supporting pillar structure made of fused silica (or quartz glass, with coefficient of thermal expansion  0.55 µm m−1 °C−1). See figure 4 or [38]. The roundness of the spheres (shape error) is consistent with the Anti-Friction Bearing Manufacturers Association criteria for Grade 5 ball or better (tolerances specified by deviations of ±0.13 µm of the combined diameter and roundness of the spheres). Given the simple and well-defined geometric characteristics of ruby balls, built with low manufacturing inaccuracies, and easy to measure with a tactile CMM, the use of multisphere standards is a common and straightforward method for evaluating the performance of CT or XRM systems [39, 40]. The spatial arrangement of the spheres in the XRM Check standard allows a distinctive number of different lengths (at least five different distances), in a total of seven different spatial directions, to implement the acceptance test suggested in the VDI/VDE 2630-1.3 guideline.
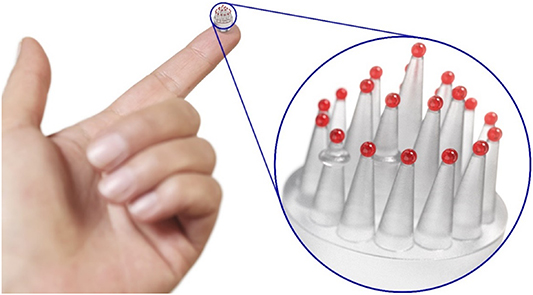
Figure 4. The 'XRM Check' multisphere standard composed of 22 ruby spheres (Ø = 300 µm) mounted on conical quartz pillars and contained in a cylindrical volume 4 mm in diameter and approximately 1.8 mm in height.
Download figure:
Standard image High-resolution image3.1. Verifying measurement accuracy
The test evaluation for CT (or XRM) systems generally includes comparisons between length measurements obtained from CT data and other more precise and accurate reference measurements, such as those acquired from a tactile CMM. In this work, the reference measurements for the different sphere distances in the XRM Check standard were calculated from the center positions of the spheres measured by the Federal Institute of Metrology METAS, Switzerland, with an ultra-precise tactile CMM dedicated for calibrating small size objects (METAS µCMM [41]). With three laser interferometers that measure the displacement of its table and equipped with a probe head that uses a spherical sapphire stylus (diameter 208 µm) with a weak probing force (<0.5 mN), this machine ensures accurate reference measurements. Each sphere was probed on its upper hemisphere along the equator and two half meridians. All measurement points where probed using scanning with a point density of 300 points/mm and using a Gaussian filter of 15 undulations per revolution cut-off frequency. The reported uncertainty for the reference measurements, expressed as a combined uncertainty multiplied by a coverage factor k = 2, is

This is the associated expanded uncertainty for the reference measurements, for a confidence level of 95.45%, which was estimated following the guidelines of the Guide to the Expression of Uncertainty in Measurement (usually referred to as the GUM) [42].
To evaluate the metrological performance of an XRM instrument (for length measurements), after implementation of the MTX workflow, the deviations between the XRM data and the CMM references can be plotted on a graph (e.g. see figure 6). Table 1 lists the parameter settings used for x-ray imaging of the XRM Check multisphere phantom. Following the measurement workflow of figure 3, to perform coordinate-based dimensional measurements on the 3D XRM data, after surface determination with a local adaptive threshold method [21], spherical features were defined on each ruby ball of the XRM Check phantom using a Gaussian multipoint least-squares fit with Calypso software (Carl Zeiss Industrielle Messtechnik GmbH). Figure 5(b) illustrates the sampling strategy used to fit each spherical feature, which resembles a common CMM probing strategy [10]. To compensate for outliers, only data points in a range of ±2 σ (corresponding to approximately 95% of the 800 points), where σ is the standard deviation of all measured points, are used to calculate the fitted sphere elements. After determining the centers of the spheres, a choice of 35 different center-to-center length measurements, covering at least seven different spatial directions, as suggested by the VDI/VDE 2630-1.3 guideline, was evaluated and grouped into five sets based on their nominal values. The 35 measurands are listed in table 2.
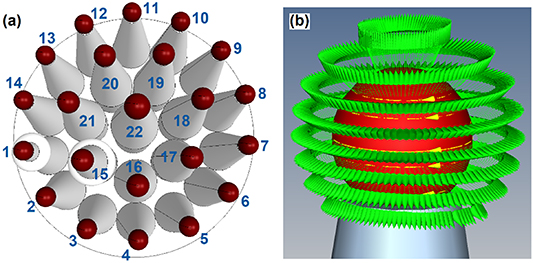
Figure 5. Strategy for measuring the 'XRM Check' multisphere phantom: (a) sphere identification numbers and (b) multipoint probing strategy to fit spherical characteristics on each ruby ball (with 800 virtual probing points distributed over eight circular loops, ignoring the shaft and pole area).
Download figure:
Standard image High-resolution image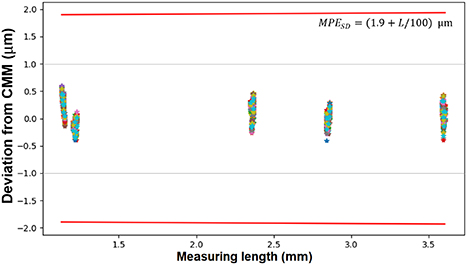
Figure 6. Deviations of 3D XRM dimensional data, from CMM calibrated/reference data, after MTX workflow execution on a ZEISS Xradia 620 Versa instrument. Table 2 shows the list of measurands associated with each center-to-center sphere distance. Different colored data points represent different test runs. Appendix
Download figure:
Standard image High-resolution imageTable 1. Experimental settings for scanning the 'XRM Check' multisphere phantom with a ZEISS Xradia 620 Versa x-ray microscope coupled with MTX. LE2 stands for 'Low Energy filter #2' and is equivalent to a 0.21 mm thick aluminum filter.
| 3D XRM scanning parameters | |
|---|---|
| Objective lens | 4× |
| Field of view | 5 mm |
| Voxel size (Bin 1) | 2.5 μm |
| Source position | −38 mm |
| Detector position | 15 mm |
| X-ray tube voltage | 90 kV |
| X-ray tube current | 133 μA |
| X-ray pre-filter | LE2 |
| Exposure time | 4 s |
| Number of projections | 800 |
Table 2. Labels associated with center-to-center sphere distance (SD) evaluations in the 'XRM Check' multisphere (sphere identification labels are shown in figure 5). The measurands are ordered by ascending dimensional magnitude and are grouped into five sets of distances classified by nominal value of length.
| Measurand | Short name | Nominal value (mm) |
|---|---|---|
| Distance 15-2 | SD 2-15 | 1.134 |
| Distance 16-4 | SD 4-16 | 1.134 |
| Distance 17-6 | SD 6-17 | 1.134 |
| Distance 18-8 | SD 8-18 | 1.134 |
| Distance 19-10 | SD 10-19 | 1.134 |
| Distance 20-12 | SD 12-20 | 1.134 |
| Distance 21-14 | SD 14-21 | 1.134 |
| Distance 15-22 | SD 15-22 | 1.210 |
| Distance 16-22 | SD 16-22 | 1.210 |
| Distance 17-22 | SD 17-22 | 1.210 |
| Distance 18-22 | SD 18-22 | 1.210 |
| Distance 19-22 | SD 19-22 | 1.210 |
| Distance 20-22 | SD 20-22 | 1.210 |
| Distance 21-22 | SD 21-22 | 1.210 |
| Distance 1-22 | SD 1-22 | 2.343 |
| Distance 3-22 | SD 3-22 | 2.343 |
| Distance 5-22 | SD 5-22 | 2.343 |
| Distance 7-22 | SD 7-22 | 2.343 |
| Distance 9-22 | SD 9-22 | 2.343 |
| Distance 11-22 | SD 11-22 | 2.343 |
| Distance 13-22 | SD 13-22 | 2.343 |
| Distance 1-18 | SD 1-18 | 2.850 |
| Distance 3-19 | SD 3-19 | 2.850 |
| Distance 5-20 | SD 5-20 | 2.850 |
| Distance 7-21 | SD 7-21 | 2.850 |
| Distance 9-15 | SD 9-15 | 2.850 |
| Distance 11-16 | SD 11-16 | 2.850 |
| Distance 13-17 | SD 13-17 | 2.850 |
| Distance 1-8 | SD 1-8 | 3.600 |
| Distance 3-10 | SD 3-10 | 3.600 |
| Distance 5-12 | SD 5-12 | 3.600 |
| Distance 7-14 | SD 7-14 | 3.600 |
| Distance 9-2 | SD 9-2 | 3.600 |
| Distance 11-4 | SD 11-4 | 3.600 |
| Distance 13-6 | SD 13-6 | 3.600 |
As seen from figure 6, the deviations of CT dimensional measurements (from reference CMM data) are confined to a range between ±0.7 µm. This range is well within the specification of MPE, for center-to-center sphere distance (SD), of a ZEISS Xradia 620 Versa XRM [8],

with the measuring length  given in mm. The results shown in figure 6 provide a verification of the accuracy of the ZEISS Xradia 620 Versa instrument's metrological capabilities (at FOV = 5 mm) with the added MTX workflow, enabling reliable dimensional measurement performance in small-scale volumes, on the order of (5 mm)3 or less. It is worth noting that, without MTX, the typical deviations of XRM data from calibrated/reference values can be anywhere in the range of 1–30 μm. Appendix
  ).
).
3.2. Verifying measurement repeatability and reproducibility
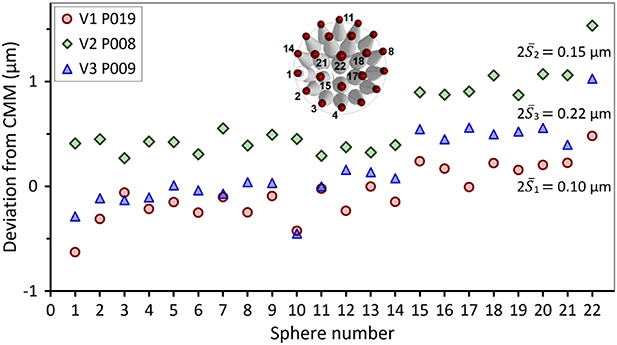
To verify the repeatability and reproducibility of the MTX measurement workflow, 30 different scans of an XRM Check phantom were performed with three different instruments (i.e. 90 scans in total). Figure 7 shows the results of dimensional data for three different measurands: SD 11-4, SD 3-22, and SD 8-18 (naming convention of table 2). The measured value for SD 11-4 (∼3.605 mm) is one of the largest measurements of center-to-center length in the XRM Check multisphere standard. The repeatability standard deviations for measurements of SD 11-4, evaluated by the measurement system are  0.08 μm,
  0.06 μm, and
  0.11 μm; and the reproducibility standard deviation across the three systems is
  0.36 μm. From these measurements for SD 11-4, the deviations between measurements made on the same length feature, repeated through 90 different scans, are in the range of ±0.48 µm. The repeatability and reproducibility standard deviations for the measurement results associated with SD 3-22, and SD 8-18 are listed in figure 7.

Figure 7. Dimensional data for three center-to-center sphere distances (SD), in an XRM Check phantom (shown in inset), when each length measurement is repeated on 90 different scans (from three different XRM systems). Information on the repeatability standard deviations  of the results, assessed per measuring system, are listed for each measurement set.
Download figure:
Standard image High-resolution imageAlthough not all measurement results can be explicitly listed in this document due to space limitations, all measurands listed in table 2 were measured and analyzed. Of a total of 35 characteristics measured per scan, in 30 scans obtained per measurement system, using three different systems, i.e. 3150 measurements in total, the repeatability standard deviations of the measurements were in the range of 0.04–0.15 μm and the reproducibility standard deviations ranged from 0.05 to 0.45 µm. These results serve as a verification of the repeatability and reproducibility of the dimensional data produced by the ZEISS Xradia 620 Versa XRM when coupled with MTX.
Lastly, in figure 7, the deviations between coordinate-based 3D XRM measurements and CMM reference data are confined to the range ±0.95 µm. This range is also within the MPESD specification of equation (4).
4. Industrial applications for dimensional metrology
XRM instruments have been used in a wide range of applications, including semiconductor packages inspection, new materials process development, and biological or biomedical applications [6, 7]. However, apart from some industry proprietary/unpublished industry case studies, there are no reports (to the best of the authors' knowledge) covering precision dimensional metrology applications with 3D XRMs. MTX would support a broader use of 3D XRMs for industrial metrology applications. Therefore, this section presents some illustrative examples of dimensional measurement use cases in small industrial devices (a smartphone camera lens module, the tip of a fuel injector nozzle, and an injection molded plastic connector), performed with XRM systems and assisted by the execution of the MTX workflow.
These examples are, in themselves, interesting and relevant to the quality control industry due to the challenges they pose for nondestructive inspection; but before proceeding, it is worth noting that there are several measurands of interest that are bi-directional in nature, i.e. lengths computed as point-to-point or edge-to-edge distances between geometric elements that lie on diametrically opposite edges (e.g. space between wedges, lengths between walls in internal cavities, diameters, etc). Unlike bi-directional measurements, uni-directional measurements are computed as distances between the centers of two fitted geometrical elements (e.g. circles, cylinders, spheres, etc) or lengths between points that lie on identical edges. Although, with respect to scaling, uni- and bi-directional measurements are sensitive to scale errors of the 3D XRM data (which can be minimized with the aid of the MTX workflow), bi-directional measurements are also sensitive to thresholding influences during surface determination. The accuracy of bi-directional measurements depends on the use of refined thresholding algorithms for edge detection, such as a local adaptive method [21].
In practice, uni-directional center-to-center measurements are generally determined more accurately than bi-directional measurements—as shown by recent CT to CMM comparative studies, e.g. see [1, 27, 30]. As a point of reference for surface-to-surface measurements, when using the MTX workflow, deviations between 3D XRM and tactile CMM data for diameter measurements are presented in figure D1 (in appendix
4.1. Smartphone camera lens assembly
In the assembled state of the smartphone camera lens modules, the evaluation of the geometric properties of the lenses, such as the thickness of the annular wedges, the centering interlock diameters, the spaces between the wedges, the lens-to-lens tilt, the vertex heights and centration, etc, require a non-contact and nondestructive measurement method. These measurements are important for the functional inspection of camera lens modules and the improvement of designs and manufacturing processes to enable the production of versatile cameras that improve the image quality of mobile phones. Figure 8 shows the 3D rendering of a smartphone camera lens assembly reconstructed from XRM data, including a view of cross-sectional images (2D slices). Since the largest dimension of interest in the assembly is around 4.4 mm, a cylindrical region of about 5 mm diameter was scanned from the full camera lens module for dimensional measurements. Here it is worth noting that the 5 mm FOV diameter limitation of the MTX workflow strictly refers to the measurement volume. Although an object should ideally have a diameter of the order of 5 mm or less, so that a full field-of-view scan can be performed with MTX, interior tomographies can be performed on somewhat larger samples, as shown in figure 8, where a semi-transparent view shows the entire camera lens assembly with an outer diameter greater than 5 mm. Before the acquisition of the XRM data in the region of interest (on a 5 mm diameter cylinder, half shown in blue in figure 8), the MTX workflow was applied to verify the measurement accuracy of the XRM system, so that the dimensional measurements extracted from the virtual reconstruction of the camera lens module are accurate. Figure 8 shows examples of typical dimensions of interest in the camera lens in its assembled state.

Figure 8. Rendering of cross-sectional images and 3D XRM data volume for a smartphone camera lens assembly. To reveal the internal geometry, one half side of the 3D rendering is shown in solid view and the other half in semi-transparent appearance. Dimensional measurements can be performed on the camera lens module, in its assembled state, using 3D XRM data.
Download figure:
Standard image High-resolution image4.2. Fuel injector nozzle
To facilitate efficient fuel spraying in internal combustion engines (and to keep emissions requirements lower), fuel injectors use high injection pressures with small nozzle orifices. Since the variability of the geometric characteristics of the injector nozzle, such as the sharpness of the inlet corners and the diameters of the holes, can influence the internal flow and fuel spray in combustion engines, manufacturing deviations of the nominal nozzle design are typically measured for dimensional quality control. In this case, to measure the smallest nozzle holes in the fuel injector (features that are difficult to access with measurement systems using tactile or optical probes), XRM is especially well suited for dimensional measurement. Figure 9 shows cross-sectional image views and cropped/semi-transparent sections of the reconstructed XRM data for a fuel injector nozzle tip, revealing the roughness of the wall surface in the internal cavities and the presence of material porosity. The size of the region of interest, the tip portion of the fuel injector, is revealed by the dimensions shown in the image (∼2.4 mm for the largest diameter). Since the region of interest fits in a volume of less than (5 mm)3, the MTX workflow was ran, prior to scanning the fuel injector tip, to verify the accuracy of the XRM system measurement. Then, dimensional inspection of the small holes in the nozzle was carried out.
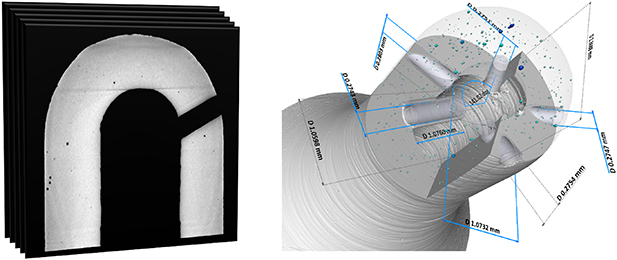
Figure 9. Cross-sectional imaging and 3D XRM data rendering for the tip of a fuel injector nozzle. Cutaway and semitransparent views are used to reveal internal geometry, highlight internal porosity (blue dots), and illustrate dimensional measurements.
Download figure:
Standard image High-resolution imageIt is worth noting, in figure 9, that the blue spots in the image reveal the presence of voids within the walls of the injector nozzle. This is an added benefit of measurement inspections based on XRM volumetric data, so in addition to reconstructing all internal and external surfaces of a mechanical workpiece, material tests can be performed on the same data set. In this case, the resolution capabilities of the ZEISS Xradia Versa system used for XRM scanning allowed for the visualization of the porosity present within the injector nozzle.
4.3. Plastic injection-molded connector
For the inspection of internal and external structures in small plastic injection molded parts, x-ray CT or XRM may be more suitable for geometric measurement compared to contact or vision inspection techniques. Non-contact measurement is important to avoid distortion of flexible or easy-to-deform components. In injection molded workpieces, dimensional measurements help determine deviations in manufactured parts compared to the nominal geometry specified in the original computer-aided design (CAD) models of the part. This is important for product development, quality assurance of functional characteristics of parts, and evaluation of structural integrity of industrially manufactured components and assembled devices. Figure 10 shows the example of a small plastic connector, reconstructed from XRM data, with dimensional measurements and CAD-to-part comparison data. Again, since the largest length measurement of the connector is approximately 4 mm, this sample fits well within a volume of less than (5 mm)3. Therefore, the MTX workflow was used prior to x-ray scanning the sample to verify the accuracy of the XRM system. Then, the XRM data shown in figure 10 was acquired for dimensional measurements.
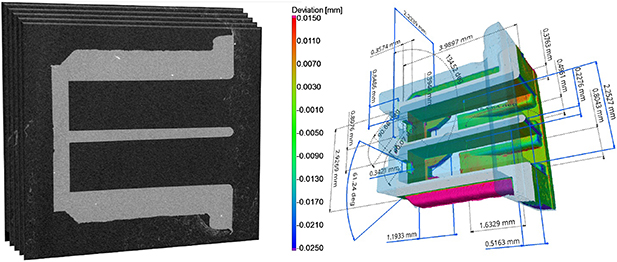
Figure 10. 2D slice visualization and volumetric representation of 3D XRM data for a plastic injection-molded connector. Semi-transparent and cropped section views are used to present dimensional measurements and CAD-to-part comparison data.
Download figure:
Standard image High-resolution image5. Concluding remarks
Due to its unique ability for nondestructive evaluation of part geometries that are not accessible to traditional optical or tactile CMM systems, e.g. internal cavities and difficult-to-reach or 'hidden' features, the number of industrial applications for 3D x-ray imaging techniques have increased in the last two decades. However, in the field of dimensional metrology, the use of 3D x-ray techniques has been limited to lensless imaging methods, such as flat panel-based CT systems, which are typically limited to spatial resolutions greater than 4 μm. To address the ever-increasing demands of 3D x-ray metrology with higher image resolutions, this paper has introduced a measurement workflow, the MTX, to extend dimensional metrology applications to sub-micrometer resolution XRMs.
After the implementation of the MTX workflow on various XRMs, the metrological performance of these systems was evaluated. From the analysis of data in more than 90 XRM scans, the main results show that 3D XRM systems can perform precision dimensional measurements in small-scale volumes, on the order of (5 mm)3 or less, producing repeatable and reproducible measurement data (with repeatability standard deviations in the range of 0.04–0.15 μm and reproducibility standard deviations that ranged from 0.05 to 0.45 µm). In addition, coordinate-based 3D XRM measurements can provide dimensional accuracies comparable to those offered by high-precision tactile CMMs, with deviations within ±0.95 μm range. Without MTX, the typical deviations of the XRM data from the calibrated/reference CMM values can be anywhere in the range of 1–30 μm.
As presented in this article, to assess the MTX workflow, the data were limited to center-to-center sphere distances (on multisphere phantoms), which are uni-directional in nature. In industrial applications, however, there are also measurands of interest that are bi-directional, i.e. lengths that are calculated as point-to-point or edge-to-edge distances between geometric elements that sit on diametrically opposite edges (see section 4 and appendix
The uniqueness of 3D XRMs, with the addition of the MTX workflow, offers completely new capabilities and new opportunities in the domain of dimensional metrology. Application examples were presented in section 4. The MTX workflow will undoubtedly support the wider use of 3D XRMs for industrial applications, bridging the gap between x-ray microscopy imaging and dimensional metrology, while preserving the high spatial resolution characteristics of XRM data—a unique feature that is useful for other types of nondestructive evaluation using the same data (e.g. morphological characterization of internal structures, detection of particle inclusions, and pore size distribution analysis in a material).
Acknowledgments
The authors express their appreciation to current and past ZEISS members (Robert Zarnetta, Bruce Johnson, Nathan Ney, Victor Ninov, Lars Omlor, and Abhinav Mishra) for their helpful discussions and cooperation in providing XRM data. Furthermore, the authors of this article would like to express their appreciation to the reviewers who provided valuable feedback on earlier drafts of this manuscript.
Data availability statement
The data that support the findings of this study are available upon reasonable request from the authors.
Conflict of interest
The authors are employees of ZEISS.
Funding
This work was supported by Carl Zeiss X-ray Microscopy. The funders had no role in study design, data collection and analysis, decision to publish, or the preparation of the manuscript. The Open Access publication fee for this article has been paid by Carl Zeiss Industrial Metrology, LLC.
Appendix A.: Spatial resolution specifications of ZEISS Xradia Versa microscopes

Figure A1. Spatial resolution test results of a ZEISS Xradia 620 Versa microscope, performed using the 40× objective lens, when the test targets are located as close as possible to the detector: (a) with a JIMA resolution target; (b) with a ZEISS Xradia resolution target.
Download figure:
Standard image High-resolution imageTable A1. General technical specifications of ZEISS Xradia Versa 3D x-ray microscopes [43].
| Imaging | ZEISS Xradia 410 Versa | ZEISS Xradia 510 Versa | ZEISS Xradia 610 Versa | ZEISS Xradia 620 Versa |
|---|---|---|---|---|
| Spatial Resolution a | 0.9 µm | 0.7 µm | 0.5 µm | 0.5 µm |
| Resolution at a Distance (RaaD™) a , b (at 50 mm working distance) | 1.5 µm | 1.0 µm | 1.0 µm | 1.0 µm |
| Minimum Achievable Voxel c (Voxel size with sample at maximum magnification) | 100 nm | 70 nm | 40 nm | 40 nm |
| X-ray Source | ||||
| Architecture | Sealed Reflection | Sealed Transmission | Sealed Transmission, Fast Activation | Sealed Transmission, Fast Activation |
| Voltage Range | 20–90 kV, 40–150 kV (Optional) | 30–160 kV | 30–160 kV | 30–160 kV |
| Maximum Output | 8 W, 10 W/30 W (Optional) | 10 W | 25 W | 25 W |
| Detector System | ||||
| ZEISS X-ray microscopes feature an innovative detector turret with multiple objectives at different magnifications. Each objective features optimized scintillators that deliver the highest absorption contrast details. | ||||
| Standard Objectives | 0.4×, 4×, 10×, 20× | 0.4×, 4×, 20× | 0.4×, 4×, 20× | 0.4×, 4×, 20× |
| Standard Objectives | 40× | 40×, Flat Panel Extension (FPX) | 40×, Flat Panel Extension (FPX) | 40×, Flat Panel Extension (FPX) |
| Stages | ||||
| Sample Stage (load capacity) | 25 kg | 25 kg | 25 kg | 25 kg |
| Sample Stage Travel (x, y, z) | 50, 100, 50 mm | 50, 100, 50 mm | 50, 100, 50 mm | 50, 100, 50 mm |
a Spatial resolution measured with ZEISS Xradia 2D resolution target, normal field mode, optional 40× objective. b RaaD working distance defined as clearance around axis of rotation. c Voxel is a geometric term that contributes to but does not determine resolution, and is provided here only for comparison.ZEISS specifies resolution via spatial resolution, the true overall measurement of instrument resolution.
Appendix B.: Grid array for geometric distortion correction in ZEISS Xradia Versa microscopes
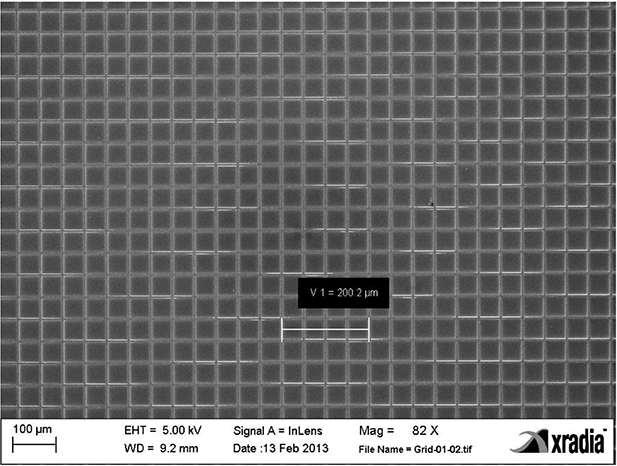
Figure B1. Scanning electron microscope (SEM) image of a patterned grid array, composed of grid lines spaced 50 μm apart, used by ZEISS to perform distortion map corrections on Xradia Versa microscopes. ZEISS 'self-certifies' the accuracy of the grid assembly by SEM verification of the grid array dimensions and their tolerances. Typical tolerances provided by lithographic manufacturers are ±1 µm for line spacing and ±0.5 µm for line width.
Download figure:
Standard image High-resolution imageAppendix C.: Verifying the measurement accuracy of 3D XRM scans with multisphere standards

Figure C1. Deviations of 3D XRM dimensional data, from tactile CMM references, after MTX workflow execution on a ZEISS Xradia 620 Versa instrument. Error limits are also shown;  . All measurands are specified in table 2.
Download figure:
Standard image High-resolution image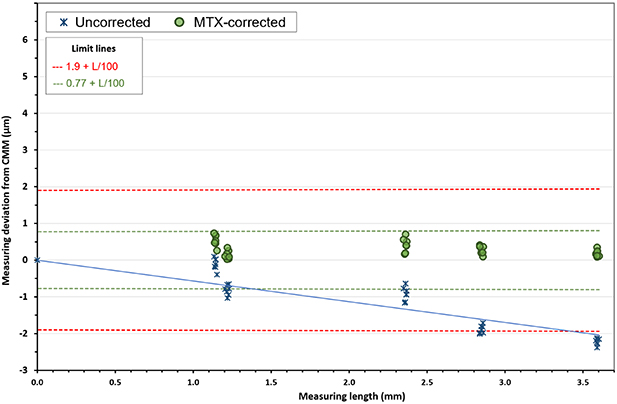
Figure C2. Deviations of 3D XRM dimensional data, from tactile CMM references, after MTX workflow execution on a ZEISS Xradia 620 Versa instrument. Error limits are also shown;  . All measurands are specified in table 2.
Download figure:
Standard image High-resolution image
Figure C3. Deviations of 3D XRM dimensional data, from tactile CMM references, after MTX workflow execution on a ZEISS Xradia 620 Versa instrument. Error limits are also shown;  . All measurands are specified in table 2.
Download figure:
Standard image High-resolution image
Figure C4. Deviations of 3D XRM dimensional data, from tactile CMM references, after MTX workflow execution on a ZEISS Xradia 620 Versa instrument. Error limits are also shown;  . All measurands are specified in table 2.
Download figure:
Standard image High-resolution imageAppendix D.: Deviations of 3D XRM diameter measurements from tactile CMM references
Figure D1. Deviations between XRM and CMM data for diameter measurements on an XRM Check phantom (shown in inset), when three different ZEISS Xradia 620 Versa instruments are used. The sphere probing strategy is illustrated in figure 5. From performing three measurement repeats per measurand, mean repeatability standard deviations  for each measuring system are listed in the figure.
Download figure:
Standard image High-resolution image
Footnotes
- 4
At present, the dimensional measurements obtained by tactile CMMs are generally a more accurate approximation to the 'true values' associated with the measurands in question than the measurements obtained by CT. The measurement uncertainties reported with the CMM technique are typically smaller than the measurement uncertainties associated with CT dimensional data [1, 11, 24], and the traceability chain is also more clearly defined with CMM systems.
- 5
A scintillator-lens-CCD detector coupling is used for the indirect conversion of x-ray photons into electrically charged signals (x-ray photons are first converted into visible light by the scintillator detector) which are captured by a metal oxide semiconductor sensor (CCD, or charge coupled device). A CCD is divided up into a large array of small light-sensitive cells (known as pixels) to capture light via the photoelectric effect and create a digital image.
- 6
For reference, a ZEISS Xradia 620 Versa x-ray microscope with an optional flat panel extension has a full field-of-view (FOV) of 140 mm wide by 93 mm high, which can be extended to 165 mm using stitching or merging volume functions, but the physical size of the sample that fits inside the instrument can be larger. Similarly, when using the 0.4× lens the maximum FOV would be 50 mm × 50 mm, but this can be expanded by combining the volume of separate scans. Changing the objective lens to 4×, which is the lens of most interest in this paper, the maximum FOV for a single scan is 6.5 mm × 6.5 mm.
- 7
A voxel is a data value representing x-ray attenuation in a 3D element located in the specimen that, in turn, is broadly related to the average density of material in the volume [1, 26]. The 'voxel size' represents the dimensions of the basic volume element of the tomographic data into which the 3D reconstructed volume is sub-divided after reconstruction; it represents a '3D pixel' in the volumetric dataset. A unit of 'voxel size' does not represent a measure of 'spatial resolution', see [1, 13].
- 8
There are also methods that propose the use of a simple two-sphere phantom dumbbell to determine and correct voxel size errors. However, these are not reliable because they measure only one distance, so they rely on a single data point for interpolation and would only scale lengths of similar dimensions to that distance. In addition, current standards for the performance evaluation of 3D x-ray systems used for dimensional metrology, i.e. the VDI/VDE 2630-1.3 [36] and the ASME B89.4.23 [37], require a minimum of 35 or 28 center-to-center lengths to be measured per scan, not just one, in a total of six or seven different spatial directions.
- 9
The MTX workflow was conceived specifically for the ZEISS Xradia Versa instruments, but with further software development it could be applied to other XRM systems.