


Abstract
Recently, the performance of the new-generation BeiDou Navigation Satellite System (BDS) satellite clocks has attracted considerable attention. There are two types of BDS clocks developed in China—namely, the new rubidium (Rb-II) and passive hydrogen maser (PHM)—and these can affect positioning, navigation and timing (PNT) services. In this paper, to comprehensively evaluate and analyze the performance of BDS satellite atomic clocks, the physical characteristics are exhibited, including phase, frequency, frequency drift and noise. The physical characteristics are applied to detect the switching of satellite clocks. The frequency stability of atomic clocks is assessed by overlapping Allan deviation (ADEV) and overlapping Hadamard deviation (HDEV). The periodic characteristics of satellite clock bias data are studied through spectrum analysis. Based on 550 day precision satellite clock bias data provided by Wuhan University, China, experiments were performed, focusing on the performance of the Rb-II and PHM clocks installed on BDS-3. Some valuable conclusions are obtained: (a) the BDS-3 satellite clocks perform better than BDS-2. The root mean square value of the frequency drift of BDS-3 satellite clocks is enhanced by 41% compared to BDS-2. The noise of BDS-3 is 0.216 ns, which is 55% better than BDS-2. (b) The frequency stability of BDS-2 satellite clocks is worse than that of BDS-3. The mean daily stability of BDS-2 and BDS-3 satellite clocks by ADEV is 5.29 × 10⁻¹⁴ and 5.36 × 10⁻¹⁴, respectively, while that with HDEV is 2.35 × 10⁻¹⁴ and 0.70 × 10⁻¹⁴. For PHM clocks, the stability at 10 000 s with ADEV and HDEV is 2.29 × 10⁻¹⁴ and 2.25 × 10⁻¹⁴, respectively, while the daily stability is 0.77 × 10 −14 and 0.67 × 10⁻¹⁴, respectively. (c) BDS geostationary orbit (GEO) and inclined GEO satellite atomic clocks have multiple significant periodic terms while the medium earth orbit satellite clocks only own one or two, which are related to the corresponding satellite orbital periods.
Export citation and abstract BibTeX RIS
1. Introduction
The BeiDou Navigation Satellite System (BDS) has completed the three-step strategy of the BDS-1 experimental system, BDS-2 regional navigation satellite system [1] and BDS-3 global navigation satellite system (GNSS) [2]. On June 28, 2020, there were over 40 satellites in orbit, including 15 BDS-2 and 29 BDS-3 satellites. BDS-2 contains three different orbit types to achieve the regional enhancement goal in the Asia-Pacific area, including five geostationary orbit (GEO) satellites, seven inclined geostationary orbit (IGSO) satellites and three medium earth orbit (MEO) satellites [3]. There have been 29 BDS-3 satellites in orbit, including two GEO satellites (C59, C60), 3 IGSO satellites (C38–C40) and 25 MEO satellites (C19–C37, C41–C46) (www.csno-tarc.cn/system/constellation). Furthermore, BDS constellation deployment was accomplished on 23 June 2020, and this will provide more comprehensive global services in the next few years [4, 5].
The satellite atomic clock is a core component of satellite operation that provides an important time reference for the navigation system. Thus, the performance of the satellite atomic clock plays an important role in the maintenance of position [6, 7], navigation [8] and timing [9, 10] (PNT) services. Precise clock bias data can be used to evaluate the performance of satellite atomic clocks. Therefore, the different methods to calculate the clock bias data affect the performance of atomic clocks. The main methods for calculating the clock bias are two-way satellite time and frequency transfer (TWSTFT) [11] and orbit determination and time synchronization (ODTS). For the ODTS method, the satellite clock bias data are estimated in conjunction with the satellite orbits. Thus, the precise orbit determination strategy affects the satellite clock estimation, and the satellite clock estimates absorb part of the orbit error (mostly the radial component), resulting in harmonic errors correlated with the orbit period [12]. In contrast, the two-way characteristic of the TWSTFT method can eliminate the orbit error in clock measurement [13]. Several studies have been conducted to evaluate the performance of clock bias using these two methods. Wu et al [14] used the TWSTFT method to estimate the precise clock bias data and evaluated certain characteristics of the BDS-3 experimental satellite atomic clock, such as the frequency stability, the clock prediction accuracy and the clock frequency variation. In addition, Jia et al [15] analyzed the performance of BDS-3 satellite clocks considering the ODTS noise, based on the precise clock product from Xi'an Institute of Surveying and Mapping (XRS), China. Generally, the precision clock products of the International GNSS Service (IGS) are obtained using the ODTS method. Therefore, the evaluation and analysis of the precision clock product obtained by ODTS still need further study.
With the construction of BeiDou, satellite atomic clocks have been independently developed in China. The BDS-3 satellites are based on the new rubidium (Rb-II) and passive hydrogen maser (PHM) clocks, instead of the rubidium clocks (Rb) installed on the BDS-2 [16]. Research into the performance of GPS satellite clocks has considerably improved in recent years [12, 17–19]. Performance evaluation and analysis of BDS, Galileo and GLONASS satellite atomic clocks has been carried out in succession [20–22]. With the rapid advancement of the BDS, the performance of BDS-2 satellite atomic clocks has been studied widely over the past decade [23–25]. Wang et al analyzed the frequency stability of BDS-2 clocks, but the analysis focused more on the correlation between the orbit period and clock period, instead of the characteristics of the clocks [26]. Wang et al studied the long-term characteristics and performance of the BDS-2 satellite clock over three years, achieving a comprehensive assessment. However, this paper only focused on the analysis of clock bias data characteristics [25]. Huang et al provided a more complete analysis of the long-term satellite situation and the switching of BDS-2 satellite atomic clocks [27]. More recently, observers have applied more attention to the performance analysis of BDS-3 satellite clocks. Several research studies have been conducted to analyze the characteristics of the BDS-3 Rb-II and passive hydrogen clock. Zhao et al performed a preliminary assessment of the orbit and clock of the BDS-3 experimental satellites, focusing on the clock bias data precision and positioning accuracy for precise point positioning [28]. Lv et al evaluated the stability, periodicity and short-term prediction accuracy of five BDS-3 satellites, with the 30 day clock offset data calculated by PANDA software [29]. They conclude that the PHM clock carried on C32 has the best stability for any averaging intervals among the BDS satellite clocks, with a 10 000 s stability value of 2.6  , while the stability of Rb-II on BDS-3 is superior to that of the BDS-2 Rb clock from 300 s to 3000 s. Moreover, for the BeiDou-3 satellite clock, the root mean square (RMS) of 1 h prediction is less than 0.16 ns. However, they ignored the physical characteristics of atomic clocks. Wu et al studied the frequency stability, prediction accuracy and rate variation characteristics of the Rb-II and the PHM clocks on BDS-3 experimental satellites [17]. They showed that the PHM clock day stability of BDS-3 is approximately 6 × 10⁻¹⁵, and the 2 h and 10 h clock prediction precision values of BDS-3 PHM are 0.26 ns and 0.4 ns, respectively, which is better than most of the GPS Block IIF and Galileo clocks. Yan et al estimated the frequency stability of satellite clocks and the correlation between the radial precision and the standard deviation (STD) of clock bias [30]. Their experiment showed that the stabilities of the BeiDou-3 and BeiDou-3e onboard clocks are better than those of BeiDou-2 by factors of 2.84 and 1.61 at an averaging time of 1000 and 10 000 s, respectively. However, the performance analysis of the BDS-3 satellite atomic clock pays close attention to the individual experimental satellites in the BDS-3, and most of them are the analysis and the evaluation of short-term studies at present. The performance evaluation index of the BDS-3 satellite atomic clock is single-aspect, and it is often based on the stability of the satellite atomic clock, which may contribute to the BDS PNT services. To date, fewer studies have analyzed the physical indices, such as the phase, frequency and frequency drift; however, these indices play an important role in the autonomous integrity monitoring of onboard satellite atomic clocks, the monitoring and assessment of satellite navigation system performance and the estimation of satellite clock offset.
The rest of the paper is organized as follows. Section 2 introduces the source of precision clock bias data, provides detailed information on the BDS satellite and explains the preprocessing scheme of clock bias data. In section 3, the long-term physical characteristics (phase, frequency, frequency drift and noise) of the Rb, Rb-II and PHM atomic clocks installed on BDS-2/BDS-3 are compared and evaluated based on the clock bias data. In section 4, a detailed comparative analysis of the frequency stability among different atomic clocks with overlapping Allan deviation (ADEV) and overlapping Hadamard deviation (HDEV) is conducted to assess their performance. In section 5, fast Fourier transform (FFT) is used to extract the clock bias periodicity and analyze its correlation with the orbit period of different orbit types of BDS, considering the influence of ODTS on the clock difference calculation. In addition, the performance of the Rb-II and PHM clocks on BDS-3 is compared with Rb clocks on BDS-2. The study is concluded in section 6.
2. Data collection and preprocessing
2.1. Data collection
Currently, several multi-GNSS experiment (MGEX) analysis centers provide BDS precise clock offset products, such as the Center for Orbit Determination in Europe (CODE), the European Space Agency (ESA), GeoForschungsZentrum (GFZ), Shanghai Observatory (SHAO) and Wuhan University (WHU). Among these institutions, only GFZ, ESA and WHU provide BDS-3 precise clock offset products. Table 1 summarizes the precise clock offset products by different institutions, where 'G', 'R', 'E', 'C' and 'J' denote global positioning system (GPS), Global Navigation Satellite System (GLONASS), Galileo, BDS and QZSS, respectively.
Table 1. Summary of the precise MGEX offset clock products as of July 3, 2020.
| Institutions | ID | Constellations | Clocks | Remarks |
|---|---|---|---|---|
| CODE | COD0MGXFIN | G, R, E, C, J | 30 s | GEOs excluded |
| ESA | ESA0MGNFIN | G, R, E, C, J | 30 s | BDS-3 included, GEOs excluded |
| GFZ | GFZ0MGXRAP | G, R, E, C, J | 30 s | BDS-3 included |
| SHAO | SHA0MGXRAP | G, R, E, C | 5 min | BDS-3 included |
| WHU | WUM0MGXFIN | G, R, E, C, J | 30 s | BDS-3 included |
Since January 2019, WHU has provided BDS-2 and BDS-3 precise clock offset products (ftp://igs.ensg.ign.fr/pub/igs/products/mgex/). Moreover, the STD of WHU BDS-2 and BDS-3 precise clock offset products is 0.51 ns [31] and 0.34 ns [32], respectively, which meets the requirements of analyzing the characteristics of BDS satellite atomic clocks. Thus, WHU precision clock products with a sampling interval of 30 s from 1 January 2019 to 3 July 2020 are selected in this paper to analyze the performance and the characteristics of BDS satellite atomic clocks.
Since WHU precision clock products are jointly resolved by ODTS through the BeiDou experimental tracking network and the MGEX tracking network sites [33], the orbit type of the satellite should be considered. In addition, the various types of satellite clocks have different characteristics. Table 2 shows the pseudo random noise (PRN), launch date and status of BDS satellites. Table 3 lists the types of BDS satellite orbits and atomic clocks. It is apparent from table 3 that most BDS-3 satellites belong to MEO, installed with Rb-II and PHM clocks.
Table 2. Relevant information of BDS satellite.
| PRN | Launch date | Status | PRN | Launch date | Status | PRN | Launch date | Status |
|---|---|---|---|---|---|---|---|---|
| C01 | 17 May 2019 | In operation | C19 | 05 November 2015 | In operation | C37 | 19 November 2018 | In operation |
| C02 | 25 October 2012 | In operation | C20 | 05 November 2015 | In operation | C38 | 20 April 2019 | In operation |
| C03 | 05 June 2017 | In operation | C21 | 12 February 2018 | In operation | C39 | 25 June 2018 | In operation |
| C04 | 01 November 2010 | In operation | C22 | 12 February 2018 | In operation | C40 | 05 November 2019 | In operation |
| C05 | 25 February 2012 | In operation | C23 | 29 July 2018 | In operation | C41 | 16 December 2019 | In operation |
| C06 | 01 August 2010 | In operation | C24 | 29 July 2018 | In operation | C42 | 16 December 2019 | In operation |
| C07 | 18 December 2010 | In operation | C25 | 25 August 2018 | In operation | C43 | 23 November 2019 | In operation |
| C08 | 10 April 2011 | In operation | C26 | 25 August 2018 | In operation | C44 | 23 November 2019 | In operation |
| C09 | 27 July 2011 | In operation | C27 | 12 January 2018 | In operation | C45 | 23 September 2019 | In operation |
| C10 | 02 December 2011 | In operation | C28 | 12 January 2018 | In operation | C46 | 23 September 2019 | In operation |
| C11 | 30 April 2012 | In operation | C29 | 30 March 2018 | In operation | C59 | 01 November 2018 | In operation |
| C12 | 30 April 2012 | In operation | C30 | 30 March 2018 | In operation | C60 | 09 March 2020 | In operation |
| C13 | 30 March 2016 | In operation | C32 | 19 September 2018 | In operation | C31 | 30 March 2015 | In test |
| C14 | 19 September 2012 | In operation | C33 | 19 September 2018 | In operation | C56 | 30 September 2015 | In test |
| C16 | 10 July 2018 | In operation | C34 | 15 October 2018 | In operation | C57 | 25 July 2015 | In test |
| — | — | — | C35 | 15 October 2018 | In operation | C58 | 25 July 2015 | In test |
| — | — | — | C36 | 19 November 2018 | In operation | C61 | 23 June 2020 | In test |
Table 3. Overview of the types of orbits and satellite atomic clocks of BDS satellites.
| Satellite type | Orbit | Clock type | Manufacturer | PRN |
|---|---|---|---|---|
| BDS-2 | GEO | Rb | CASC | C01, C02, C03, C04, C05 |
| IGSO | Rb | CASC | C06, C07, C08, C09, C10, C13, C16 | |
| MEO | Rb | CASC | C11, C12, C14 | |
| BDS-3 | MEO | Rb-II | CASC | C19, C20, C21, C22, C23, C24, C32, C33, C36, C37, C45, C46 |
| GEO | PHM | CASC | C59, C60 | |
| IGSO | PHM | CASC | C38, C39, C40 | |
| MEO | PHM | CASC | C41, C42 | |
| MEO | PHM | SECM | C25, C26, C27, C28, C29, C30, C34, C35, C43, C44 |
2.2. Data preprocessing
There are satellite clock jumps and outliers in WHU precision clock products. Therefore, it is necessary to perform preprocessing, including clock jump detection, outlier detection and repair, on the clock offset data. The median method (MAD) is the most commonly used method for outlier detection. However, MAD ignores some small values. Therefore, a combined quality control scheme is used in this paper for BDS satellite clock offset data, which mainly includes clock jump detection, combined outlier detection and missing data interpolation. Compared with the phase data, the epoch-differenced clock offset can significantly highlight outlier data. Therefore, the epoch-differenced clock offset data are used first to detect and repair the outlier values, and then the clean epoch-differenced clock offset data are used to recover the clock phase.
2.2.1. Clock jump detection.
The phase jump corresponds to the peak value of epoch-differenced clock offset. In this case, the threshold value of epoch-differenced clock offset is set to identify the clock jump. If there are clock jumps in a single-day sequence, the clock offset data need to be segmented. Figure 1 shows the single-day phase and epoch-differenced clock offset sequences of the C05 satellite on 5 September 2019, indicating the corresponding relationship between the phase jump and the epoch-differenced clock offset value. It can be seen from the figure that the epoch-differenced clock offset data have a peak value at the time when the clock jump occurs in the phase sequence.
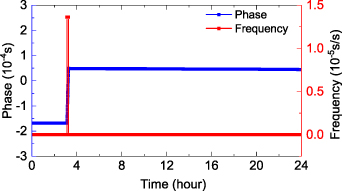
Figure 1. Phase and epoch-differenced clock offset sequences of C05 satellite on 5 September 2019.
Download figure:
Standard image High-resolution image2.2.2. Outlier detection combination scheme.
The outliers were removed from the epoch-differenced clock offset in two stages.
Firstly, the MAD scheme is used for outlier detection. The epoch-differenced clock offset data that meet the conditions  are regarded as outliers [34, 35]. MAD is the threshold, and the expression is as follows:

where  is the epoch difference of clock offset sequences, med is the median of the sequence data, and k is a positive integer that is set to 3.
Next, the Baarda method is used for outlier detection. There are two kinds of clock error models: the first-order polynomial model and the second-order polynomial model [36]. Since the influence of the second-order term on clock error is far less than the magnitude of gross error, we choose the first-order polynomial to build the clock error observation model in the process of gross error detection. This method not only reduces the amount of calculation, but also does not affect the actual results of gross error detection. The primary model of clock error is as follows:

where  is the clock phase data,
  and
and  are the phase and frequency, respectively,
  is the fitting residual for the noise, and n is the number of clock offset data.
According to the least-square criterion, the estimated parameters can be obtained:

where  are the clock offset series fitting residuals.
The standardized residuals  can be obtained as follows:
where  is the mean squared error of unit weight. For the constructed test statistics
  , if
, if  , it can be determined that the corresponding data is outlier.
2.2.3. Imputation of missing data.
For the data marked as the outliers and a small part of missing data in a day, if there are data at both ends of the missing segment, linear interpolation is used to fill in [37]. Otherwise, the missing data are zeroed to prevent the introduction of data extrapolation errors. For missing data throughout the day, all are set to zero and no padding is performed.
To verify the effectiveness of the above-described preprocessing, figure 2 shows C09, C21 and C26 before and after the preprocessing on 15 October 2019. It can be seen that the combined outlier detection and repair scheme can effectively handle the outliers.
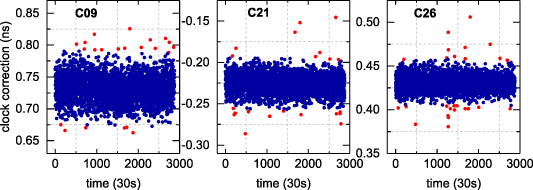
Figure 2. Epoch-differenced clock offset sequences of C09, C21 and C26 before and after the preprocessing on 15 October 2019. Outliers identified are marked as red dots.
Download figure:
Standard image High-resolution image3. Phase, frequency, drift and noise analysis
The physical characteristics of phase, frequency, frequency drift and noise are important indicators to evaluate the performance of atomic clocks. Furthermore, these physical characteristics can be used to distinguish the switching of satellite atomic clocks. The quadratic polynomial model can estimate the value of physical characteristics based on the precise clock offset product. The polynomial model can be described as

where  is the clock phase data,
  ,
,  and
and  are phase, frequency and frequency drift, respectively,
  is the fitting residual for the noise, and n is the number of clock offset data.
Based on the preprocessed precise clock offset data, according to the least-square regression, the second-order polynomial fitting is performed in days to obtain the phase, frequency, drift and residual data. This section analyzes the physical characteristics and the detection of the switching of the BDS-2 and BDS-3 satellite atomic clocks.
3.1. Phase
Figures 3 and 4 show the phase sequences of the BDS-2 and BDS-3 satellite atomic clocks calculated by the polynomial model during the research period, respectively. It can be seen from the phase sequences given in figures 3 and 4 that there are phase jumps in the BDS satellite atomic clocks. The main reason for the phase jumps is the active phase adjustment performed by the ground control station to regulate the time synchronization error within the predetermined threshold between the satellite and the station. However, these phase adjustments destroy the continuity of the satellite clock.
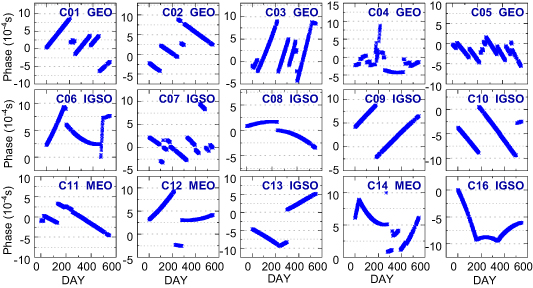
Figure 3. The phase sequences of the BDS-2 satellite atomic clocks during the research period.
Download figure:
Standard image High-resolution image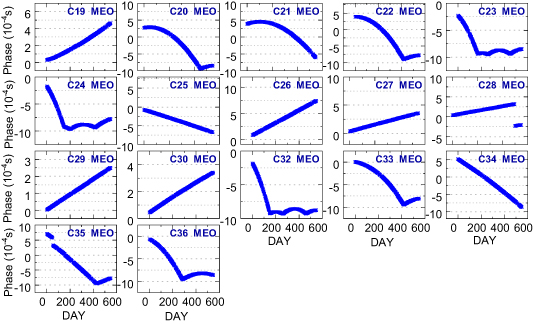
Figure 4. The phase sequences of the BDS-3 satellite atomic clocks during the research period.
Download figure:
Standard image High-resolution imageTable 4 lists the number of phase jumps of the BDS satellite atomic clocks to evaluate the continuity of each atomic clock. It can be seen that the phase adjustments of the BDS-3 satellite atomic clock during the research period are far less than those of the BDS-2 satellites because the cumulative deviation increases faster with the aging of BDS-2 satellite atomic clock hardware.
Table 4. The number of phase jumps of BDS satellite atomic clocks.
| PRN | Phase jumps | PRN | Phase jumps | PRN | Phase jumps | PRN | Phase jumps |
|---|---|---|---|---|---|---|---|
| C01 | 4 | C06 | 3 | C19 | 0 | C25 | 0 |
| C02 | 4 | C07 | 9 | C20 | 0 | C26 | 0 |
| C03 | 5 | C08 | 1 | C21 | 0 | C27 | 0 |
| C04 | 12 | C09 | 1 | C22 | 0 | C28 | 1 |
| C05 | 11 | C10 | 2 | C23 | 0 | C29 | 0 |
| — | — | C13 | 2 | C24 | 0 | C30 | 0 |
| C11 | 4 | C16 | 2 | C32 | 0 | C34 | 0 |
| C12 | 2 | — | — | C33 | 0 | C35 | 2 |
| C14 | 5 | — | — | C36 | 0 | — | — |
For BDS-2 satellite clocks, it can be seen from figure 3 and table 4 that the phase adjustment times of the GEO satellite atomic clocks are the most frequent among the BDS-2 satellites. In detail, C01, C02 and C03 are adjusted 4, 4 and 5 times, respectively, while both C04 and C05 are adjusted more than ten times. The phase adjustment numbers of the IGSO and MEO satellite atomic clocks are considerable. Except for C07, which is adjusted nine times, the adjustment numbers of the satellites are all below five times, while the adjustment times of C08 and C09 are the least.
As shown in figure 4 and table 4, among the BDS-3 satellites, the PHM clocks have not undergone phase adjustment, except for C28 and C35, which have been adjusted once or twice. Moreover, the Rb-II clocks have not undergone phase adjustment with good continuity. The phase adjustment numbers of PHM clocks are less than those of Rb-II clocks. Furthermore, it can be seen from figure 4 that the phases of Rb-II clocks show a secondary trend, while those of the PHM clocks show a linear trend.
From the phase adjustment numbers and trends of the different types of clocks, it can be inferred that the PHM clocks installed on BDS-3 have the least number of phase adjustments and show a long-term linear change trend with the best continuity. The BDS-3 satellite Rb-II clocks have fewer phase adjustments and a quadratic long-term change trend with good continuity. The continuity of the rubidium clock carried by the BDS-2 is slightly inferior to those of the BDS-3. The GEO satellite atomic clocks have the most phase adjustments and the worst continuity.
3.2. Frequency
Figures 5 and 6 show the frequency sequences of the BDS-2 and BDS-3 satellite atomic clocks during the research period, respectively. It can be seen from the frequency change sequences of figures 5 and 6 that there are frequency jumps and slope changes during the operation of the BDS clocks. The frequency jumps and the slope changes directly affect the continuity and the service performance of the satellite clock.
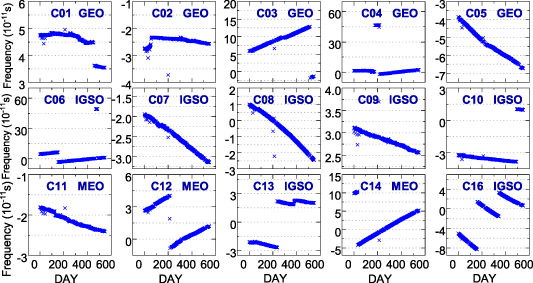
Figure 5. The frequency sequences of the BDS-2 satellite atomic clocks during the research period.
Download figure:
Standard image High-resolution image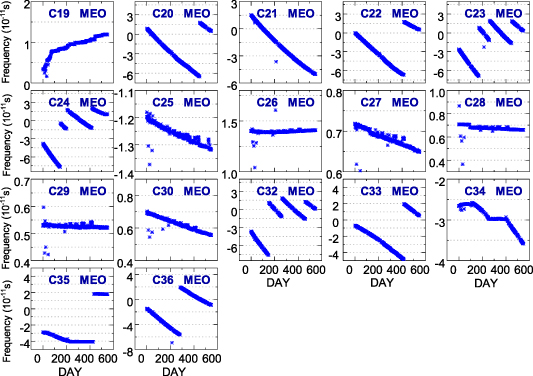
Figure 6. The frequency sequences of the BDS-3 satellite atomic clocks during the research period.
Download figure:
Standard image High-resolution imageTo further analyze the frequency change, table 5 shows the number of frequency jumps and slope changes. It can be seen from table 5 that the number of frequency adjustments of the BDS-3 satellite atomic clocks is less than that of BDS-2, and the number of frequency adjustments is less than the number of phase adjustments from table 5. Among them, the frequencies of BDS-3 PHM clocks were not adjusted except for C28, C34 and C35. The frequencies of the Rb-II clocks on C23, C24 and C32 were adjusted three times, while those on C20, C22, C33 and C36 were only adjusted once, and those on C19, C21 were not adjusted. Moreover, the frequencies of Rb clocks on BDS-2 satellites were adjusted 1, 2 or 3 times except for C07, C08 and C09, which were not adjusted. Therefore, the frequency adjustment numbers of the BDS-3 PHM clocks are the least, implying the bes continuity.
Table 5. The number of frequency jumps and slope changes.
| PRN | Frequency adjustments | PRN | Frequency adjustments | PRN | Frequency adjustments | PRN | Frequency adjustments |
|---|---|---|---|---|---|---|---|
| C01 | 1 | C06 | 3 | C19 | 0 | C25 | 0 |
| C02 | 1 | C07 | 0 | C20 | 1 | C26 | 0 |
| C03 | 2 | C08 | 0 | C21 | 0 | C27 | 0 |
| C04 | 2 | C09 | 0 | C22 | 1 | C28 | 1 |
| C05 | 1 | C10 | 1 | C23 | 3 | C29 | 0 |
| — | — | C13 | 2 | C24 | 3 | C30 | 0 |
| C11 | 1 | C16 | 2 | C32 | 3 | C34 | 3 |
| C12 | 1 | — | — | C33 | 1 | C35 | 2 |
| C14 | 1 | — | — | C36 | 1 | — | — |
3.3. Frequency drift
Figures 7 and 8 show the frequency drift sequences of the BDS-2 and BDS-3 satellite atomic clocks during the research period, respectively. It can be seen from figures 7 and 8 that the frequency drift values of the BDS satellite atomic clocks are relatively stable, in the order of 1 × 10⁻¹⁸. The dispersion degree of the frequency drift sequences of BDS-3 satellite atomic clocks is less than that of the BDS-2.
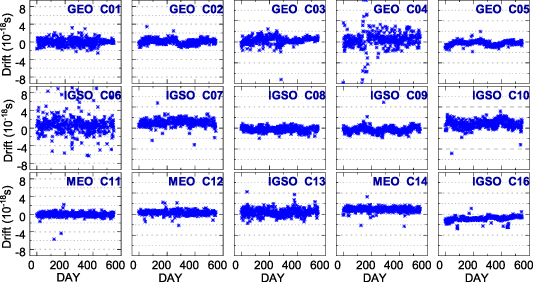
Figure 7. The frequency drift sequences of the BDS-2 satellite atomic clocks during the research period.
Download figure:
Standard image High-resolution image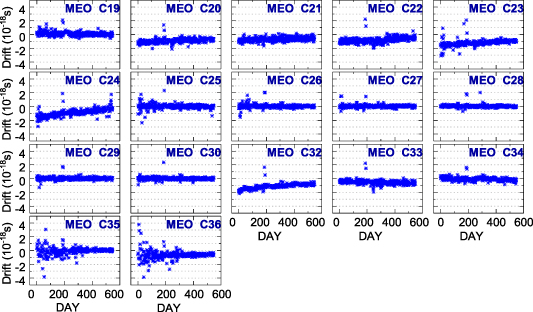
Figure 8. The frequency drift sequences of the BDS-3 satellite atomic clocks during the research period.
Download figure:
Standard image High-resolution imageFrom figure 7, it can be found that fluctuation occurs in the frequency drift sequences of BDS-2 satellite atomic clocks. For example, the frequency drift sequences of the C02, C05, C08, C09 and C10 satellite atomic clocks show periodic fluctuation. For the C10 satellite clock, the frequency drift sequence decreases gradually from day 1 to 150 and increases gradually from day 150 to 300. We deduced that the periodic fluctuations in some BDS-2 satellite clocks are due to the aging of satellite hardware facilities. However, the long-term periodic term of the remaining BDS-2 satellite frequency drift sequences is not significant enough. Furthermore, figure 8 shows that the frequency drift sequences of BDS-3 Rb-II and PHM clocks have no significant periodic fluctuations. Therefore, the conclusions about periodicity still need to be further explored and verified.
In order to numerically analyze the frequency drift, figure 9 provides the RMS values of frequency drift corresponding to the orbits and types of atomic clocks in BDS-2/BDS-3. As shown in figure 9, the BDS-2 GEO, IGSO and MEO satellite atomic clock frequency drift RMS values are 1.64 × 10⁻¹⁸, 1.26 × 10⁻¹⁸ and 7.86 × 10⁻¹⁹, respectively, and the satellite orbit affects the frequency drift characteristics. The mean RMS value of frequency drift of BDS-3 satellite atomic clocks is 0.73 × 10⁻¹⁸, which is an increase of 41% compared to the value of 1.24 × 10⁻¹⁸ of the BDS-2. The frequency drift mean RMS value of PHM clocks is 3.15 × 10⁻¹⁹, which is an increase of 73% compared to the 1.15 × 10⁻¹⁸ of Rb-II clocks.
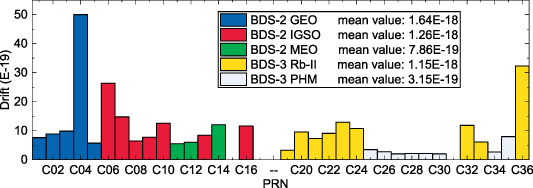
Figure 9. RMS values of frequency drift of BDS-2/BDS-3 satellite clocks and mean RMS values of different types.
Download figure:
Standard image High-resolution image3.4. Noise
The noise of the atomic clock mainly involves the fitting residuals and accuracy [34]. Figures 10 and 11 show the residuals of BDS-2 and BDS-3, respectively, after the quadratic model fitting in days during the experimental period. It can be seen from figure 10 that the BDS-2 satellite clock fitting residuals are mainly distributed within 3 ns, while those of BDS-3 are distributed within 1 ns, as seen in figure 11. Thus, the fitting residuals of BDS-2 satellite clocks are overall greater than those of BDS-3.
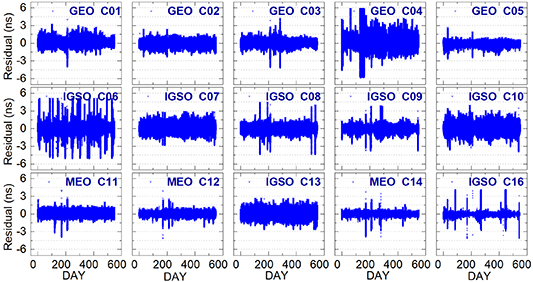
Figure 10. The fitting residual sequences of the BDS-2 satellite atomic clocks during the research period.
Download figure:
Standard image High-resolution image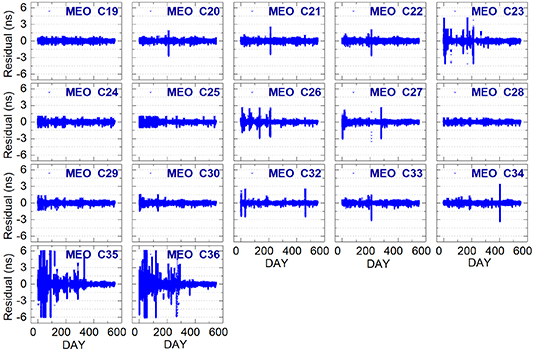
Figure 11. The fitting residual sequences of the BDS-3 satellite atomic clock during the research period.
Download figure:
Standard image High-resolution imageIt should also be noted from figure 10 that there is still long-term periodic noise in the fitting residuals. For example, in the period of day-of-year (DOY) 001–200 in 2019, the fitting residuals of C05 decrease with time. The BDS-3 satellites also have similar periodic noise, as shown in figure 11. The main reason is that the mid-to-long terms are not considered when performing quadratic polynomial fitting, such as the running times of the satellite.
Figure 12 lists the RMS values of BDS-2 and BDS-3 satellite fitting residuals to evaluate the fitting accuracy. The fitting accuracy of BDS-3 is 0.216 ns, which is 55% better than the 0.484 ns of BDS-2. The fitting accuracy of the BDS-2 GEO, IGSO and MEO satellite atomic clocks is 0.515 ns, 0.546 ns and 0.288 ns, respectively. The fitting accuracy of the Rb-II and PHM clocks is 0.221 ns and 0.211 ns, respectively, which is better than BDS-2.
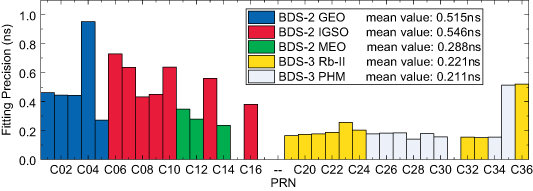
Figure 12. The RMS values of BDS-2 and BDS-3 satellite fitting residuals and mean value of different types.
Download figure:
Standard image High-resolution image3.5. The switching of satellite clocks
The switching detection of clocks is based on the physical characteristics of the BDS-2 and BDS-3 satellite atomic clocks. Since the frequency drift of the BDS satellite clocks is not adjustable, the switching of the satellite clocks can be judged according to frequency, frequency drift and noise. The switching detection model in the literature [24] is improved and applied in this experiment. The improved switching detection model is described by the following steps.
- (a)Mark the satellite clocks with significant changes in frequency drift.
- (b)Record the time node of the frequency drift change.
- (c)Check whether the frequency slope and the noise level have changed at the recorded time node.
- (d)Determine the switching of the satellite clock.
Table 6 shows the number of frequency drift index changes. It can be seen that the frequency drift sequences of C01, C03, C35 and C36 are changed. Furthermore, C01, C03, C35 and C36 changed in March 2020, May 2020, October 2019 and October 2019, respectively. Next, we check whether the frequency slopes of the four satellite clocks have changed synchronously, according to figures 5 and 6. Obviously, the frequency slopes of C01, C03, C35 and C36 have changed synchronously. Similarly, the noise level has also changed at the corresponding time node, as seen in figures 10 and 11. Figure 11 shows that the fitting residuals of the C35 and C36 satellites are in the order of 3 ns before October 2019, and tend to be distributed stably and concentrated within 1 ns after October 2019. Therefore, the atomic clocks of C01, C03, C35 and C36 were switched in March 2020, May 2020, October 2019 and October 2019, respectively.
Table 6. The change number of frequency drift.
| PRN | Drift changes | PRN | Drift changes | PRN | Drift changes | PRN | Drift changes |
|---|---|---|---|---|---|---|---|
| C01 | 1 | C06 | 0 | C19 | 0 | C25 | 0 |
| C02 | 0 | C07 | 0 | C20 | 0 | C26 | 0 |
| C03 | 1 | C08 | 0 | C21 | 0 | C27 | 0 |
| C04 | 0 | C09 | 0 | C22 | 0 | C28 | 0 |
| C05 | 0 | C10 | 0 | C23 | 0 | C29 | 0 |
| C13 | 0 | C24 | 0 | C30 | 0 | ||
| C11 | 0 | C16 | 0 | C32 | 0 | C34 | 0 |
| C12 | 0 | — | — | C33 | 0 | C35 | 1 |
| C14 | 0 | — | — | C36 | 1 | — | — |
Note: Satellites with drift changes are marked in bold.
It is worth noting that two significant slope changes can be spotted from figure 6 for the C34 satellite clock frequency, while such drift changes cannot be seen in figure 8. Therefore, the switch of the C34 atomic clock cannot be inferred. In our research and references, we have not explored the causes of its formation, so we have purposely listed questions for discussion
4. Frequency stability analysis
Frequency stability is an important indicator to describe the characteristics of satellite atomic clocks, mainly expressing the random fluctuation of satellite atomic clocks and the fluctuation of noise [12]. To evaluate the frequency stability, the overlapping ADEV and overlapping HDEV are selected, as the frequency drifts of the BDS satellite clocks are different [38]. In principle, ADEV and HDEV are the square root of the overlapping Allan variance and overlapping Hadamard variance.
For a set of clock phase data  , the overlapping Allan variance
  is expressed as [39]
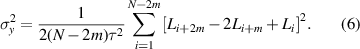
The overlapping Hadamard variance is expressed as
where m denotes the smoothing factor, which is usually determined by ![$1 \leqslant m \leqslant \operatorname{int} \left[ {(N - 1)/3} \right]$](https://content.cld.iop.org/journals/0957-0233/32/11/115021/revision2/mstac0b16ieqn20.gif) [40]. N is the number of phase data.
[40]. N is the number of phase data.  is the preprocessed phase data and
  is the sampling interval.
To obtain long-term stability sequences, the HDEV value of 10 000 s is calculated every day from 1 January 2019 to 3 July 2020. Moreover, the 10 000 s stability and daily stability of the BDS satellite clock are summarized. To analyze the influence of the frequency drift of the BDS satellite clock on the stability, the sequences of overlapping ADEV and overlapping HEDV values with integration time are shown during DOY 110–115, 2020.
4.1. Long-term stability sequences
Figures 13 and 14 show the 10 000 s stability sequences of the satellite atomic clocks based on overlapping Hadamard variance during the research period. It can be seen from figures 13 and 14 that the long-term sequences of 10 000 s stability of BDS satellites are relatively stable in the order of 1 × 10⁻¹³. The 10 000 s stability sequences of the BDS-2 and BDS-3 satellites are mainly distributed within 1.5 × 10⁻¹³ and 5 × 10⁻¹⁴. The BDS-2 satellite atomic clocks have a higher degree of dispersion in the 10 000 s stability sequences, and the most prominent one is the GEO C04 satellite. C04, which began service in November 2010, is currently one of the longest-serving satellites in orbit for the BDS. The aging of the C04 hardware will affect the stability of the atomic clock with the increase in operating time, resulting in C04 showing the worst stability.
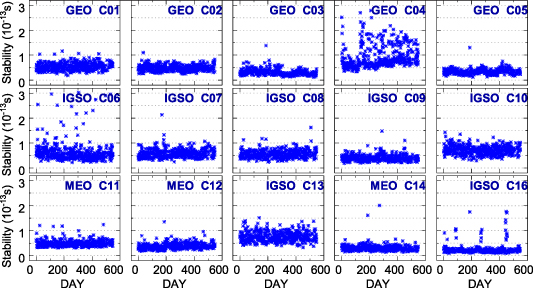
Figure 13. The 10 000 s stability sequences of BDS-2 satellite atomic clocks assessed by HDEV.
Download figure:
Standard image High-resolution image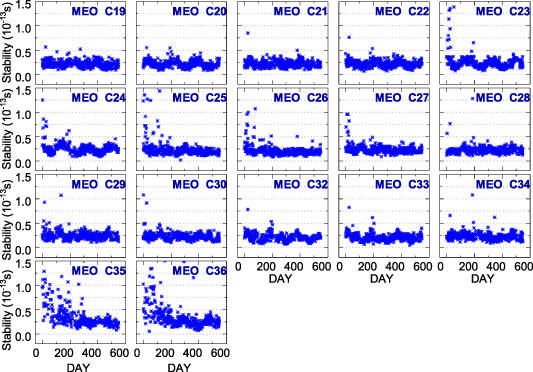
Figure 14. The 10 000 s stability sequences of BDS-3 satellite atomic clocks assessed by HDEV.
Download figure:
Standard image High-resolution imageAs shown in figure 14, the 10 000 s stability sequences of BDS-3 satellite atomic clocks are in a steady concentration state in the order of 1 × 10⁻¹⁴. However, the 10 000 s stability sequences of the atomic clocks of the C23, C24, C25, C26, C27, C29, C35 and C36 satellites have a large number of discrete points in the early stage. For C35 and C36, the main reason for the large number of discrete points in the early stage is that the atomic clocks in the orbit will soon be unable to work normally. The 10 000 s stability sequences of the two satellites tend to be stable once the switching between the working clock and the backup is done. For the satellite clock stability sequences of C23, C24, C25, C26, C27 and C29, the reason for the large number of discrete points in the early stage may be that the atomic clocks are in the service research stage, and the clock bias data could be affected by factors such as the adjustment of the ODTS solution strategy.
4.2. Short-term stability of different variances
Table 7 summarizes the 10 000 s and daily stability values of different types of BDS satellites based on overlapping ADEV and overlapping HDEV. For 10000 s stability, the mean overlapping ADEV and overlapping HDEV values for BDS-3 satellite clocks are 3.37 × 10⁻¹⁴ and 2.25 × 10⁻¹⁴, respectively, which is 54% and 67% better than the values of 7.40 × 10⁻¹⁴ and 6.92 × 10⁻¹⁴ observed for BDS-2. For daily stability, the mean overlapping ADEV values of BDS-2 and BDS-3 satellite clocks are 5.29 × 10⁻¹⁴ and 5.36 × 10⁻¹⁴, respectively. The mean overlapping HDEV value of BDS-3 is 0.70 × 10⁻¹⁴, which is 70% better than the 2.35 × 10⁻¹⁴ of BDS-2. Moreover, the BDS-3 PHM clock's overlapping ADEV and overlapping HDEV values are 2.29 × 10⁻¹⁴ and 2.25 × 10⁻¹⁴, respectively, at an averaging interval of 10 000 s, while that at an averaging interval of 86 400 s are 0.77 × 10⁻¹⁴ and 0.67 × 10⁻¹⁴, respectively. Obviously, the PHM clocks own the best stability among the BDS satellites.
Table 7. The values of 10 000 s and daily stability with overlapping ADEV and overlapping HDEV.
| Type | 10 000 s stability (E-14) | Daily stability (E-14) | ||||
|---|---|---|---|---|---|---|
| System | Orbit | Clock | Overlapping ADEV | Overlapping HDEV | Overlapping ADEV | Overlapping HDEV |
| BDS-2 | GEO | Rb | 6.08 | 5.64 | 5.63 | 0.83 |
| — | IGSO | Rb | 8.90 | 8.29 | 4.91 | 2.78 |
| — | MEO | Rb | 4.52 | 4.26 | 6.82 | 1.72 |
| — | Mean | 7.40 | 6.92 | 5.29 | 2.35 | |
| BDS-3 | MEO | Rb-II | 4.24 | 2.25 | 9.02 | 0.73 |
| — | MEO | PHM | 2.29 | 2.25 | 0.77 | 0.67 |
| — | Mean | 3.37 | 2.25 | 5.36 | 0.70 | |
| Improvement | — | — | 54% | 67% | −1% | 70% |
It is worth noting that the overlapping ADEV value of the Rb-II clocks is 9.02 × 10⁻¹⁴, which is higher than the 0.73 × 10⁻¹⁴ of HDEV, in terms of daily stability. To further explore this issue, the sequences of overlapping ADEV and overlapping HEDV values with the integration time are shown in figure 15, during DOY 110–115, 2020. It can be seen that the ADEV sequence of Rb-II has an obvious frequency drift after 20 000 s. However, HDEV does not show any frequency drift because the influence of frequency drift is removed in the calculation. Therefore, the overlapping ADEV value of Rb-II is higher than the overlapping HDEV one because of the influence of frequency drift, in terms of daily stability. In addition, it can be seen from figure 15 that the overlapping ADEV and overlapping HDEV sequences of the PHM clock have good consistency, and there is no obvious frequency drift.
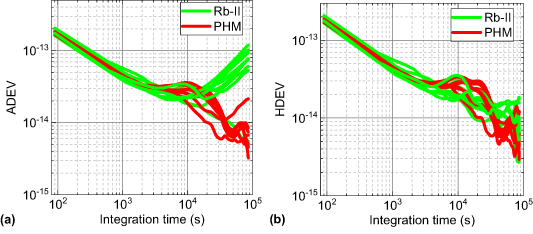
Figure 15. The overlapping ADEV (a) and overlapping HDEV (b) of BDS-3 satellite clocks.
Download figure:
Standard image High-resolution imageFrom figure 15 we find an interesting highlight: there are obvious 'bumps' on the BDS-3 satellite clocks at around 10 000 s. It can be seen from the literature [12, 23] that such a situation also exists in GPS, Galileo and BDS-2. This is because when solving the clock offset data, the orbit errors would be mapped to clocks due to correlations between the radial orbit component and the clock estimates. These orbit errors would be reflected. Therefore, the stability obtained here was severely affected by such periodicities, especially the stability index of 10 000 s. We will further characterize and quantify the periodic variations in BDS-2/BDS-3 satellite clocks in section 5.
5. Periodical characteristics
The study of the periodical characteristics of the satellite clocks can refine the polynomial model, improve the accuracy of clock prediction, and provide a reference for the improvement of the ODTS solution method [41]. The residuals obtained from the quadratic polynomial fitting have removed the trend. Thus, the significant periodic terms of the BDS satellite clocks extracted by FFT on the residuals are accurate. The spectrum analysis results are shown in figures 16 and 17. Table 8 extracts the first two main periodic terms.
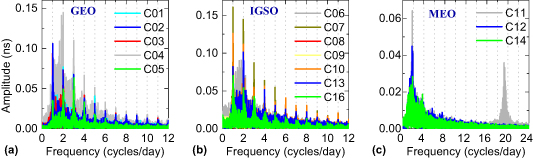
Figure 16. The spectrum analysis results of BDS-2 satellite clocks in (a) GEO, (b) IGSO and (c) MEO. The frequency corresponding to the phase peak represents a significant periodic term.
Download figure:
Standard image High-resolution image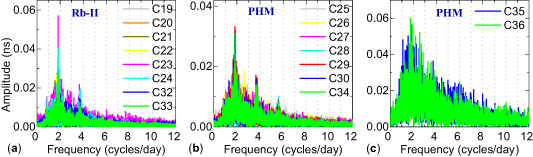
Figure 17. The spectrum analysis results of BDS-3 equipped with (a) Rb-II clocks and (b), (c) PHM clocks; (c) the spectrum analysis results of C35 and C36 with PHM clocks have a large amplitude. The frequency corresponding to the phase peak represents a significant periodic term.
Download figure:
Standard image High-resolution image
Table 8. Periodic terms extracted from BDS clock bias data.
| Type | PRN | Main period | Secondary period | Type | PRN | Main period | Secondary period |
|---|---|---|---|---|---|---|---|
| BDS-2 GEO Rb | C01 | 7.92 | 23.79 | BDS-3 MEO Rb-II | C19 | 12.29 | 17.70 |
| C02 | 24.08 | 12.00 | C20 | 13.07 | 6.46 | ||
| C03 | 24.02 | 12.01 | C21 | 12.92 | 15.01 | ||
| C04 | 13.65 | 12.64 | C22 | 12.98 | 17.35 | ||
| C05 | 7.99 | 12.02 | C23 | 12.88 | 15.29 | ||
| BDS-2 IGSO Rb | C24 | 12.95 | 6.33 | ||||
| C06 | 12.01 | 17.54 | C32 | 13.09 | 6.64 | ||
| C07 | 23.49 | 11.84 | C33 | 12.74 | 11.53 | ||
| C08 | 11.72 | 23.83 | BDS-3 MEO PHM | C25 | 13.05 | 10.85 | |
| C09 | 24.04 | 12.00 | C26 | 12.55 | 8.60 | ||
| C10 | 23.51 | 12.43 | C27 | 13.01 | 10.98 | ||
| C13 | 23.76 | 11.97 | C28 | 14.00 | 6.54 | ||
| C16 | 22.39 | 11.96 | C29 | 13.02 | 9.26 | ||
| BDS-2 MEO Rb | C30 | 13.11 | 11.20 | ||||
| C11 | 12.68 | 1.25 | C34 | 12.96 | 6.36 | ||
| C12 | 13.00 | 16.68 | C35 | 14.81 | 20.97 | ||
| C14 | 13.25 | 17.16 | C36 | 13.59 | 9.59 |
As can be seen from figure 16, the BDS-2 GEO and IGSO satellite atomic clocks have multiple significant periodic terms while BDS-2 MEO satellite atomic clocks only have one or two. The satellite atomic clocks on GEO have a periodic term every hour in one day, among which the most prominent are 24 h with the frequency of one cycle per day (see figure 16(a)). The BDS-2 clocks on IGSO (see figure 16(b)) have the same periodic characteristics as the GEO, while the frequency values of one cycle per day and two cycles per day represent a significant periodic term of 24 h and 12 h, respectively. It can be observed from figure 16(c) that the atomic clock of C11 (BDS-2 MEO satellite) has a frequency value of 19 cycles per day corresponding to the phase peak, implying that the second significant periodic term is 1.25 h.
Figure 17 shows the spectrum analysis results of BDS-3. All BDS-3 satellites investigated in this article are on MEO with different atomic clocks. For the Rb-II clocks in figure 17(a), two significant terms can be found. The first one is 12 h, corresponding to the frequency of two cycles per day, and the second one is 6 h, corresponding to the frequency of four cycles per day. It can be seen from figure 17(b) that the PHM clock has three significant periodic terms of 12 h, 6 h and 4 h, corresponding to frequencies of 2, 4 and 6 cycles per day, respectively.
It can be seen from the first two main periodic terms extracted in table 8 that the BDS GEO and IGSO satellite periods are mainly 24 h, 12 h and 8 h, which have a significant correlation with the GEO/IGSO satellite orbit period of 23 h 56 min. The MEO satellite periodic terms are mainly distributed around 12 h and 8 h, and are related to the MEO orbit period of 12 h 53 min. In particular, C11 has a significant periodic term of 1.25 h. Figure 17 and table 8 show that there are only 1–3 significant periodic terms of about 12.5 h, 6 h and 8 h for the BDS-3 MEO orbit satellite atomic clocks.
The main significant periodic terms of the satellite clock offset data for the three orbit types are approximately 1, 1/2 or 1/3 times the period of the satellite orbits. The periodic characteristics of the satellite clock related to the orbital period are due to the ODTS method used in the WHU precision clock offset calculation. Thus, the clock bias data are related to the satellite orbit; in particular, the radial error of the orbit will be absorbed by the satellite clock bias.
6. Conclusion
With the advancement of BDS construction, satellite atomic clocks are gradually developing as the core component of the satellite. Comprehensive performance evaluation of the BDS satellite atomic clock performance is extremely important for the PNT service system. Therefore, through a total of 550 days of BDS precision clock bias data from 1 January 2019 to 3 July 2020, this paper analyzes the physical characteristics, including phase, frequency, frequency drift and noise, and frequency stability, of BDS satellite atomic clocks and the periodicity of clock offset data. From the perspective of physical characteristics, the switching of the BDS satellite atomic clock during the research period is analyzed, and the frequency stability of the atomic clock is comprehensively verified. Thus, a comprehensive evaluation and analysis of the BDS satellite atomic clock are realized, based on the perspective of clock offset data and the physical characteristics of the atomic clock. The following conclusions can be drawn from the results obtained in this paper.
In general, BDS-3 satellite clocks perform better than BDS-2 ones, and the PHM clocks installed on BDS-3 satellites perform best. The BDS-3 satellite clocks have a lower number of phase and frequency jumps than BDS-2, with better continuity. With regard to the frequency drift, the mean RMS value of BDS-3 satellite clocks is 0.73 × 10⁻¹⁸, which is an increase of 41% compared to the 1.24 × 10⁻¹⁸ observed in BDS-2. The mean RMS value of the frequency drift of PHM clocks is 3.15 × 10⁻¹⁹, with an increase of 73% compared to the 1.15 × 10⁻¹⁸ of Rb-II. The mean RMS values of the frequency drift of BDS-2 satellite clocks in GEO, IGSO and MEO are 1.64 × 10⁻¹⁸, 1.26 × 10⁻¹⁸ and 0.72 × 10⁻¹⁸, respectively. Furthermore, the noise of BDS-3 is 0.216 ns, which is 55% better than the 0.484 ns of BDS-2. The noise of BDS-2 satellite clocks in GEO, IGSO and MEO is 0.515 ns, 0.546 ns and 0.280 ns, respectively. The noise of Rb-II and PHM clocks is 0.221 ns and 0.211 ns, respectively, which is better than that of BDS-2 Rb clocks. Moreover, four satellites, namely C01, C03, C35 and C36, have switched the atomic clock during the research period, according to the inference of physical characteristics.
The frequency stability of BDS-2 satellite clocks is worse than that of BDS-3. For frequency stability at 10 000 s, the overlapping ADEV and overlapping HDEV of BDS-3 satellite clocks are enhanced by 54% and 67%, respectively, compared with BDS-2. The mean daily stability of BDS-2 and BDS-3 satellite clocks by overlapping ADEV is 5.29 × 10⁻¹⁴ and 5.36 × 10⁻¹⁴, respectively, while that by HDEV is 2.35 × 10⁻¹⁴ and 0.70 × 10⁻¹⁴. Furthermore, the mean stability of PHM clocks at 10 000 s with overlapping ADEV and overlapping HDEV is 2.29 × 10⁻¹⁴ and 2.25 × 10⁻¹⁴, respectively, while the daily stability with overlapping ADEV and overlapping HDEV is 0.77 × 10⁻¹⁴ and 0.67 × 10⁻¹⁴, respectively. Moreover, PHM clocks do not have the frequency drift that is evident in Rb-II. The BDS-3 satellite clock stability sequences have an obvious bump at around 10 000 s, and such a situation also exists in GPS, Galileo and BDS-2.
The analysis of periodicity of BDS satellite clocks shows a correlation between the significant periodic term and the orbital period, although the periodicity of each satellite is different. The significant periodic terms of BDS GEO and IGSO satellite clocks are mainly distributed around 24 h, 12 h and 8 h, while the significant periodic terms of BDS MEO are mainly distributed around 12 h and 8 h. The significant periodic terms of clock bias data are approximately 1, 1/2 or 1/3 times the orbital period. The analysis of the correlation between the clock period and the orbit period refines the clock model and improves prediction accuracy.
Currently, research related to BDS-3 is underway, and thus, we expect that BDS-3 will afford large contributions to GNSS PNT services in the future.
Acknowledgments
This work was supported by the Natural Science Foundation of China (Grant No. 41704008), the introduction of talent research start-up fund of Anhui University of Science and Technology (Grant No. 13200385), the Open Research Fund of Coal Industry Engineering Research Center of Collaborative Monitoring of Mining Area's Environment and Disasters (Grant No. KSXTJC202006), and the Innovation Fund of Anhui University of Science and Technology (Grant No. 2019CX2080). The authors acknowledge Wuhan University for providing BDS-3 precise clock products.
Data availability statement
The data generated and/or analyzed during the current study are not publicly available for legal/ethical reasons but are available from the corresponding author on reasonable request.