

Abstract
Although photovoltaic (PV) devices are rated at standard testing conditions (STCs), these STCs are rarely met, either outdoors, or when PV devices are used for indoor applications. Thus, it is beneficial to fully characterise the linearity of PV devices with respect to irradiance. Moreover, high accuracy linearity measurements are essential for reference cells (RCs), as they ensure the precision of the measured irradiance. This work presents a new technique for linearity measurements of PV devices based on digital light processing (DLP). The proposed system uses a digital micromirror device coupled with projection optics and a high-power LED array. By creating a series of patterns projected on the device under test with a specific number of bright and dark pixels, linearity measurements can be implemented through a spatial dithering process. Since the dithering process is mechanical, it is expected that any spectral variability effects for the different dithering levels or electrical non-linearities of the light source are avoided. The developed system can provide thousands of measurement points on the linearity curve of a device in seconds, which is impossible with any other currently established methods. Measurements of RCs with known linearity curves are acquired and are validated by conventional methods. Results demonstrate that the DLP method provides equal measurement accuracy compared to conventional systems, but at significantly higher resolution (points on the linearity curve) and order of magnitude higher measurement speed.
Export citation and abstract BibTeX RIS

Original content from this work may be used under the terms of the Creative Commons Attribution 4.0 license. Any further distribution of this work must maintain attribution to the author(s) and the title of the work, journal citation and DOI.
1. Introduction
Solar photovoltaic (PV) generation is expected to be at the centre of all renewable energy generation of the future, having already achieved the lowest prices electricity has ever seen in several countries [1]. Growing deployment will lead to growing needs for better and more accurate standards for PV product testing and higher accuracy measurements of environmental parameters that affect PV devices such as irradiance. New requirements have already been introduced for energy rating of PV devices, in order to increase the accuracy of determining the expected energy output of PV products [2, 3]. Linearity of PV devices is one of the parameters that affect both the energy rating of some PV products, but also measurements of irradiance, either outdoors or during indoor testing, through the calibration of reference cells (RCs) and linearity requirements.
Linearity of an optoelectronic device such as a PV device is the proportionality of the short-circuit current (ISC) of the device versus the incident irradiance, for a given spectral profile. According to the latest (2020) edition of the IEC 60904-10 standard, the definition of linearity is 'the linear dependence that describes the pure proportionality of the short-circuit current of the PV device to the irradiance that illuminates it' [4]. Linearity is a significant performance feature of such devices, both from the aspect of accurate power rating of PV products at different irradiance levels, but also for accurate irradiance measurements using RCs and photodiodes. Power rating of PV devices is currently realised at standard testing conditions (STCs)—1000 W m−2 irradiance, 25 °C temperature and AM1.5 spectrum [5, 6]. In reality, these conditions are almost never met in real PV device applications, either for outdoor systems [7] or for indoor PV applications [8]. For the majority of commercial products, irradiance non-linearities of PV modules result in a very low error in energy rating calculations compared to other sources [2], however, for indoor PV products, significant differences with performance at STC can be observed.
Measuring the irradiance levels using the ISC of an RC relies on the proportionality principle, hence any non-linear behaviour would cause errors in the measurements. IEC 60904-10:2020 states that for a linear device, the maximum percentage deviation from linearity in the dependence of ISC versus irradiance shall be within ±0.5% [4]. This requirement means that precise linearity measurement techniques are likely to become even more important in the future. Apart from PV devices, linearity is also an important aspect of photodiodes. Some common established methods for measuring linearity of PV devices include the differential spectral responsivity (DSR) method [9], the solar simulator method [10], or the two-lamp method [11]. Established techniques offer high accuracy for linearity measurements for common applications and have been shown to be consistent with each other [12]. New methods have also been proposed in recent years, such as the beam-splitter combinational flux method [13], the N-lamp method [14] and the LEDs combinational flux technique [15]. Most of the above methods have specific limitations or disadvantages. Measurements in a lot of cases are time-intensive and they offer a limited number of points on the linearity curve of the device. This can increase measurement cost and can also present challenges when measuring linearity at low light levels.
In this work, a high speed, high resolution linearity measurement method for PV devices and photodiodes based on a digital light processing (DLP) projection system is presented. DLP projection systems have already been demostrated for PV cell spatial characterisation [16–18] and PV module testing [19, 20]. The proposed method uses a digital micromirror device (DMD) [21], integrated in a custom projection system to apply high resolution mechanical shading for linearity measurements. Essentially, the linearity characterisation of a sample is achieved by a spatial dithering process. The switching speed of the DMD which is shorter than 100 μs allows high speed pattern generation, which applies the shading levels. The application of mechanical shading ensures electrical and spectral linearity of the system, for a given light source, while an arbitrarily large number of shading levels can be achieved, which provides the high resolution on the linearity curve of a device.
The measurement acquisition procedure and analysis is presented for the proposed system. Measurement results for two calibrated RCs are presented, with parallel measurements acquired with a DSR method, in order to validate measurement results. The results demonstrate that the DLP method provides equal measurement accuracy compared to conventional systems, achieving a significantly higher number of points on the linearity curve and order of magnitude higher measurement speed, since thousands of points on the curve can be acquired in seconds.
2. Method
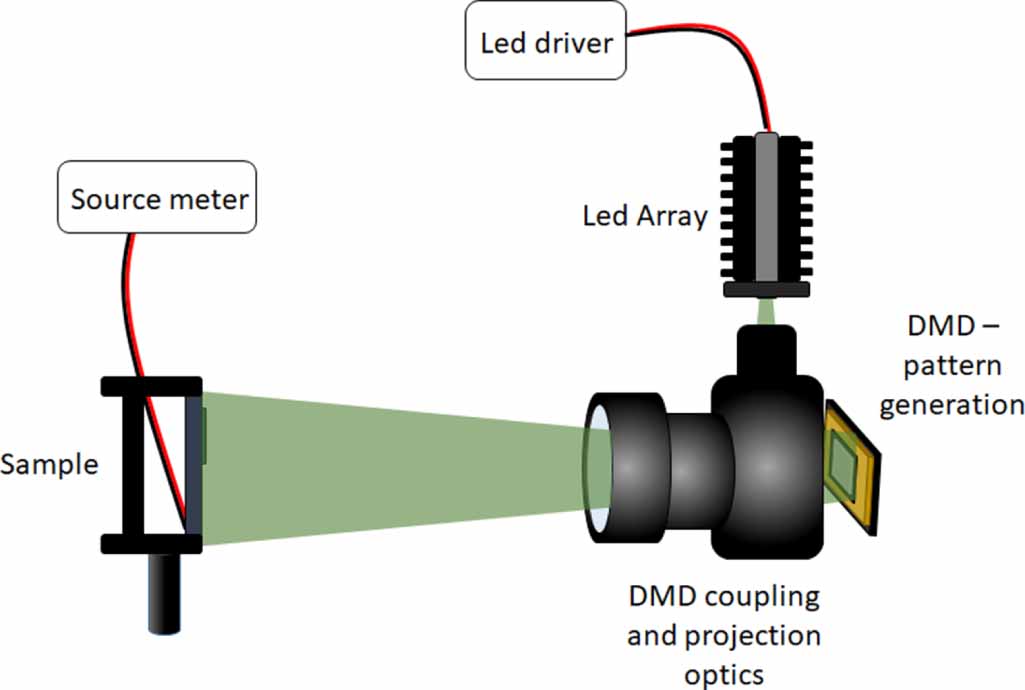
A schematic of the prototype measurement system is presented in figure 1. The system consists of a high power 200 W LED array provided by Signify™ [22]. The output spectrum of the light source is presented in figure 2 and demonstrates a relatively broad emission spectrum with a peak at 540 nm. The LED light source is driven by an iDrive® Force-12 LED driver and is coupled with a V-7000 DMD module through a compatible projection module (Vialux STAR CORE). Pictures of the prototype system are presented in figure 3.
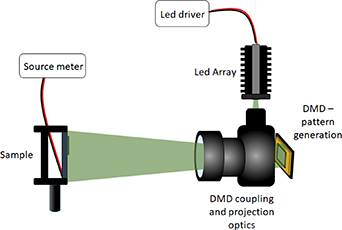
Figure 1. Schematic of the custom DLP projection system developed in this work for linearity measurements (not drawn to scale).
Download figure:
Standard image High-resolution image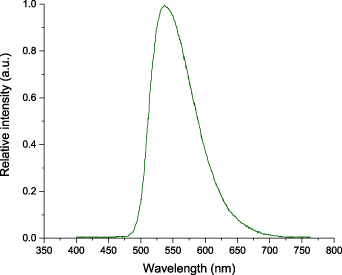
Figure 2. The emission spectrum of the LED array light source which is coupled with the DLP system.
Download figure:
Standard image High-resolution image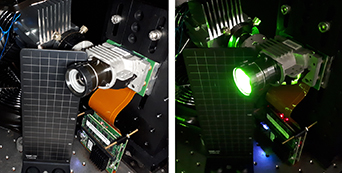
Figure 3. Pictures of the custom DLP projection system developed in this work for linearity measurements, with the LED source off on the left and while projecting a pattern on the right.
Download figure:
Standard image High-resolution imageThe accurate setting of specific shading levels is achieved by creating a projection with a specific percentage of dark pixels at random positions of the projection. This is the selected percent of illumination, the dark pixels correspond to the pixels of the DMD at the 'off' state. Thus, shading is achieved by spatial dithering. Considering that the DMD used in this system consists of 1024 × 768 micromirrors, the theoretical limit of the number of different illumination levels (hence, points on the linearity curve) the system can achieve is 786 432. For the measurements of this work, ten different shading patterns are used for each specific illumination level and the mean value of the ISC measured for each pattern is recorded for the selected illumination level. This ensures that the effects of any spatial features of the device or inhomogeneitites of the light source will be averaged The standard deviation of this mean value can be considered as measurement uncertainty related to the non-uniformity effects . In this work the measurements for 1000 illumination levels/points on the linearity curve are acquired in order to determine linearity.
The DLP system is developed in a dark enclosure. No temperature control for the sample was used during the measurements in this work. After an initial warm-up period during which the operating temperature of the LED array stabilises (approximately 30 min), both short term (<500 s monitoring period) and long term (>3600 s monitoring period) stability is better than 0.05%. This has also been confirmed for different levels of irradiance, which is expected since the projection system components (projection optics, micromiror array) are not expected to insert any temporal instabilities. ISC measurements are acquired with a National Instruments PXIe-4139 source measure unit.
In order to calculate the linearity of a PV device at each point, the proportionality approach is used, as presented in [12] and [4]. The normalised responsivity  is defined as:
where G is the selected irradiance level, Gref and ISC,ref are the irradiance and measured short circuit current respectively at the reference point selected, which is in this case equivalent to 1000 W m−2. Based on the above, the deviation from linearity (ΔL) for the short-circuit at a specific point can be calculated by:

In the system presented in this work the irradiance that the LED array provides to the DLP system is stable, with the DLP system then mechanicaly setting the irradiance levels based on the percentage of bright and dark pixels. In this work we will express the shading as a percent, with 100% illumination indicating all pixels of the projection are bright and 0% illumination indicating all pixels are dark. This means that we can define:
where P is the normalisation factor that we are using in this work, D is the proportion of pixels at the 'on' state (spatial dithering) and Dref is the dithering level (proportion of pixels at the 'on' state) that induces Gref levels of irradiance on the sample. This definition can be considered to be valid since all pixels are of nominally identical size and a sufficient high number of pixels contribute to each irradiance level. The maximum irradiance level that the DLP system can provide is higher than the reference irradiance Gref. In this case, the reference irradiance point is not at 100% illumination, thus, P can have values higher than 1. Equation (1) will now be:
For accurate measurements, the contribution of background light has to be considered in the above equations. Sources of the background illumination for this system are light leaking through the projection optics, light leaking from the coupling point between the LED array and the projection optics, any light leaking through the enclosed chamber and the dark current of the device. The three latter sources have been found to be negligible (two orders of magnitute lower) compared to the light leaking through the projection optics, which is the major source of background irradiance in this system. Assuming that the chamber of the system is perfectly enclosed, any background light will depend on the selected light levels of the LED array. The major reason for the light leaking through the projection lens is the insufficient light rejection of the pixels at the 'off' state: although the pixels at the 'off' state divert the light towards a beam dump inside the projection optics, this process is not perfect and some light still escapes towards the sample from the 'off' pixels, contributing to the background. When the micromirrors of the DMD are at the 'on' state (bright pixels) they do not contribute to the background levels. While some reflections between the multiple interfaces of the projection optics will exist, these reflections will not add any additional light to the background. Due to these multiple reflections a small amount of light from the 'on' pixels might be diverted towards a non-illuminated area of the sample. This light however is expected to reach the sample anyway, as it originates from the 'on' pixels and thus is not considered background light. Considering the above, the background light value is at its 100% level when all pixels of the projection are dark and at 0% when all the pixels of the projection are bright. The current contribution IB of the background irradiance at a selected irradiance level G can then be defined as:

where Izero is the current contribition of the background at zero illumination, measured for a sample from the 0% illumination measurement. It has to be noted here that equation (5) assumes that the effect of the background variation, moving towards higher illumination levels, has a linear effect on the sample. This assumption will induce higher uncertainties for very non-linear samples at low irradiance levels.
The normalised responsivity with the additional contribution of the backround that is used in this work is calculated by:
Using (6) along with (2), the non-linearities of samples can be measured using the DLP linearity characterisation system of this work. Of course, the short circuit current of the reference condition  must be known in advance.
Two different silicon RCs with known ISC,ref (STC) and linearity curves measured with the DSR method at Physikalisch-Technische Bundesanstalt (PTB) are used in order to evaluate the performance and accuracy of the DLP system. One of the samples is known to be rather linear, the other demontrates non-linearites for irradiance levels lower than 200 W m−2. The spatial dithering process can be applied either sequentially (projecting patterns from 0% to 100% illumination as a sequence) or randomly (the projection order of the illumination levels is randomised). A random order is used in this work, although no differences have been observed between the two options for the samples of this work. The response of these silicon RCs is expected to be comparable to the maximum switching rate of the DMD (<100 μs). Some thin film PV devices can have an even faster response, while organic based PV cells will have a slower response, limiting the speed that measurements can be implemented.
An advantage of the DLP system is that non-linearity of samples can be investigated with high resolution at different irradiance level ranges. When a specific optical power level is set for the LEDs, there is a specific background level for this set of measurements and measurement uncertainties increase towards lower light levels. By setting a lower optical power value for the LEDs, a lower irradiance range can be investigated using the DLP system, increasing the accuracy for low light levels due to the reduction of the background irradiance. Three different optical power levels are used in this work to demonstrate this. The same reference point is used in all cases, as it is explained in the next section.
For an initial uncertainty estimation, the ISC measurement uncertainty and the random spatial non-uniformity uncertainty were considered. Other siginificant sources of uncertainty such as device temperature have not yet been quantified, while light source instability has been consistently measured to be lower than 0.05% during measurements. For each illumination level, measurements with ten different shading patterns are acquired and the standard deviation is recorded. Measurement errors will be induced by the random spatial non-uniformity of the shading patterns, which will be more prominent for low illumination levels. This uncertainty is combined with the measurement uncertainty due to system intrumentation, to provide the initial uncertainty estimation of the calculated non-lineariy for each illumination level. These sources of uncertainty are assumed to be uncorrelated with each other. The error in irradiance due to the different position of pixels for each pattern depends on the random choice of pixels, while the instrumentation error depends on the calibration of the instrument and the electrical noise.
In figure 4, pictures of one of the RCs are presented, illuminated with two different patterns at different illumination levels, using the DLP linearity system. It should be noted that the active area of the solar cell is widely overfilled. This is of special importance for non-linearity measurements since impurities causing non-linearity effects are more frequently found at the edges of a solar cell.

Figure 4. Pictures of a projection pattern on the RC, with 30% illumination level on the left and 50% illumination level on the right.
Download figure:
Standard image High-resolution image3. Experimental results
Linearity measurement were implemented using the two RC samples. Three different optical power levels set by the LED array are used for each sample. For each power level, ISC measurements for 1000 irradiance levels are acquired by spatial dithering using the DLP projection system. With the sampling rate selected in this work, the time required to acquire the 1000 points on the linearity curve of a sample is approximately 200 s. This includes ten patterns for each illumination level and a small wait time before acquiring the measurement for each pattern. Although measurements could be implemented at a higher sampling rate, closer to the limit of the sample's response, the selected sampling rate was the best compromise between speed and accuracy of measurements. Increasing the samples acquired for each illumination level or further increasing the integration time for the measurement instrument only results in marginal accuracy gains for the measurements, for the system of this work.
The optical power at maximum irradiance on the sample (all pixels on—no shading) is approximately 1150 W m−2, with the spectrum profile presented in figure 2. The reference point selected for non-linearity calculations is the known ISC equivalent at 1000 W m−2 for the samples. For the linear sample, the current at 1000 W m−2 (STC) is Iref,1 = 149.7 mA, while for the non-linear sample it is Iref,2 = 122.1 mA and these are the reference values used for calculations. Although ISC,ref is the value measured at STC (with an AM1.5 spectrum), this is also the reference value selected here for consistency, although the spectral profile of the light source of the DLP system is very different than the AM1.5. All irradiance levels for all three power levels were normalised according to this reference point, determining an equivalent P value as in equation (3). The Dref value for lower irradiance levels is higher than 100% illumination and in order to define the normalisation factor Pl for lower irradiance levels, the ISC at 100% illumination at the lower irradiance level and the ISC,ref have to be taken into account:
where  is the maximum measured current for the lower irradiance level and Dmax apparently equals to 1 (100% of pixels at the 'on' state). It is clear from equation (7) that for the initial irradiance levels that are normalised based on the initial reference point that
  and
and  , which leads to equation (3). Equation (7) is used to normalise lower irradiance linearity curves based on ISC,ref so that all curves can be drawn in the same graph and are normalised based on the same reference point.
The measurement results for the two samples are presented in figures 5 and 6. In the same graphs, results using the DSR method measured at PTB, Braunschwieg, are presented for the same samples, with their stated uncertainty also included in the curves. The uncertainty estimations for the DLP linearity measurements are included for all measurement points.
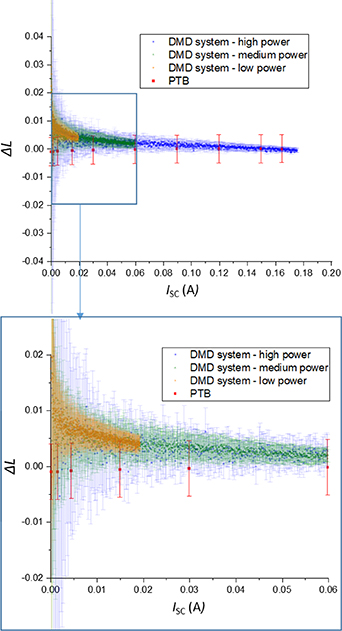
Figure 5. Non-linearity (ΔL) measurement results using the DLP projection system, for a linear RC (full range on top, zoomed in low light range at bottom graph). Three different power levels have been used (blue, green and orange dots). Measurement results from a DSR system are also included for comparison (red dots). Uncertainty estimations are included in the graphs for all points, error bars denote the estimated standard uncertainty.
Download figure:
Standard image High-resolution image
Figure 6. Non-linearity (ΔL) measurement results using the DLP projection system, for a non-linear RC (full range on top, zoomed in low light range at bottom graph). Three different power levels have been used (blue, green and orange dots). Measurement results from a DSR system are also included for comparison (red dots). Uncertainty estimations are included in the graphs for all points, error bars denote the estimated standard uncertainty.
Download figure:
Standard image High-resolution image
For both samples there is good overall agreement between the two methods with some small differences for the linear RC for low light levels (irradiance levels below 100 W m−2), marginally within the uncertainty budget. As expected, the calculated uncertainties increase towards lower light conditions, for a given optical power level of the light source. This is because a specific power level will induce a specific background illumination, which will proportionally affect measurements depending on their magnitude. For lower LED power levels, overall this uncertainty will decrease since the background itself will be lower. Nevertheless, the increasing trend of uncertainties towards lower illumination levels of a given power level remains, due to the increasing background when more pixels are at the 'off' state. This effect can be observed in both figures 5 and 6, where for different power levels of the LED light source, different uncertainty values are calculated (blue, green and orange data points).
The differences at low light levels that can be observed for the linear sample in figure 5 can potentially be due to the very different spectral profile of the light sources between the DLP and the DSR system. A broader light source for the DLP system could potentially provide even better agreement, since wavelength dependent non-linearities of samples can be expected [23]. Nevertheless, according to both systems the sample is linear based on the IEC 60904–10:2020 down to 0.01 A. Below this value there is a difference of up to 0.01 in ΔL between the two methods, which results in the DLP system showing a potential non-linearity for lower irradiances, although the uncertainties are increased for such low irradiance levels.
The linearity measurement results for the non-linear device are in even better agreement between the two systems, with the device demonstrating non-linear behaviour below 300 W m−2. This non-linearity is captured by the DLP system even at high power levels (blue data points), although the uncertainty for the low light range is increased. In the zoomed-in range of figure 6, the good agreement within the uncertainty budgets of both methods for low light levels can be observed.
Since projection optics are used in this measurement system to project the patterns on the samples, a level of vignetting is expected to occur for the projection, even though the projection optics are specifically designed for the specific DMD model. This will insert a certain level of non-uniformity for the projection area, where irradiance will be slightly higher at the centre of the projection and lower at the edges. For the sample area in our case this non-uniformity due to vignetting is at a level of 10%. Nevertheless, in the IEC 60904-10 no restrictions are given for spatial non-uniformity for linearity measurements of PV cells, as long as any spatial uniformity is stable during measurements within 0.5%, which stands in the case of this work [4].
Since random patterns are used to create different irradiance levels, non-uniformity could affect measurements at very low irradiance levels. However, even at 0.01% illumination, more than 700 pixels are at the 'on' state. Averaging the measurement result over ten patterns, will reduce the error due to non-uniformity of projection (this is not the non-uniformity due to the random pattern), with any significant variations reflected in the uncertainties at such levels. Considering the above, it is assumed that equation (3) still stands and any minor effect of non-uniformity is reflected in the uncertainty values. The above explain the higher dispersion of measurements and uncertainties at very low illumination levels for a specific power level, which are also enhanced by the higher background levels at low illumination levels. Different sampling levels were tested (from 5 up to 100 samples per pattern) and it was observed that although dispersion can slightly decrease, uncertainties converge to levels similar to the ones presented in figures 5 and 6, for this specific system implementation.
There are specific aspects of the DLP projection system that can offer additional advantages towards increasing the accuracy and speed of linearity measurements. Since the shading is mechanically implemented, electrical non-linearities introduced by the light sources can be avoided. In this work 1000 points on the linearity curve were used, nevertheless, fewer points can be used to speed up measurements even further. This can be more practical when samples with a slower response are measured, where the measurement speed will be limited by the temporal ISC response of the samples. The fact that the DLP system is projection based is very practical for adjusting the projection size and focus based on the size of the sample. Small area photodiodes up to wafer based silicon solar cells can be measured using this system. Finally, being able to implement linearity measurements using different power levels of the light source can be useful for high resolution measurements at low light intensities. Such a capability can be beneficial for high accuracy linearity characterisation of photodiodes and indoor PV devices.
Further development of this prototype DLP linerarity system can improve some drawbacks of the present prototype system. The background light due to the light leaking through the projection optics is currently at 0.03% of the maximum irradiance level, for a given power level, when all pixels are at the 'off' state. This background and the projection optics quality are the factors that currently contribute to the higher uncertainties for low illumination conditions of a given power level. These uncertainties can be significantly reduced with higher quality projection optics that allow much less light to leak through the DLP system and provide even lower levels of non-uniformity of projection. Another current limitation is that the spectral profile of the current prototype system is limited to a short range. Nevertheless, it is straightforward to integrate additional options for light sources to this system, by either using a broadband light source or by adding further monochromatic sources depending on the testing requirements. Temperature effects have not been considered in this work and it was assumed that they would have a negligible effect on the ISC for these specific PV devices, since the spectral temperature coefficient of crystalline silicon devices is almost zero in the wavlength regime of the given light source (450–750 nm). However, temperature effects will be important for other types of samples and more broadband light sources and the addition of temperature control will minimise any additional uncertainty in these cases.
Spatial dithering in this work provides inhomogeneous illumination patterns. This means that the non-linearity for a given percentage of spatial dithering may not necessarily be the same as projecting a uniform low-light level across the whole device. In the cases studied here this effect seems insignificant, but for other types of devices it may be important. Nevertheless, mixing the outputs of the pixels to produce a uniform irradiance is relatively simple to achieve (out of focus measurements or addition of diffuser) so this is not a fundamental limitation, but can actually be a useful function to understand the source of non-linearity in a device.
4. Conclusions
A new technique for non-linearity characterisation of PV devices and photodiodes has been introduced in this work. The new method is based on DLP projection principles and a custom DLP prototype measurement system has been developed at National Physical Laboratory to demonstrate this method. Measurements are acquired using a mechanical spatial dithering process. A series of patterns is projected on the device under test with a predefined number of bright and dark pixels, depending on the selected illumination level. The mechanical nature of the dithering process ensures that any spectral variability effects for the different illumination levels or electrical non-linearities of the light source are eliminated.
Experimental results for two different samples with known linearity curves have been acquired and compared with linearity measurements for the same samples with another established technique (DSR). The results demonstrate that the DLP linearity characterisation method achieves good agreement with the DSR technique in both cases of linear and non-linear samples. Measurements can be acquired in seconds, even when acquiring 1000 datapoints on the linearity curve, which is impossible for other established methods. The high resolution and high measurement speed of the developed system will significantly reduce costs of linearity measurements.
Future improvements on some of the components of the system such as the projection optics can reduce the uncertainties of this prototype system even further. Additional light sources will allow a broader spectral range of linearity measurements. This can potentially lead to making the DLP projection technique the most accurate and fast technique for linearity characterisation of optoelectronic devices such as solar cells and photodiodes.
Acknowledgments
This research was funded by the Department for Business, Energy and Industrial Strategy (BEIS) through the National Measurement System and by the European Metrology Programme for Innovation and Research (EMPIR) 16ENG02 PV-Enerate, co-financed by the participating states and from the European Union's Horizon 2020 research and innovation programme.