
Abstract
We perform molecular dynamics simulations to study the structure and dynamics of the ionic liquid [Omim][TFSI] in a broad temperature range. A particular focus is the progressing nanoscale segregation into polar and nonpolar regions upon cooling. As this analysis requires simulations of large systems for long times, we use the iterative Boltzmann inversion method to develop a new coarse-grained (CG) model from a successful all-atom (AA) model. We show that the properties are similar for both levels of description at room temperature, while the CG model shows stronger nanoscale segregation and faster diffusion dynamics than its AA counterpart at low temperatures. Exploiting these features of the CG model, we find that the characteristic length scale of the structural inhomogeneity nearly doubles to ∼3 nm when the temperature is decreased to about 200 K. Moreover, we observe that the nanoscale segregation is characterized by a bicontinuous morphology. In worm-like nonpolar regions, the ends of the octyl rests of the cations preferentially aggregate in the centers, while the other parts of the alkyl chains tend to be aligned parallel on a next-neighbor level and point outward, allowing for an integration of the imidazolium head groups of the cations into polar regions together with the anions, resembling to some degree the molecular arrangement in cylindrical micelles.
Export citation and abstract BibTeX RIS

Original content from this work may be used under the terms of the Creative Commons Attribution 4.0 licence. Any further distribution of this work must maintain attribution to the author(s) and the title of the work, journal citation and DOI.
1. Introduction
Ionic liquids (ILs) are very interesting materials from the viewpoints of both fundamental and applied science. They are salts with a low melting point, which show complex structural and dynamical properties [1, 2]. Moreover, they are nonflammable and nonvolatile and show high thermal stability and ionic conductivity. These and other advantageous features open up a wide range of applications, e.g., as solvents, electrolytes, or catalysts [3–5]. As a major advantage, the properties of ILs can be tuned to a desired application by a systematic variation of the cation and anion species.
Many ILs consist of inorganic anions and organic cations, which often comprise a polar head group and nonpolar tail. Due to the amphiphilic nature of the cations, ILs tend to show nanoscale segregation. This nanoheterogeneous structure was ascertained in x-ray [6–8] and neutron [9, 10] scattering studies based on a prepeak in the static structure factor S(q) at room temperature. Because its position and height depend systematically on the size of the cation, this prepeak was often taken as evidence for the emergence of cation clusters [6, 7, 9], but also other interpretations were put forward [8].
This structural inhomogeneity of ILs comes along with complex and heterogeneous dynamics, in particular, at reduced temperatures [11–14]. Upon cooling, a shift of the prepeak to lower q values indicates that the characteristic length scale of the nanoscale segregation grows [7], and a breakdown of the Stokes–Einstein–Debye relation reveals an onset of nontrivial molecular dynamics (MD) [15]. However, it remains a widely unsolved problem to this day to link the structural and dynamical properties of ILs, particularly, to understand the role of the inhomogeneous structures for their glassy dynamics. Such knowledge is highly desirable because the charge transport in ILs, which is of prime importance for many applications, is strongly linked to the glassy dynamics [16], e.g., it was found to depend not only on the glass transition temperature Tg but also on the fragility [17], which characterizes the degree of the deviations from the Arrhenius law in many glass-forming liquids, including ILs.
In recent years, MD simulations have developed into a powerful tool for detailed studies on the structure and dynamics of ILs [18–23]. All-atom (AA) models not only revealed structural [20] and dynamical [18, 24–26] heterogeneity, but also yielded insights into their interplay [27, 28]. However, such detailed atomistic modeling has also shortcomings. In particular, the high chemical accuracy comes along with big computational efforts and, hence, interferes with the calculation of long trajectories for large systems, as required for studies of nanoheterogeneous structures and dynamics, in particular, at reduced temperatures. To overcome this computational obstacle, it is desirable to develop coarse-grained (CG) variants from successful AA models. Various concepts were employed for this purpose, including effective force matching [29, 30], iterative Boltzmann inversion (IBI) [31], iterative Newton inversion [32], relative entropy [33], conditional reversible work [34], and machine learning [35]. However, none of these methods yielded CG force fields, which satisfactorily reproduce the thermodynamic, structural, and dynamical properties at the same time. In addition, the transferability in temperature is often an issue. Nonetheless, enabling longer time and length scales, CG models allow one to predict features that would need excessive sampling with AA models.
CG approaches proved particularly useful to characterize the nanoscale segregation of ILs comprising imidazolium-based cations with sufficiently long alkyl tails. The associated characteristic prepeak in the static structure factor was clearly resolved [31, 32, 36]. It was found that nonpolar domains comprising the aliphatic tails of the cations are separated from polar domains, which consist of the imidazolium rings of the cations and the anions [19, 36–38]. Specifically, it was proposed that there is a bicontinuous morphology with interdigitated alkyl groups sandwiched between winding sheets of the charged entities [36]. Somewhat differently, it was conjectured the alkyl tails form separated domains, which are embedded in a network of the polar groups [19, 37, 38]. In any case, it was found that the typical domain sizes are larger for longer alkyl tails [36–38] and that finite-size effects are small at elevated temperatures [39]. However, with one exception [31], the capabilities of CG models were not exploited to ascertain the progressing nanoscale segregation at low temperatures, which is of great importance for the glassy arrest of ILs. CG force fields were also utilized to study IL dynamics [31, 32, 34, 40, 41]. In many cases, the dynamics of the CG models is faster than that of their AA counterparts because the potential energy landscape becomes smoother when lumping several atoms together in larger beads. Nevertheless, many generic features of the dynamics of viscous liquids are retained.
Here, we perform MD simulations for AA and CG models of an IL composed of 1-octyl-3-methylimidazolium [Omim] cations and bis(tri-fluoromethylsulfonyl)imide [TFSI] anions, see figure 1. First, we employ a successful AA model and develop a CG variant therefrom based on the IBI method. Afterward, we compare the structural and dynamical properties at both levels of chemical accuracy. Finally, the computational efficiency of the developed CG model is exploited to quantify the progress of nanoscale segregation when the temperature is decreased and to determine the morphology of the segregated state as well as the arrangement of the octyl tails in the nonpolar regions. Because ILs are prototypical glass-forming liquids, this knowledge is also useful to improve our understanding of the complex structure-dynamics relations in the supercooled state in general.
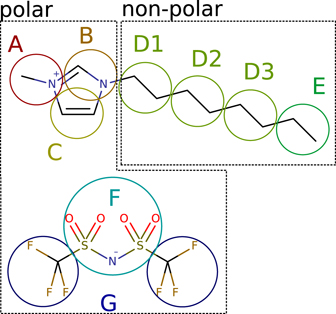
Figure 1. Mapping scheme for the CG model of [Omim][TFSI].
Download figure:
Standard image High-resolution image2. Simulation details
All MD simulations of the AA and CG models were performed under periodic boundary conditions in the NpT (isobaric-isothermal) ensemble using the GROMACS 2018.3 software [42, 43]. The pressure p was kept at 1 bar employing the Parrinello–Rahman barostat [44] with a compressibility of 4.5 × 10⁻⁵ bar−1 and different pressure time constants for the AA and CG models. At all temperatures T, the first 25% of the MD trajectories were used for equilibration and discarded in the analyses.
2.1. All-atom model
As AA model of [Omim][TFSI], we used the interaction potential proposed by Doherty et al [45]. It is based on the OPLS-AA force field and has reduced ionic charges of ±0.8e to account for polarization effects. The AA model has flexible bonds, expect those of the hydrogen atoms, which are constrained by the LINCS algorithm [46]. Moreover, it allows bond bending and torsional motion.
The simulated AA system contained N = 255 ion pairs, resulting in box lengths L of ∼5 nm. A temperature interval from 400 to 250 K was covered and the lengths of the trajectories ranged from 100 ns at the highest temperature to 3000 ns at the lowest one. The time step of the leap-frog integrator was set to 2 fs. The temperature T was controlled using the velocity-rescale thermostat [47] with a time constant of 1 ps. The pressure time constant for the barostat was set to 2 ps. The long-range part of electrostatic and Lennard-Jones interactions were calculated utilizing the particle mesh Ewald (PME) method [48] with a direct space cutoff of 1.3 nm, a Fourier grid spacing of 0.15 nm−1, and a PME interpolation order of four. Verlet neighbor list updates were performed at least every 10 time steps.
2.2. Coarse-grained model
The IBI method was used to derive a CG model from the results of the above AA model at 300 K. For this purpose, the VOTCA 1.5 package [49] was employed and seven beads (A–G) were defined according to the mapping scheme in figure 1, where the position of each bead is given by the center of mass (COM) of the contained atoms.
From an AA simulation at 300 K, we calculated target radial distribution functions (RDFs) for all 28 bead-bead combinations. Moreover, we determined the distributions for all bonds and all angles between neighboring beads. In the CG model, there were no charges on the beads and all bonds were constrained to their mean lengths using the LINCS algorithm because flexible bonds are a major impediment toward the use of larger time steps. We ran 50 IBI iterations with 28 non-bonded potentials and six angle potentials (A–B–D, B–D–D, C–B–D, D–D–D, D–D–E, G–F–G). In each iteration, a system of 255 ion pairs was simulated for 800 ps with a time step of 8 fs. Configurations were stored every 80 fs. The temperature was controlled at 300 K using a Langevin thermostat with a time constant of 1 ps. The start configuration was a mapped AA configuration with a density very close to the average density during the NpT run. The nonbonded and angle distributions were calculated from the trajectory after an equilibration time of 80 ps. Because the iterative method was found to be unstable when using the full IBI update, we scaled it by a factor of 1/4. After each iteration, the Wang–Junghans–Kremer (WJK) correction was applied to the nonbonded potentials. This correction adds a ramp to retain the AA pressure of pref = 1 bar [50].
The WJK correction has been described for one component systems and has also been applied to aqueous solutions of urea, but only to update the water–water interactions [51]. Therefore, we shortly describe how to use this correction in systems with multiple different beads. The correction to the interaction potential of beads i and j is a linear ramp

where Aij is a parameter and rcut is the cutoff distance which is 1 nm for all CG interactions. The pressure change that results from applying the ramp to all interactions is approximately
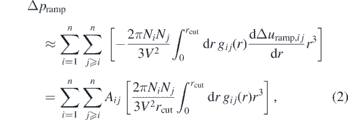
where n is the number of bead types, Ni the number of beads of type i, V the box volume and gij the RDF of beads i and j. This approximation builds on the assumption that the ramp does not change the RDF significantly. Equation (2) has a unique solution for Aij only for a single bead type. In the general case, it is necessary to make a choice on how the pressure update is distributed among the interactions. We choose to define Aij such that each interaction is contributing proportionally to the virial update:

where p is the current pressure. The interaction potentials resulting from this IBI approach are used in their tabulated forms.
For the CG model, we simulated a smaller system comprising N = 255 ion pairs in a temperature range from 400 to 170 K and a larger system with N = 1020 ion pairs from 250 to 170 K. The simulation times for the smaller system range from 40 ns at the highest temperature to 4000 ns at the lowest one. For the larger system, the simulation times were chosen accordingly. To integrate the equations of motion, we used the leap-frog stochastic dynamics integrator from GROMACS and a time step of 8 fs. The time constant for the thermostat was set to 2 ps and that for the barostat to 10 ps. The cutoff for the nonbonded interactions is at 1 nm. Neighbor list updates were performed every 10 time steps.
We note that the experimental glass transition temperature of [Omim][TFSI] is between 183 and 189 K [52]. However, we found no indications of glass formation in the studied temperature ranges, reflecting the speedup of dynamics in CG models, see below.
3. Results
3.1. Convergence of the coarse-graining approach
In figure 2, we show the convergence measures Δij for the interactions of bead types i and j, which are given by

where  is the AA reference RDF and gij
(r) is the RDF at the current iteration. Furthermore,
is the AA reference RDF and gij
(r) is the RDF at the current iteration. Furthermore,  is the arithmetic mean of all Δij
. We find only little systematic improvement in the convergence after the twentieth iteration. However,
is the arithmetic mean of all Δij
. We find only little systematic improvement in the convergence after the twentieth iteration. However,  continues to fluctuate strongly. The E–E interaction between the tail ends, which is highlighted in figure 2, is mainly responsible for a not ideal match in the structure, and a mismatch in the A–E interaction is correlated with it. This implies that the CG system reproduces the spacial correlations of the AA system to a large extent, but fails to replicate the distribution of the tail ends in some configurations. Below, we will show that tail-end aggregation is key to the nanoscale segregation of the AA and CG models and, hence, particularly large fluctuations may be expected for the E–E interactions.
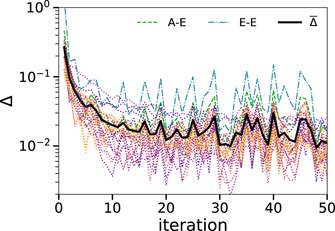
Figure 2. Convergence measure Δ versus the iteration number. The measures for all 28 interactions are given in dotted lines, two of them are highlighted in green and blue. The mean measure  of all interactions is presented as a black solid line.
Download figure:
Standard image High-resolution imageThe pressure amounts to 35 bar after 50 iterations. Hence, it is not fully converged to the target value of 1 bar but is substantially improved compared to a pressure of 1400 bar, which is obtained when running IBI without the WJK pressure correction.
3.2. Local structures of the AA and CG models
We begin by comparing various RDFs of the AA and CG [Omim][TFSI] models at T = 300 K where the IBI was performed. In order to enable a direct comparison, this and the following analyses for the AA model are also performed on the level of beads, i.e., based on the coordinates of the COM of all atoms belonging to a considered bead according to the mapping scheme. In figure 3, we see that the g(r) of both models are in good agreement for most bead types. Some deviations occur for the E–E RDF, which shows a higher first neighbor peak for the CG model than for the AA model, implying that the former is slightly overstructured relating to the arrangement of neighboring tail ends, which will become more evident in the following analysis of nanoscale segregation. Altogether, these findings for the RDFs are consistent with the above results for the IBI convergence.
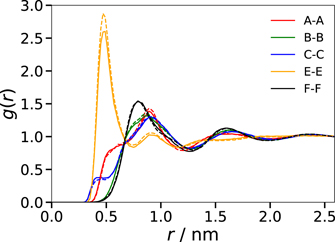
Figure 3. Comparison of g(r) for the indicated bead types at 300 K. The RDFs for the AA and CG models are shown as solid and dashed lines, respectively.
Download figure:
Standard image High-resolution imageA prominent difference between the AA and CG models is found for the conformation of the alkyl tail. To illustrate the effect, the length distribution of the alkyl tail is shown in figure 4. We see that a D1–E distance of ∼0.73 nm, which corresponds to all but one torsion angles being in gauche conformation, prevails in the CG model, while the alkyl tail conformations are more broadly distributed in the AA model. These findings are a result of the parameterization of the CG force field, where all bond lengths are constrained to allow for a longer time step. On top of the definition of CG beads, this further reduction in the intramolecular degrees of freedom leads to less flexible molecules and, thus, to sharper distributions of structure parameters. Nonetheless, the averages of both distributions agree within the statistical error with mean alkyl tail lengths of 0.70 nm for both the AA and the CG model.
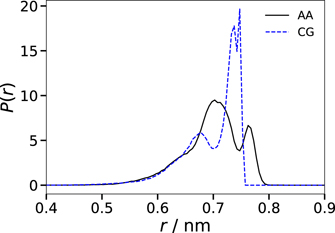
Figure 4. Probability distribution of the length of the alkyl tail, i.e., of the D1–E distance, at 300 K. The results for the AA and CG models are shown as solid and dashed lines, respectively.
Download figure:
Standard image High-resolution imageFor additional comparisons of the AA and CG structures, we further increase the level of chemical abstraction in the analyses. Specifically, we determine the COM positions of the beads (A, B, C) in the imidazolium ring (cation ring), of the beads (D1, D2, D3, E) in the alkyl tails (cation tails), and of the beads (F, G) in the anions. Moreover, we analyze the spatial distributions of the polar groups, comprising the cation rings and the anions, and of the nonpolar groups, i.e., the cation tails, see figure 1, based on the respective COM positions. As the RDFs of all these points are no target functions of the IBI approach, they provide us with an estimate for the agreement of the general structural properties of both models. In figure 5, we compare g(r) for the cation rings, anions, polar groups, and nonpolar groups. We find that the CG model reproduces the RDFs of the AA one reasonably but not fully. Most of the features can be seen at both levels of description, but most first and second neighbor peaks are sharper in the CG than in the AA model. The latter effect cannot be explained by a mismatch of the bead–bead distribution functions in the IBI run. Rather, it shows that a match at the CG resolution is not a guarantee for a match of structure motives on larger scales.
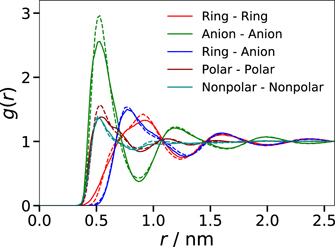
Figure 5. Comparison of g(r) obtained from the COM positions of the cation rings, anions, polar groups, and nonpolar groups at 300 K. The RDFs for the AA and CG models are shown as solid and dashed lines, respectively.
Download figure:
Standard image High-resolution image3.3. Nanoscale segregation of the AA and CG models
To investigate a possible nanoscale segregation of the AA and CG [Omim][TFSI] models, we first inspect some snapshots of the studied systems at T = 180 K and T = 250 K. In figure 6, we see that the polar groups (red spheres) and the nonpolar groups (blue spheres) are not homogeneously distributed in the simulation box, but tend to segregate in both the AA and the CG models. Furthermore, the visual inspection of the configurations suggests that the polar and nonpolar regions grow when the temperature is decreased. Notably, we observe for the larger system comprising 1020 ion pairs that the length scale of the nanoscale segregation at 180 K is comparable to the size of the smaller system with 255 ion pairs, which, thus, may be subject to finite-size effects, see below. Therefore, studies of nanoscale segregation at cryogenic temperatures require not only long simulations to ensure an appropriate equilibration at sluggish particle dynamics but also large systems to avoid size-dependent effects. These conditions cannot be met in AA studies in a reasonable amount of time, demonstrating the need of CG models for such investigations.
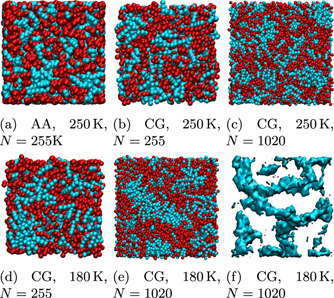
Figure 6. Snapshots of the AA and CG systems at T = 250 K (upper row) and T = 180 K (lower row): (a) AA model, (b/d) smaller CG system, and (c/e) larger CG system. Polar and nonpolar groups are shown as red and blue spheres, respectively. (f) E beads, i.e., tail ends, in the snapshot of the larger CG system at T = 180 K represented as an isosurface of a Gaussian density map. The box lengths of the shown configurations are ∼5 nm and ∼8 nm for the N = 255 and N = 1020 systems, respectively.
Download figure:
Standard image High-resolution imageTo ascertain the morphology of the nonpolar regions, we remove all but the E beads from the snapshot of the CG system with N = 1020 ion pairs at T = 180 K and use an isosurface plot of a Gaussian density map to illustrate their connectivity. In figure 6(f), we observe that the E beads and, hence, the tail ends tend to aggregate into worm-like structures with diameters of 1–2 nm. This finding implies that the nonpolar groups do not form isolated clusters in a network of the polar groups [19, 37, 38], but rather that the nanoscale segregation of the studied CG model is characterized by a bicontinuous morphology comprising intertwined nonpolar and polar regions [36].
To develop a first idea of the arrangement of the alkyl tails inside the nonpolar regions, the isosurface plot of the E-rich regions is supplemented by the positions of the other beads of the alkyl tail in figure 7. Explicitly, the D1–D2, D2–D3 and D3–E interbead vectors are included as thin tubes. We see that the end beads (E) constitute the centers of the worm-like nonpolar regions, while the other beads (D1, D2, D3) form a surrounding shell, in which the alkyl tails preferentially point outward, allowing for an integration of the cation rings into the polar regions.
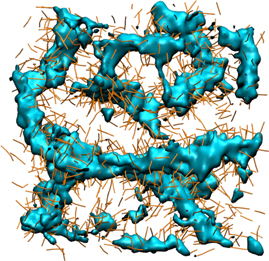
Figure 7. Snapshot of the CG system with N = 1020 ion pairs at T = 180 K. The positions of the E beads at the alkyl ends are shown as isosurface plot to illustrate their connectivity. The interbead vectors D1–D2, D2–D3 and D3–E of the alkyl beads are depicted as thin dark yellow tubes. The polar groups are omitted.
Download figure:
Standard image High-resolution imageTo quantify the nanoscale segregation of the models, we compute the static structure factor S(q) of the nonpolar groups according to

Here, g(r) is calculated using the COM coordinates of all nonpolar groups up to distances of half the box length L, limiting the accessible q range to q ⩾ 4π/L. Figure 8 shows the results for the AA and CG models with 255 ion pairs at various temperatures. For both models, S(q) shows a peak in the range q = 12–15 nm−1, corresponding to the next-neighbor distance of the nonpolar beads (r = 0.42–0.52 nm). Of higher interest in the present context is the peak at small values of q, which is associated with the nanoscale segregation [6–10]. When the temperature is decreased, this prepeak strongly grows and shifts to lower q, consistent with the results in a small-wide angle x-ray scattering study on an imidazolium-based IL [7]. While the position of the prepeak is similar in both models, the height shows a weaker temperature dependence in the AA than in the CG description. However, we refrain from a more detailed comparison because, at lower temperatures, the prepeak occurs at the lower end of the accessible q range for the smaller systems so that finite-size effects play a role and the dynamics of the AA model is not fast enough to ensure an ergodic average over the structural heterogeneity, see below. Because of these size and sampling effects, a comparison of the AA and CG results does not inform about the relative performance of both models.
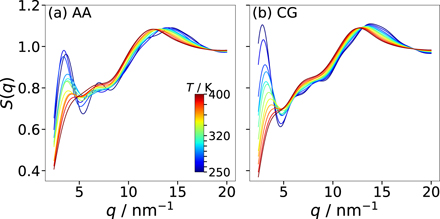
Figure 8. Static structure factor S(q) of the nonpolar groups for (a) the AA model and (b) the CG model (255 ion pairs) in the common temperature range 250–400 K.
Download figure:
Standard image High-resolution imageTherefore, we focus on the static structure factor S(q) of the CG model to ascertain the temperature-dependent nanoscale segregation. In figure 9, we see that the shift of the prepeak can be followed for the larger CG system with 1020 ion pairs down to 170 K. Thus, we can determine a characteristic length scale of the nanoscale segregation from the prepeak position qc according to lc = 2π/qc. The results for all studied systems are compiled in figure 10. We see that the smaller and larger CG systems show a consistent temperature dependence of lc. Specifically, the increase of lc of the small system at high temperatures is continued by that from the large system at low temperatures, where care has to be taken to avoid finite-size effects. In the covered temperature range, the characteristic length scale nearly doubles, resulting in values of ∼3 nm below 200 K. Near room temperature, the results for the CG model are in harmony with lc = 1.9 nm reported in x-ray scattering work on [Omim][TFSI] [53]. Moreover, the results for the CG model are in reasonable agreement with those from the AA counterpart, although the former yields slightly higher lc values than the latter. The minor discrepancy may be a result of the reduced flexibility of the alkyl tails in the CG description, which facilitates the alignment of neighboring chains, and of the aforementioned facts that the AA data suffer from finite-size and, due to incomplete sampling of the phase space, imperfect-averaging effects.
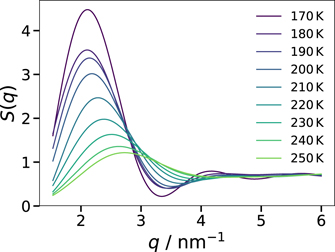
Figure 9. Low q-region of the static structure factor S(q) for the nonpolar groups of the CG model with 1020 ion pairs at various temperatures.
Download figure:
Standard image High-resolution image
Figure 10. Temperature dependence of the characteristic length scale lc associated with the nanoscale segregation of the AA and CG models, as calculated from the position of the prepeak in the static structure factor S(q). The small dots are estimates for the diameter of worm-like structure, see text for details.
Download figure:
Standard image High-resolution imageTo ascertain the microscopic interpretation of the length scale lc, we estimate the extension of the nonpolar regions directly from the bead positions. For this purpose, we randomly distribute a large number of points in the simulation box and calculate, for each of the points, the distance to the nearest polar bead. Thus, the largest of these distances in a given configuration yields the radius of the largest sphere that can be placed inside a nonpolar aggregate without enclosing the position of any polar bead. In other words, twice this value is an upper bound for the diameter of the worm-like nonpolar regions. Averaging over many configurations, this method yields characteristic diameters dc, which increase from ∼1.5 nm near 350 K to a largely temperature-independent value of ∼1.9 nm below 200 K. These diameters dc are smaller than the corresponding lc, in particular, at lower temperatures. This confirms that the tails do not form spherical but rather worm-like aggregates so that the value of lc depends not only on the diameter but also on the length of these structures. Thus, the detailed interpretation of the scattering data depends on the morphology of the nanoscale segregation. Our finding that dc saturates at a value of ∼1.9 nm at low temperatures is a first hint that the tail arrangement in the nonpolar regions resembles that in cylindrical micelles, where the tail ends meet near the cylinder axis and the tail orientations point radially outward. Specifically, the value dc ≈ 1.9 nm agrees with the diameter expected for such configuration in our case, which is the sum of two alkyl chain lengths (∼0.7 nm each) and the distance between neighboring E beads (∼0.5 nm).
3.4. Relative orientation of neighboring alkyl tails
To explore the arrangement of the alkyl tails inside the nonpolar aggregates in more detail, we analyze their relative orientations. For this purpose, the orientation of the alkyl tails is defined as the unit vector pointing from the D1 bead to the E bead. First, we analyze the relative orientations of alkyl tails in their mutual next-neighbor shells. In doing so, two alkyl tails are considered as neighbors when their COM distance is smaller than 0.75 nm, which is the position of the first minimum in the corresponding RDF for the CG model at 190 K. Moreover, the angle φ between the unit vectors of neighboring alkyl tails is specified based on the value of cos φ, which is readily available from the scalar product. Thus, a probability distribution P(cos φ) ≡ 0.5 is expected in the case of a random orientation of the alkyl tails.
Figure 11 presents the distributions P(cos φ) for the AA and CG models at various temperatures. Independent of the level of description, high values at cos φ = ±1 indicate that neighboring alkyl chains prefer parallel or antiparallel orientations. At 300 K, the probability distributions of both models are in reasonable quantitative agreement. However, P(cos φ) shows a weaker temperature dependence for the AA than for the CG model, where a clear preference for a parallel alignment develops upon cooling.

Figure 11. Probability distributions P(cos φ) describing the relative orientation of neighboring alkyl tails at the indicated temperatures: (a) AA model and (b) CG model. The inset directly compares the results for both models at T = 300 K. Here, φ is the angle between the orientations of neighboring alkyl tails, explicitly, between the straight lines connecting the respective D1 and E beads.
Download figure:
Standard image High-resolution imageTo further investigate the low-temperature behavior, we compare the probability distributions P(cos φ) for the smaller and larger CG systems in figure 12. The relative orientation of neighboring alkyl tails hardly depends on the system size. The high values at cos φ ≈ 1 indicate that parallel alignments clearly dominate the arrangement of the alkyl tails in the nonpolar domains of the CG model at low temperatures.

Figure 12. Probability distributions P(cos φ) describing the relative orientation of neighboring alkyl tails in the CG model at the indicated temperatures. The results for the CG systems with 255 and 1020 ion pairs are shown as solid and dashed lines, respectively.
Download figure:
Standard image High-resolution imageIn figure 13, we specify the relative orientation of two alkyl tails in the CG model as a function of their COM distance r. Specifically, we depict the mean value ⟨cos φ⟩ together with the RDF for the COM of the alkyl tails. We see that the parallelism measure ⟨cos φ⟩ and the RDF show maxima at the same distances, indicating that a tendency for a parallel tail alignment is preserved for at least three neighbors along the contour length of the worm-like aggregates. On the other hand, we propose that the intermediary minima are related to the relative orientation of the alkyl tails in the cross-sectional areas of these regions. To discuss this aspect, we again resort to the situation in cylindrical micelles, where chains on opposing sides have antiparallel arrangements and those separated by a quarter turn have perpendicular orientations, considering the alkyl length of ∼0.7 nm and the E–E distance of ∼0.5 nm, these configurations are expected at alkyl distances of, respectively, r ≈ 1.2 nm and r ≈ 0.8 nm, where the minima of ⟨cos φ⟩ are located. Thus, the analysis suggests that the alkyl tails tend to organize in configurations known from cylindrical micelles, though with significantly lower overall order.
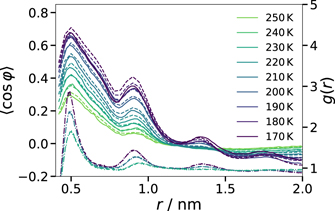
Figure 13. Average relative orientation of two alkyl tails in the CG model as a function of their COM distance r. The relative orientation is specified by the mean value ⟨cos φ⟩. The results for the CG systems with 255 and 1020 ion pairs are shown as solid and dashed lines, respectively. The dashed-dotted lines illustrate the RDFs for the COM of the alkyl tails at 230 K, 200 K and 170 K for comparison.
Download figure:
Standard image High-resolution image3.5. Diffusion
Finally, we study the MD of the AA and CG models. For this purpose, the mean-square displacement (MSD) of the cations and anions is calculated based on the time-dependent COM coordinates  :
:

Here, the pointed brackets denote an average over various time origins t0 along the trajectories. Figure 14 displays the results for the AA and CG models with 255 ion pairs at various temperatures. As expected for viscous liquids, the MSD shows an extended plateau between the regimes of vibrational motion at short times and diffusive motion at long times for sufficiently low temperatures. This indicates that the ions become temporarily trapped in cages formed by their neighbors when the temperature is decreased. While the qualitative behavior is similar for both models, there are distinct quantitative differences. Most notably, the temperature dependence is much higher for the AA model than for its CG counterpart. Moreover, the difference between the cation and anion displacements is smaller for the former than the latter model at lower temperatures. In passing, we note that we found no evidence for a system-size dependence of the MSD in the CG model. Moreover, we point out that the diffusive regime is not fully reached at low temperatures, in particular, for the AA model. Therefore, the above results for the structural properties and the following analysis of the dynamical features at these temperatures should be treated with some reservations.
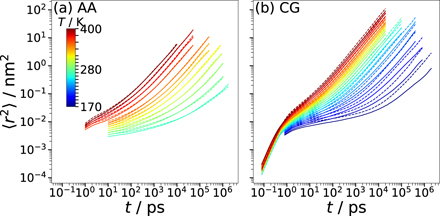
Figure 14. MSD ⟨Δr2(t)⟩ of the cations (solid lines) and the anions (dashed lines) at the indicated temperatures: (a) AA model and (b) CG model.
Download figure:
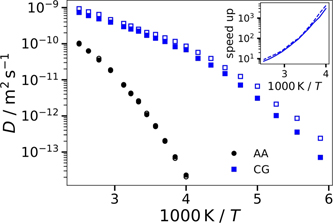
Standard image High-resolution imageTo quantify the differences between the AA and CG dynamics, we determine the self-diffusion coefficients D from fits of the MSD in the diffusive regime with ⟨Δr2(t)⟩ = 6Dt. The results are presented in figure 15. For both models, we observe prominent deviations from Arrhenius behavior, as expected for molecular glass-forming liquids. However, the temperature dependence is much higher for the AA than for the CG model. This effect is further illustrated in the inset, which reveals that the speedup factor DCG/DAA increases from ∼10 at T = 400 K to values of more than 1000 near T = 250 K. Similar discrepancies between AA and CG models of glass-forming ILs were reported in previous simulation studies [31, 41]. In the literature, various strategies, e.g., generalized Langevin equation approaches, were proposed to cope with such speedup of dynamics when removing degrees of freedom and smoothing the energy landscapes upon coarse graining [54]. Since the structural properties of ILs are the main focus of the present study, we do not pursue this promising but still challenging route. Nevertheless, our findings that the self-diffusion coefficients of the cations and anions are similar for the AA model in the whole accessible temperature range, whereas the temperature dependence of D is higher for the cations than the anions in the CG model suggest that the prominent nanoscale segregation in the CG model at low temperatures has stronger effects on cation than anion diffusion.
Figure 15. Self-diffusion coefficients D of the cations (solid symbols) and the anions (open symbols) as a function of the inverse temperature. Results for the AA model (black circles) and the CG model (blue squares) are compared. The inset depicts the temperature-dependent speedup factor DCG/DAA for the cations (solid line) and the anions (dashed line).
Download figure:
Standard image High-resolution image
4. Conclusion
The use of a CG model allowed us to follow the development of prominent nanoscale segregation in an IL upon cooling. The large length scale of this structural heterogeneity in combination with the slow glassy dynamics at low temperatures pose serious challenges to MD simulation approaches. Specifically, simulations of large systems for long times are required to avoid finite-size effects and to ensure appropriate equilibration of the system and ergodic averages in the analyses. While AA descriptions fail to meet these requirements with reasonable computational effort, we found that CG models enable considerable progress.
Employing the IBI method, we obtained a CG model, which largely reproduces the structure of its AA counterpart at 300 K even though its particles are not charged and all bonds are constrained in order to improve the computational efficiency. In particular, the CG model replicates various structural parameters of the AA model, which were not used as target functions in the IBI run, e.g., the relative orientation of neighboring alkyl tails.
We studied the temperature transferability of the CG model down to 250 K, where the equilibration of the AA system starts to fail. We found that the nanoscale segregation develops more rapidly upon cooling in the CG than in the AA model. Most probably, this difference results from the reduced intramolecular flexibility, in particular, the stiffer alkyl tails in the CG description. Because incomplete sampling of the phase space cannot be excluded for the AA system, a CG model without constrained bonds should be studied at the cost of computational performance to scrutinize this conjecture. Moreover, we observed that the temperature dependence of the self diffusion coefficients is much weaker in the CG than in the AA model, leading to a speedup factor of about three orders of magnitude at 250 K. Similar discrepancies were reported for other IL models [31, 41]. Generally, the effect can be attributed to the fact that CG descriptions lead to smoother energy landscapes than their AA counterparts [54]. This will be analyzed in more detail in future work. Either way, both the faster structural changes and the retarded dynamical slowdown in the CG model facilitate studies of nanoscale segregation at low temperatures, which is of great importance for the glassy arrest of ILs. It may lead to differences between the glassy dynamics of ILs and simple liquids, which do not show such structural inhomogeneity.
Visualization of the polar and nonpolar regions revealed nanoscale segregation already near ambient temperatures, independent of the chemical accuracy of the modeling and in harmony with a number of previous experimental and computational approaches. To ascertain the morphology of this structural inhomogeneity, it proved to be very advantageous that CG approaches enable studies of large systems at low temperatures. Appropriate snapshots indicated a bicontinuous morphology of polar and nonpolar regions. In particular, we observed that the alkyl tails form worm-like aggregates.
These results from visual inspection were confirmed in statistical analyses. We found that the progressing nanoscale segregation upon cooling manifests itself in the growth and shift of a prepeak in the static structure factor S(q) of the CG model. The characteristic length scale associated with this prepeak grows from ca 1.5 to 3.0 nm when the temperature is decreased from 350 to 200 K, reinforcing the need for large systems to avoid finite-size effects. Moreover, an analysis of the relative orientation of the alkyl tails as a function of their distance revealed the arrangement of these entities inside the worm-like polar regions. It turned out that the tail ends preferentially aggregate in the center of the channels and the other parts of the chains tend to be parallel aligned and point outward, allowing for an integration of the head groups into the polar regions. Thus, the organization of the nonpolar tails resembles that in cylindrical micellar structures, though with reduced overall order.
Acknowledgments
This work was funded by the German Science Foundation (DFG) within projects A6 and B1 of the SFB TRR 146—project number 233630050.
Data availability statement
The data that support the findings of this study are available upon reasonable request from the authors.