
Abstract
In this work we explore the phase diagram of the binary Nb–S system from ambient pressures up to 250 GPa using ab initio evolutionary crystal structure prediction. We find several new stable compositions and phases, especially in the high-pressure regime, and investigate their electronic, vibrational, and superconducting properties. Our calculations show that all materials, besides the low-pressure phases of pure sulfur, are metals with low electron–phonon (ep) coupling strengths and critical superconducting temperatures below 15 K. Furthermore, we investigate the effects of phonon anharmonicity on lattice dynamics, ep interactions, and superconductivity for the novel high-pressure phase of Nb2S, demonstrating that the inclusion of anharmonicity stabilizes the lattice and enhances the ep interaction.
Export citation and abstract BibTeX RIS

Original content from this work may be used under the terms of the Creative Commons Attribution 4.0 licence. Any further distribution of this work must maintain attribution to the author(s) and the title of the work, journal citation and DOI.
1. Introduction
In recent years, transition metal chalcogenides (TMC) have gained significant research interest based on their chemical and physical variety, as well as their tendency to create layered structures [1, 2]. This constraint in geometry has been shown to be the source of many interesting phenomena related to electron–phonon (ep) processes such as charge density waves (CDW) and superconductivity (SC) [3–6]. For some TMC materials, Mott-insulating behaviour or potential topological SC has also been predicted [7–9], properties that could find future applications in high-performance electronics, as controllable Mott transitions allow very fast, precise and efficient field-effect transistors (FET) [10], and Majorana states in topological SC could smooth the way to fault-tolerant quantum computing [11, 12].
Extensive studies have been conducted specifically on transition metal dichalcogenides (TMD). Featuring weakly bound van-der-Waals (vdW) layers, they offer a plethora of ways to manipulate and influence their physical properties, for example by varying the stacking order of the layers, intercalating other elements, doping via ionic liquids, etc. [13–15]. This leads to applications as cathodes for batteries [16], solid lubricants due to low friction between the layers [17, 18], electrocatalysts for energy conversion [19, 20], and makes them versatile candidates for 2D beyond-graphene materials [21–23].
The semiconducting phases with group-4 and group-6 transition metals are studied for their applications in photovoltaics and electronics [24–26]. Many TMDs undergo an indirect-to-direct band gap transition with decent carrier mobilities when bulk materials are exfoliated down to the monolayer limit [27–30], making them favourable as FET components in terms of efficiency as well as size [31–34].
Group-5 TMDs, by contrast, can be metallic by filling the lowest d band and exhibit conventional ep-mediated SC and CDW order. The coexistence and interaction of these two, at first glance mutually exclusive phases, is the focus of intensive research at the moment. Recent studies suggest that the ep coupling responsible for creating the CDW phase is strongly localized in k-space, allowing for the remaining ep interactions at other wave vectors to promote SC [35–43].
External pressure can have significant effects on many physical properties, as it strongly influences atomic bonding and hence electronic properties, lattice dynamics, and ep interactions, driving materials towards or away from lattice instabilities [44–50]. While many TMD phases are well studied up to higher pressures, including investigations of their electronic and vibrational properties, and phase diagrams of other specific TMC stoichiometries at lower pressures have been reported [2, 3, 51–53], comprehensive and systematic studies on possible stable phases up to high pressures are still missing to the best of our knowledge.
With this work we want to contribute to fill this void by analyzing the high-pressure phase diagram of Nb–S. We find several novel materials and phases, for which we determine their thermodynamic stabilities, as well as their electronic and vibrational behaviours, placing particular focus on ep interactions and associated physical phenomena such as SC.
2. Methods and computational details
We investigated the phase space using the USPEX package for evolutionary crystal structure prediction [54, 55] in the pressure range from 0 to 250 GPa. For an overview, we started variable-composition runs in steps of 50 GPa, providing already known phases as additional seed structures, and further refined our search to find phase boundaries within an 5 GPa accuracy [56]. We employed density functional theory (DFT) via the Quantum ESPRESSO (QE) package [57] for all thermodynamically stable and metastable structures to relax the unit cells below a threshold of 10−6 Ry/a0 for all force components, and to calculate the electronic band structure and density of states (DOS) with an accuracy in the total energy between 5 meV/atom to 10 meV/atom [58]. We used scalar-relativistic optimized norm-conserving Vanderbilt pseudopotentials [59, 60], a PBE + vdW functional [61, 62] for calculations up to 25 GPa [63], and a PBE-GGA functional for all calculations above 25 GPa. We calculated phonon dispersion relations, phonon DOSs as well as ep coupling strengths λ within the framework of density functional perturbation theory (DFPT), as implemented in QE [64]. The values for the critical temperature Tc were estimated according to the Allen–Dynes McMillan formula [65] with a typical value for the Morel–Anderson pseudopotential μ* = 0.1, if not stated otherwise [66, 67]. For Nb2S, we additionally employed maximally localized Wannier functions and the fully anisotropic Migdal–Eliashberg theory as implemented in the EPW package to calculate λq,ν , nesting functions ζq , and superconducting gaps Δk (T) as a function of temperature T [68, 69].
3. Phase diagram
Following the evolutionary crystal searches we performed further relaxation and enthalpy calculations on the best candidates and determined convex hulls in the pressure range from ambient to 250 GPa pressure, as shown in figure 1 for five different pressures. A full phase diagram of stable structures and their space groups is presented in figure 2, where we indicate in blue previously reported phases and novel phases in green.

Figure 1. Convex hulls of enthalpy of formation ΔH for compounds Nbx Sy over sulfur fraction y/(x + y) for different pressures. The circles mark stable structures, the crosses indicate a few selected metastable structures that are less than 60 meV above the convex hull.
Download figure:
Standard image High-resolution image
Figure 2. Phase diagram for the stable crystal structures in the Nb-S system. The numbers above the bars indicate the space group, the horizontal fading the transition pressures, and the colours previously reported (blue) and novel phases (green). The hatched region of Nb2S denotes the dynamically unstable pressure range including anharmonic corrections.
Download figure:
Standard image High-resolution imageIn the studied pressure range, we reproduce the known phases of the Nb–S system in excellent agreement with literature [39, 53, 54, 70–82]: at ambient pressure the convex hull shows the stability of previously reported phases Nb14S5, Nb3S4, (2H-)NbS2, and NbS3, while Nb21S8 and NbS observed in higher-temperature experiments [83–86] appear as metastable, 4 meV and 29 meV above the convex hull tie-line, respectively. Increasing pressure, the formation of NbS becomes favourable and it represents the convex hulls' minimum above 30 GPa with a maximum enthalpy difference of about 1.8 eV/atom at 250 GPa.
Our structure searches also reveal several novel phases and materials of the Nb–S system, for which we provide all crystallographic details and schematics in the supplemental material (SM (https://stacks.iop.org/JPCM/33/174001/mmedia)) [87]: (i) NbS in the high-pressure CsCl-type phase (space group 221), (ii) Nb2S3 in different low- and high-pressure phases (space groups 160 and 139), appearing as 'doubled' 3R-NbS2 and high-pressure NbS2, respectively (see figure S2 [87]), (iii) Nb3S5, which appears as 3R-NbS2 intercalated with Nb atoms in octahedral coordination, resulting in the low-symmetry space group 1, (iv) Nb3S, a simple cubic material (space group 223) where the S atoms are in icosahedral coordination with the surrounding 12 Nb atoms, and the icosahedra being stacked in a bcc superlattice fashion, (v) three phases of Nb2S (space groups 42, 11, and 189) that are described in detail in section 4.
Based on the types of appearing crystal structures, the phase diagram can be separated roughly into low- and high-pressure regions between 50 and 100 GPa. The low-pressure phases are predominantly built by layered NbS units in the trigonal prismatic or octahedral geometry known from TMD [88, 89], resulting in many layered (meta)stable structures with combined stacking patterns known from 1T-, 1H-, 2H- and 3R-NbS2 (see figures S1 and S2 [87]). On the other hand, the high-pressure sulfur-rich phases, i.e. y/(x + y) ⩾ 0.5 with x being the number of Nb atoms per formula unit and y the number of S atoms per formula unit, consist of different layered stackings of the CsCl-like simple cubic NbS unit (space group 221) as illustrated in figure 3(d).

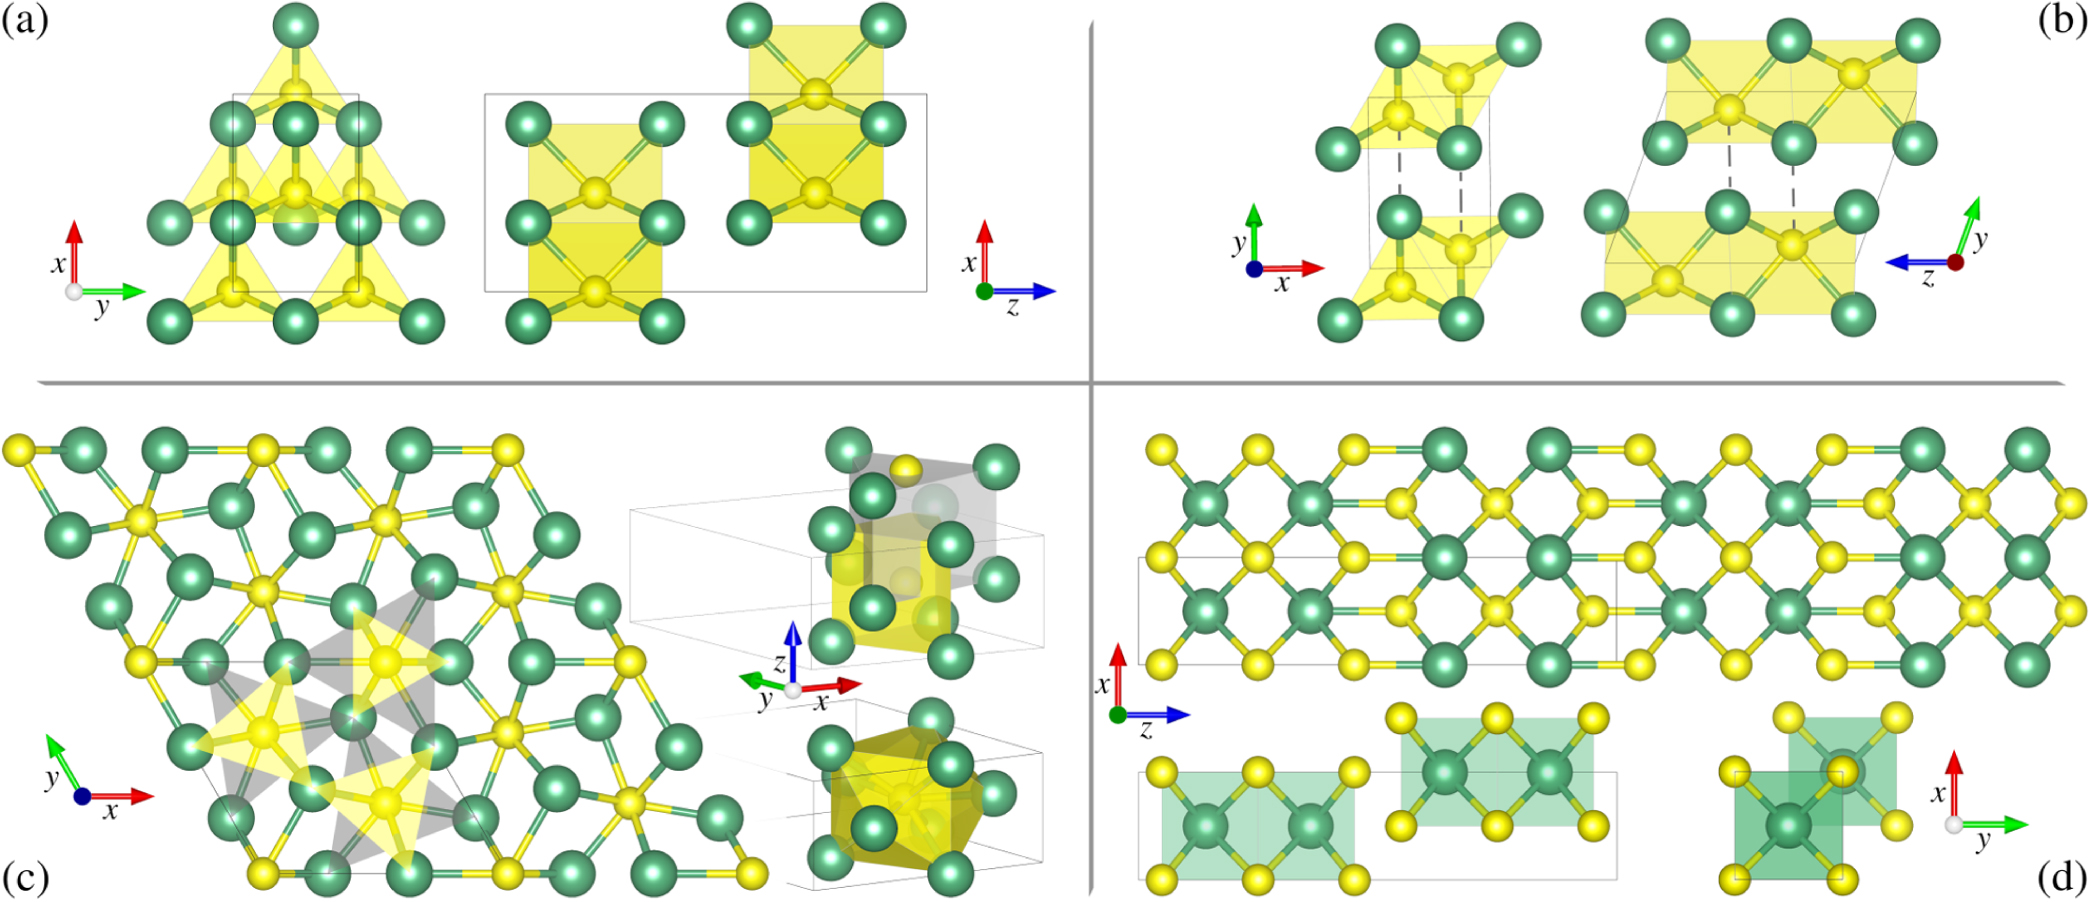
Figure 3. Characteristic crystal structures and geometries in the Nb–S system on the basis of Nb2S and high-pressure Nb2S3. Nb atoms are shown as large green spheres, S atoms as small yellow spheres, and the black solid lines indicate the unit cells. (a) Metastable Nb2S (space group 42) with S atoms in trigonal prismatic coordination with Nb shown from z-direction (left) and y-direction (right). (b) Metastable Nb2S (space group 11) shown from z-direction (left) and x-direction (right). This structure consists of a shifted stacking of low-pressure NbS planes [87], bringing certain Nb atoms in a distance to S atoms (dashed lines) that is only 10% longer than the drawn bonds. (c) High-pressure Nb2S (space group 189) with S atoms in tricapped trigonal prismatic coordination with Nb. The coordination of a single S atom is highlighted in the lower 3D view, as a guide to the eye for the complex coordination geometry, a full (yellow) and an empty (grey) trigonal prism are shown in the upper right 3D view. A 2 × 2 × 1 super cell is shown from z-direction on the left, where again the two prisms are indicated to highlight their hexagram orientation. They are shown for two S atoms inside the unit cell and one S atoms at the unit cell border, which are conceptually equal, but differ slightly in bond lengths. (d) High-pressure Nb2S3 with a 2:2 stacking (see SM [87]). A 2 × 1 × 2 super cell in y-direction is shown on top, the stacking and cubic coordination are emphasized in the bottom panels.
Download figure:
Standard image High-resolution imageFor the high-pressure stacking with an even ratio n:n, i.e. n simple cubic NbS units on top of each other and n units shifted by (a/2, b/2, 0) shown in Fig. 3(d) and figure S3 [87], we find the stoichiometric formula Nbn Sn+1 and the tetragonal space group 139, while an odd ratio n:(n + 1) results in Nb2n+1S2n+3 and space group 123. Stable structures are predominantly formed with an even ratio and n = 1, 2, namely NbS2 and Nb2S3, respectively, and metastable structures can be found with even and odd ratios up to n = 5 (figure S3 [87]).
As widely reported in literature, the formation of layers is without doubt a common feature of TMC and we therefore want to emphasize on some highly three-dimensional structures here: (i) Nb3S4 [73, 90], in a hexagonal crystal structure, where all Nb atoms are in octahedral coordination, forming a 3D mesh-like structure. (ii) The so far unknown Nb3S, being the only Nb-rich member of the phase diagram at pressures above 235 GPa. We also find an isostructural material with inverted empirical formula, NbS3, that is metastable at high pressures. (iii) The so far unknown high-pressure structure of Nb2S, where nine Nb atoms forming a 14-faced structure around the S atoms are three-dimensionally packed in a hexagonal lattice. The crystal structure of Nb2S, which we will discuss in detail in section 4, as well as examples of the characteristic crystal geometries in the Nb–S system are shown in figure 3.
For all materials not extensively discussed in literature we carried out electronic, vibrational, and ep calculations, revealing that all phases except pure sulfur at low pressures are metallic and superconducting with Tc < 15 K. To not deter from the main focus of this paper, we provide an extensive discussion of all materials and their properties in the SM [87] and in the following analyse in detail the novel Nb2S compound, for which we find imaginary phonon modes within DFPT at certain parts of the Brillouin zone (BZ) that are indicative of lattice instabilities. In the next section we will show that this putative instability is due to the disregard of anharmonic effects and that considering the full anharmonic potential, Nb2S is in fact stable over a wider pressure range exhibiting SC and strong ep coupling.
4. Nb2S—anharmonicity and SC
At low pressures, we find two metastable phases of Nb2S (see convex hulls in figure 1), namely an orthorhombic structure (space group 42) at ambient pressure that consists of vdW-coupled layers in trigonal prismatic geometry around sulfur atoms [91], shown in figure 3(a), and above 20 GPa a monoclinic structure (space group 11) with a different trigonal prismatic arrangement exhibiting a denser clustering of Nb atoms around S atoms (indicated by dashed lines in figure 3(b)). The former lies 6 meV above the convex hull tie-line, and the latter 60 meV. Above 40 GPa, a hexagonal phase (space group 189) with nine atoms per unit cell becomes more favourable, but appears on the convex hull only above 60 GPa due to the presence of Nb14S5. Here, the main repetition unit is a non-uniform 14-faced triaugmented triangular prism around S atoms, formed by two shifted and rotated triangular prisms in hexagram geometry as illustrated in figure 3(c). As indicated by the shaded areas in the supercell, the side lengths of the two auxiliary trigonal prisms (yellow and grey) are different, as well as the side lengths of the conceptually equal prisms around S atoms inside the unit cell and around S atoms at the unit cell border. Above 235 GPa the simple cubic Nb3S structure becomes thermodynamically more favourable and Nb2S leaves the convex hull.
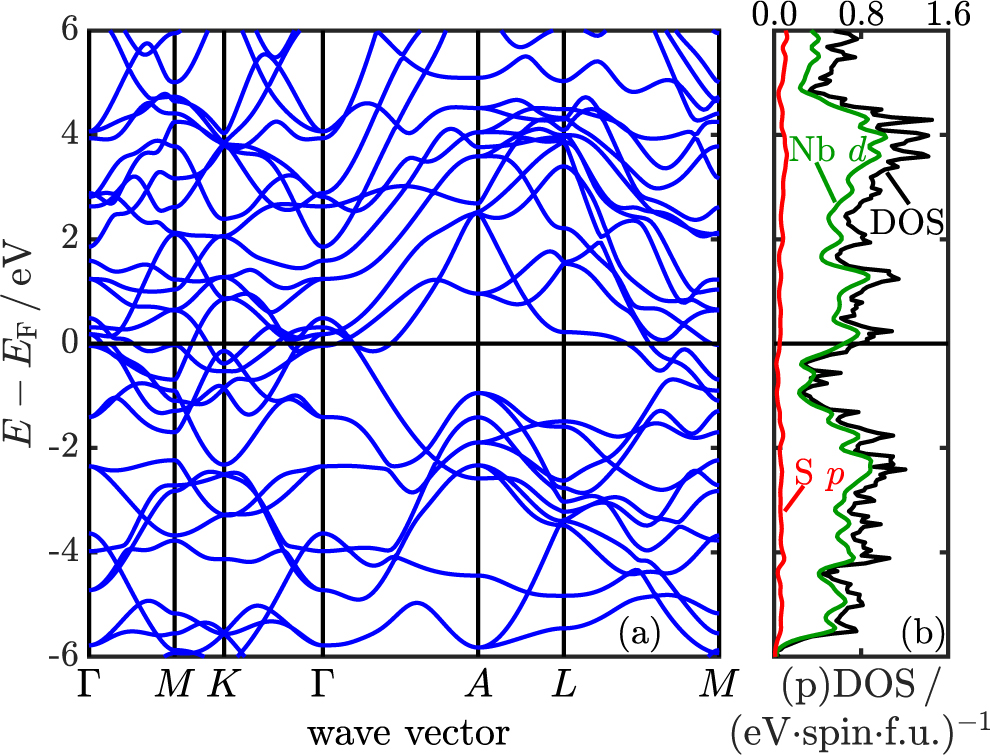
In figure 4, we show the electronic band structure around the Fermi level of the high-pressure Nb2S phase along a high-symmetry path of the hexagonal BZ. We find highly anisotropic dispersions in all directions, supporting our structural observations that this is indeed a highly three-dimensional material. The DOS together with the partial projections onto the Nb d and S p orbitals are reported in the same figure. We find the Fermi level on the lower shoulder of a peak in the DOS, a property that remains robust over the stable pressure range, as demonstrated in figure S4 [87]. In the energy range around and especially at the Fermi energy, the main contributions to the total DOS originate from the Nb d orbitals, a prominent feature already observed in group-5 TMDs [26] and also present in most other phases in the Nb–S system [87].

Figure 4. Electronic properties of Nb2S at 225 GPa. (a) The band structure around the Fermi level along a high-symmetry BZ path and (b) the (partial) DOS and orbital contributions. The green curve shows the sum over all Nb d orbitals, the red curve the sum over all S p orbitals.
Download figure:
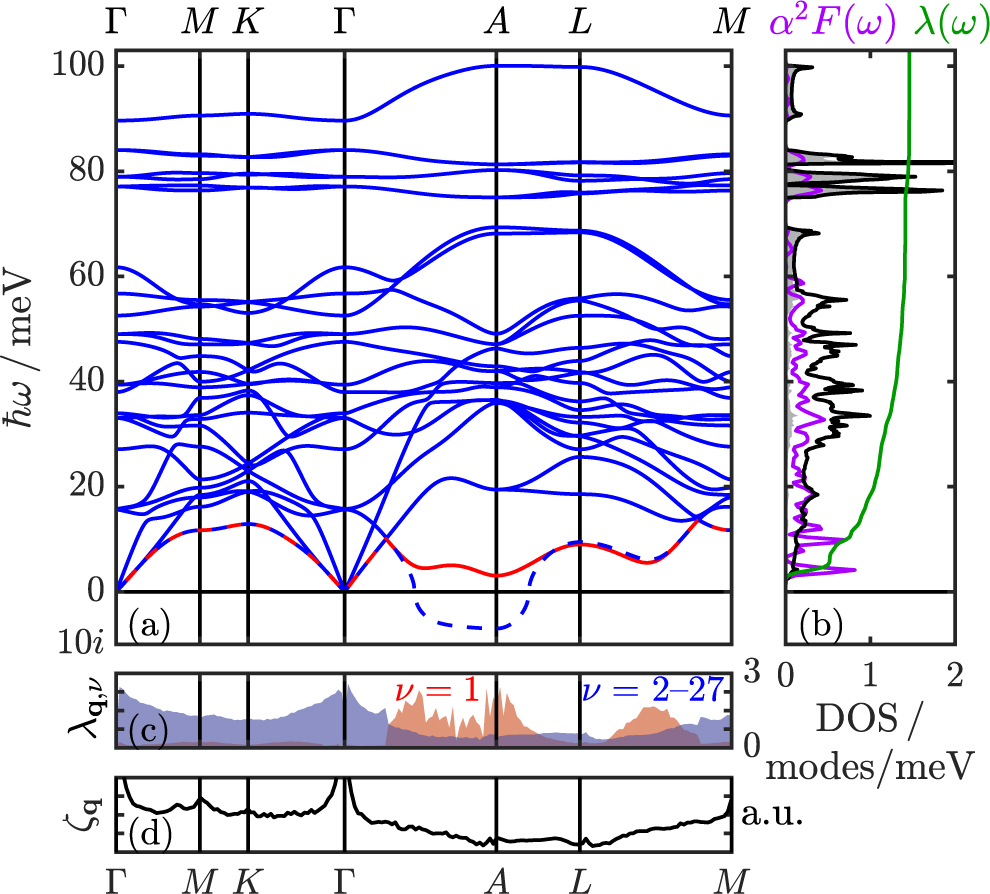
Standard image High-resolution imageVibrational properties of high-pressure Nb2S are shown in figure 5. The main contribution to the phonon DOS up to the peak below 60 meV stems from the heavier Nb atoms, and above that from the lighter S atoms, as indicated by the white and grey areas underneath the DOS curve in figure 5(b). The S-dominated DOS range is separated by two phonon band gaps around 70 and 85 meV. In the harmonic phonon dispersion (blue lines in figure 5(a)) we find a single soft phonon mode exhibiting imaginary phonon frequencies in a BZ region around q1 = (0, 0, 1/2) = A, clearly visible along the path Γ − A − L, and suggesting an apparent lattice instability. As demonstrated in reference [42] for the case of NbS2 though, imaginary (harmonic) phonon frequencies are not a conclusive indication for lattice instabilities, but rather require a deeper quantum mechanical treatment. For that purpose, we calculated explicitly the corresponding adiabatic potential energy surface (APES) for those q-points that have imaginary phonon modes. This was done via a frozen phonon approach, for which we constructed appropriate supercells in order to fold a specific q-point back to Γ, where the DFPT solution provides a real phonon eigenvector and therefore directly the atomic displacements. In our case, where we find imaginary modes at q1 = A and q2 = 2/3A, this leads to 1 × 1 × 2 and 1 × 1 × 3 supercells, respectively. We performed total energy calculations as a function of the phonon eigenvector amplitude, allowing us to construct the full anharmonic APES, for which we then solved the one-dimensional Schrödinger equation [92].

Figure 5. Vibrational and ep properties of Nb2S at 225 GPa. (a) Phonon dispersion, where the dashed line represents the imaginary mode as given by the harmonic approximation and the red solid line indicates the full anharmonic result. (b) Phonon DOS (black line) with S (Nb) contributions as grey (white) area, Eliashberg function α2 F(ω) (purple), and cumulative ep coupling strength λ(ω) (green). (c) Mode-resolved ep interaction λq,ν along the high-symmetry path for the lowest (red shaded area, ν = 1) and all other modes (blue shaded area). (d) Nesting function ζq along the same path.
Download figure:
Standard image High-resolution imageTo calculate phonon dispersion relations and ep interactions in the presence of anharmonicity, we retain the (harmonic) DFPT eigenmodes and use the anharmonically corrected frequencies, approximated via the difference between the first two eigenenergies of the fully anharmonic APES, to compute the interatomic force constants and dynamical matrices [93]. We also find that taking into account the full anharmonic potential leads to ground state probability densities centred at the high-symmetry structures, i.e. non-displaced atoms, and non-vanishing anharmonic phonon frequencies, and therefore to a stabilization of the Nb2S structure. The anharmonically corrected phonon dispersion is presented in figure 5(a) using the solid red line.
In figure 5(b) we report the Eliashberg spectral function α2 F(ω) and cumulative ep coupling strength λ(ω), including anharmonic corrections. The Eliashberg function essentially follows the phonon DOS for energies above 15 meV, but exhibits a few additional peaks in the low-energy range corresponding to the flat dispersion of the anharmonic mode along the path L − M. In accordance with the sharp increases in the cumulative λ due to the peaks in α2 F(ω), we find that the low-frequency, anharmonic mode contributes around 50% to the total ep coupling of about λ = 1.5. In order to elucidate the origin of this strong ep interaction, we calculated the mode- and wave vector resolved ep coupling strength λq,ν . As expected, we find a large portion of the total ep coupling stemming from the anharmonic mode around A and close to L − M (figure 5(c)). Conversely, we observe no strong response at these regions of the BZ for the nesting function ζq (figure 5(d)), indicating that the observed anharmonicity and softening of phonon modes is purely due to a strong, spatially localized ep coupling.
In figure 6(a), we trace the anharmonic modes for the two irreducible wave vectors q1 and q2 over pressure and find an opposed behaviour, i.e., the frequency of the q2 mode increases with pressure, while it decreases for q1. Extrapolating the energy of the q1 mode, we find a hypothetical dynamic stability limit around 265 GPa. (We want to note at this point that Nb3S already becomes thermodynamically more favourable for pressure above 240 GPa.) An extrapolation of the results for q2 shows that the energy of this mode will vanish for pressures below 130 GPa.

Figure 6. (a) Anharmonic phonon frequencies (top panel) and harmonic approximations (lower panel) for the soft mode at q1 = A and q2 = 2/3A in the pressure range from 175 to 250 GPa. The solid and dashed lines are quadratic fits as guides to the eye. (b) Electron–phonon related quantities λ, ωlog, and Tc as a function of pressure. The shaded area for Tc corresponds to different choices of μ*, with the largest values at a given pressure corresponding to μ* = 0.1 and the smallest to μ* = 0.14. The triangles at 175 and 200 GPa correspond to calculations where the soft mode frequency at q3 and q4 has been shifted 'by hand' (see text). The dashed and solid lines are again guides to the eye. The shaded area below 175 GPa indicates the dynamic instability and the shaded area above 235 GPa indicates the thermodynamic instability.
Download figure:
Standard image High-resolution image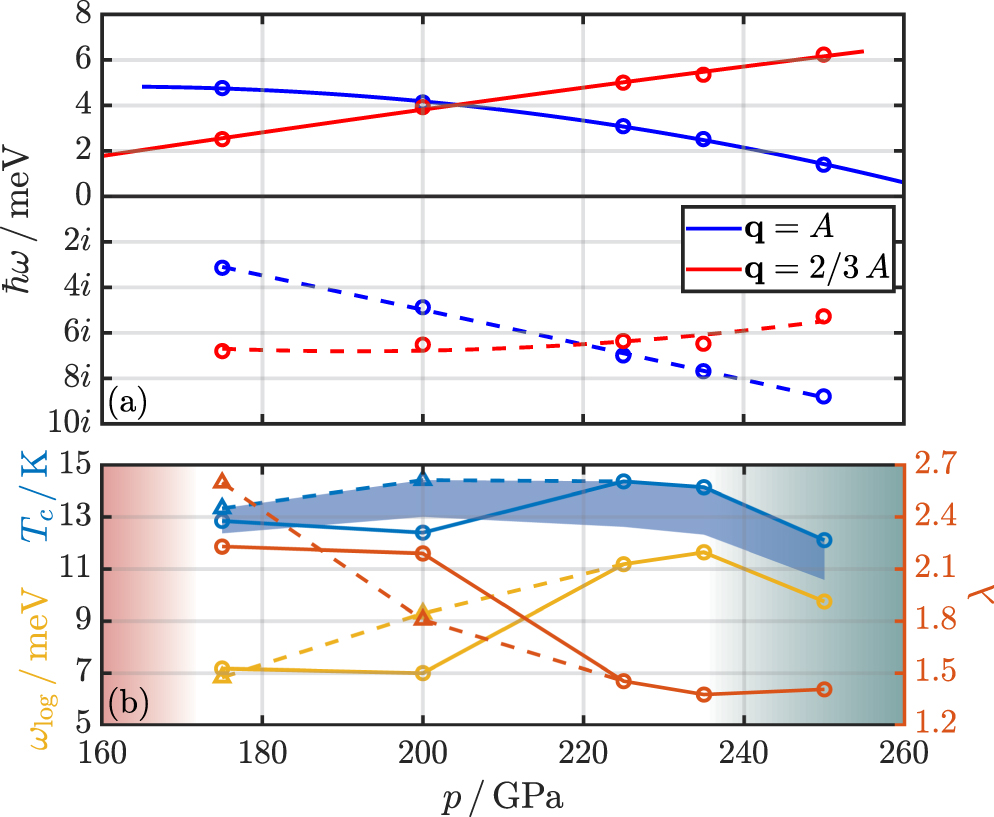
Decreasing the pressure, we also find that the BZ regions of imaginary harmonic modes increase, extending ever closer to and eventually including Γ and additionally appearing on the path Γ − L, as shown in figure S6 [87]. At 150 GPa and below, the ground state probability density of the soft mode at q2 is no longer centred around the high-symmetry structure, but has its maxima in the minima of the double-well APES, thus indicating the transition to a different structure with lower symmetry.
Based on our phonon dispersions for various pressures, we do expect that for pressures between 175 GPa and 200 GPa, Nb2S would still be dynamically stable when anharmonicity would be included for all wave vectors. As the corresponding supercells would be very large and the calculations therefore computationally prohibitively expensive, however, we did not correct the additionally appearing imaginary modes below 200 GPa by a full calculation of the APES. Instead, we chose to approximately investigate the sensitivity of the results with respect to anharmonic effects by shifting the soft mode energies of the additional wave vectors 'by hand': The choice of our q-grid results in two irreducible q-points in these regions, namely q3 = 1/3A and q4 = (0, 1/3, 1/3) = 2/3L, for which we set the modes' energies such as to achieve fully positive dispersions in the whole BZ at 175 GPa and 200 GPa, and no soft mode energy below 1 meV in order to avoid artificially high ep couplings.
This allows us to evaluate the superconducting properties over the full stable pressure range of Nb2S. In figure 6(b), we show the total ep coupling strength λ, ωlog, and Tc as functions of pressure. The circles and solid lines correspond to calculations for which anharmonic effects are only considered for wave vectors q1 and q2 (all ep contributions from imaginary phonon modes at q3 and q4 are set to zero), while shifting the frequencies of q3 and q4 'by hand' as described in the previous paragraph leads to the triangles and dashed curves. The latter yield smoother and dome-shaped curves for Tc, supporting our initial hypothesis that the APES associated with the phonon modes at 1/3A and 2/3L have indeed a strong anharmonic part.
We find Tc values ranging between 12 and 14 K (see table S1 in the SM for a comparison with the other materials in the Nb–S system [87]). λ increases dramatically when decreasing pressure due to increasing anharmonic effects, reaching values comparable to the current Tc record holders in the high-pressure hydride class [94–100]. The characteristic phonon frequency ωlog, however, is dominated by low-frequency modes of heavy Nb atoms, thus counteracting the high ep coupling, resulting in only a moderate critical temperature Tc.
We further performed calculations in the framework of the fully anisotropic Migdal–Eliashberg theory, in order to obtain the superconducting gap as function of temperature, and find an isotropic and single-gap distribution of the superconducting gap, as detailed in figure S5 [87].
5. Conclusions
In this work we studied the binary phase diagram of the Nb–S system and investigated ep coupling and superconducting properties of its phases up to 250 GPa, using fully ab initio methods. Our results are in excellent agreement with literature for previously reported phases and we find several new materials, revealing an intricate phase diagram at all pressures. Apart from crystal structures consisting mainly of layers with distinct high- and low-pressure building blocks, we also find phases with particularly strong three-dimensional character, and except for the low-pressure phases of pure sulfur, all investigated structures are superconducting metals with Tc's below 15 K.
We focussed in particular on the highly three-dimensional, high-pressure phase of Nb2S that exhibits an apparent lattice instability. By taking into account the full anharmonic potential energy surface, however, we show that this instability is suppressed, demonstrating that imaginary harmonic phonon frequencies are not a conclusive indicator for lattice instabilities, but require a more sophisticated quantum-mechanical treatment. By ruling out Fermi surface nesting, the origin of the strong anharmonicity is found to be in most parts due to an ep interaction particularly strong for a single phonon mode and certain wave vector regions of the BZ.
Employing the fully anisotropic Migdal–Eliashberg theory, we find that the superconducting gap function is fairly isotropic with only a single gap. We further investigate the influence of the anharmonic corrections on ep coupling and SC, as well as their dependence on pressure, and find a dome-shaped behaviour for Tc with a maximum of 14.4 K at 225 GPa.
Our research reveals a much more complex phase diagram for the Nb–S system than indicated by available literature, featuring not only the characteristic, layered vdW structures, but also highly three-dimensional phases at low and high pressures, some of which exhibit interesting anharmonic phonon behaviour and strong ep interaction. Shedding new light on the Nb–S system, our findings encourage to revisit familiar systems with the promise of discovering novel and fascinating phases.
Acknowledgments
This work was supported by the Austrian Science Fund (FWF) Project No. P 32144-N36, the dCluster of the Graz University of Technology, and the VSC4 of the Vienna University of Technology.