

Abstract
A first-principles computational tensile test (FPCTT) is a powerful tool to investigate intrinsic strength and failure processes of grain boundaries (GBs), according to atomic and electronic behaviors based on density-functional theory, while careful interpretation is required in comparison with experiments, because of ideal conditions used in FPCTTs. We observed serious effects of a bulk-region size in FPCTTs of the {0 0 1}  5 GB in Al. For a GB supercell with enough thick bulk regions, the energy–strain curve shows spontaneous failure with catastrophic energy release just after the maximum stress point, which we name Type-A failure. For a GB supercell with thin bulk regions, the energy increases gradually even after the maximum stress and continuously becomes that of relaxed fracture surfaces, which we name Type-B failure, although the stress–strain curves are almost common until the maximum stress point in both the supercells. The peculiar failure of Type B occurs by the lack of accumulated strain energies for creating fracture surfaces even after the maximum stress point, because the accumulated strain energy is nearly proportional to the bulk-region size. We clarified that the failure mode in a FPCTT depends on the relationship among the three factors; the accumulated strain energy depending on the bulk-region size, the work of separation (the formation energy of fractured surfaces into a GB), and the maximum stress of the GB (the GB strength). We showed that the failure mode of previous FPCTTs of Al tilt GBs with segregated impurities can be reinterpreted from this viewpoint, by considering the changes of the work of separation and the GB strength by impurities. We should be aware of the distinction of the failure mode in FPCTTs, because experimentally Type-B failure does not occur except for special cases. Finally, we applied ab initio local-energy and local-stress analysis to the FPCTT of the {0 0 1}
  5 GB in Al, and discussed how to extract local energy–strain or energy–separation relations independent of the bulk-region size to be combined with meso- or macroscopic simulations.
Export citation and abstract BibTeX RIS
1. Introduction
First-principles computational tensile tests (FPCTTs) and shear tests (FPCSTs) are powerful tools to investigate intrinsic strength and processes of failure or sliding of grain boundaries (GBs), interfaces or defective systems, according to quantum-mechanical behaviors of atoms and electrons [1]. For successive straining of the supercell, atomic relaxation is performed iteratively according to Hellmann–Feynman forces via density-functional theory calculations, leading to the energy-strain and stress-strain curves involving bond deformation, breaking or switching at/near a GB, an interface or a defect. The FPCTT and FPCST were first applied to a vacancy pipe in Al [2] and twist GBs in Al and Ge [3, 4], respectively. FPCTTs of GBs were first performed for tilt GBs in SiC [5, 6] and Al [7], followed by FPCTTs of metallic GBs with various impurity segregation [8–10] as well as metal/oxide interfaces [11], while FPCSTs were applied to GBs in ceramics or inorganic materials [12, 13]. These studies have been supported by first-principles studies of ideal strength, failure or stress-induced phase transition of bulk crystals [1, 14, 15].
This kind of approach has made great contributions in clarifying the effects of the bonding nature or electronic behaviors on the intrinsic strength and mechanical processes of pure or impurity-segregated GBs, for example. However, we have to be careful in making comparisons of FPCTT or FPCST results with experiments, because such calculations inevitably adopt ideal conditions. Usually, a slow deformation at zero temperature is dealt with without any effects of kinetics or lattice vibrations, and there is no freedom of introduction of extrinsic defects or atomic displacements breaking symmetry or periodicity of a supercell [16]. In a FPCTT of a GB, optimization of the periodicity lengths parallel to the interface according to natural Poisson ratio at each tensile step is usually ignored [17].
Concerning this issue, we examine the effects of a bulk-region size in a GB supercell on a FPCTT in the present study. This is motivated by a recent FPCTT study of Ehlers et al [18] about a simple twist GB in Al, the {0 0 1}  5 GB, which was also dealt with in our previous FPCTT [19]. They dealt with a 40-atom supercell, consisting of alternate stacking of four (0 0 1)-layer bulk slabs, and they did not seem to observe any clear interface breaking, but only softened stretching after the maximum stress point in the FPCTT. In our previous FPCTT of the same GB [19], we dealt with a 50-atom supercell consisting of alternate stacking of five-layer bulk slabs with a similar interface configuration, and we observed similar features. The energy–strain curve shows gradual energy increase even after the maximum stress point, converging to the energy of fractured surfaces, in contrast to usual FPCTTs of Al tilt GBs showing catastrophic energy release at the failure point [19, 20]. However, the interface breaking itself occurs for the 50-atom cell in contrast to the 40-atom cell. Then we thought that the effect of the bulk-region size may be significant.
In the present study, we performed a FPCTT of a 70-atom supercell of the same {0 0 1}  5 GB in Al, consisting of alternate stacking of seven-layer bulk slabs. We observed that the stress-strain curves of the 70-atom and 50-atom cells are rather similar to each other until the maximum stress point, while the energy-strain curve for the 70-atom cell shows usual catastrophic failure with energy release just after the maximum stress, which is quite different from the 50-atom cell showing gradual energy increase even after the maximum stress. As will be analyzed, such a failure-mode change depends on whether the accumulated strain energy until the maximum stress point could reach the work of separation, namely the necessary energy to create fracture surfaces in a GB, or not. In the present study, we show that the failure mode in a FPCTT depends on the relation among the three factors; the accumulated strain energies in the bulk regions, proportional to the bulk-region size, the work of separation, and the maximum stress of a GB configuration, namely the GB strength. By simple model equations, we show that the critical bulk-region size for the failure-mode change is estimated as a function of the work of separation and the GB strength. From this viewpoint, we reinterpret our previous FPCTT results of Al GBs with impurity segregation [8–10], where the changes of the work of separation and the GB strength by impurities lead to different failure modes from that of a pure GB even with the same bulk-region size.
Ehlers et al [18] also discussed general energy-separation curves, independent of the bulk-region thickness in FPCTTs, so as to be used in a cohesive zone model (CZM) or rigid-grain shift (RGS) model in continuum fracture mechanics [21–24], while it is not so easy to remove the strain energy of back-bond or bulk regions depending on the bulk-region thickness in usual full-relaxed FPCTTs. Recently, we developed the schemes of ab initio local-energy and local-stress calculations [25–27], which were already applied to FPCTTs of tilt GBs in Al and Cu [20]. We think that the application of these schemes to FPCTTs may be useful to extract the features of local deformation and failure, independent of bulk-region sizes, so as to be used in a CZM or an RGS model. In the present study, we apply our local-energy and local-stress schemes to the FPCTT of the {0 0 1}  5 GB in Al, and discuss this possibility. For this purpose, the distinction between the two types of failure modes is important.
In this paper, we explain our theoretical method in section 2, including the local-energy and local-stress schemes, the GB models and the procedure of FPCTTs. Results and discussion are provided in section 3. A conclusion is presented in section 4.
2. Theoretical method
Figure 1 shows the supercells of the {0 0 1}  5 twist GB in fcc Al [26]. The GB configuration is constructed by rotating one grain with 36.87° around the [0 0 1] axis and setting (0 0 1) as a GB plane. The rotation axis passes through the atomic arrays in both grains, leading to a configuration with fourfold rotation symmetry and inversion symmetry [19, 28], which are conserved during relaxation. Thus only the rigid-body translation (RBT) normal to the interface is permitted. The translation vectors parallel to the interface are
 ![$\frac{1}{2}a_{0}[3\,1\,0]$](https://content.cld.iop.org/journals/0953-8984/31/9/095001/revision2/cmaaf7f2ieqn007.gif) and
and ![$\frac{1}{2}a_{0}[\overline{1}\,3\,0]$](https://content.cld.iop.org/journals/0953-8984/31/9/095001/revision2/cmaaf7f2ieqn008.gif) , and five atoms are contained per coincidence-site lattice (CSL) cell on each {0 0 1} atomic layer. The 70-atom and 50-atom supercells consist of alternate stacking of rotated slabs of seven and five (0 0 1) layers, respectively, resulting in two equivalent interfaces in each supercell.
, and five atoms are contained per coincidence-site lattice (CSL) cell on each {0 0 1} atomic layer. The 70-atom and 50-atom supercells consist of alternate stacking of rotated slabs of seven and five (0 0 1) layers, respectively, resulting in two equivalent interfaces in each supercell. 
 -point sampling in the Brillouin zone is used for the two supercells. Optimum RBT values were obtained before the FPCTT via iterative relaxation for various RBT values so as to remove the stress normal to the interface.

Figure 1. GB supercells of the {0 0 1}  5 twist GB in Al. (a) Side view of the 50-atom cell. (b) Atomic positions of the interface and back layers in the view normal to the interface. A large square is the CSL unit cell on the (0 0 1) interface plane. (c) Side view of the 70-atom cell. The interface atoms are indicated by green in all the panels. The atom numbers in (b) are those of the 70-atom cell.
Download figure:
Standard image High-resolution imageWe use the projector augmented wave (PAW) method [29, 30] with the PBE GGA functional [31] to deal with the behavior of electrons and atoms and to obtain the energy and stress densities, via the QMAS (quantum material simulator) code [32], similarly to our previous studies [20, 26]. The cut-off radii of the PAW projectors are  a.u. for
  and
and  orbitals of Al. The plane-wave cut-off energy is
  Ry for Al GB. The self-consistence convergence criterion is
  for Al. The force convergence criterion in atomic relaxation according to Hellmann–Feynman forces is
  Hartree (Ht)/a.u. For the fcc bulk crystals of Al, our calculated lattice constant, 4.03
  , is in good agreement with the experimental (4.05
  [33]) and theoretical results (4.04
  [34]).
In a FPCTT [19, 20], the supercell is successively expanded in a small increment of 1% or 2% in the [0 0 1] direction normal to the interface. The cell strain is defined by  , where
  and
and  are the present and initial cell lengths in the [0 0 1] direction. The cell lengths parallel to the interface are fixed for simplicity. Thus the stress is not uniaxial but tri-axial, while only the strain is uniaxial. In each tensile step, initial atomic positions are provided by uniform scaling of relaxed atomic positions of the preceding step, and then relaxed according to atomic forces until satisfying the convergence criterion. During the tensile test, the symmetry in the supercell configuration is preserved so as to reduce computational efforts.
Ab initio local-energy and local-stress analysis can be applied to a supercell configuration in each tensile step as performed in [20]. Details of the local-energy and local-stress calculations are given in [25, 26, 32]. First, energy density [35] and stress density [36] are obtained as data on FFT (fast Fourier transformation) mesh grids by using the wave functions and self-consistent charge-density distribution for the configuration in each step via the QMAS code [32]. The energy and stress densities were formulated as real-space supercell-periodic functions within the plane-wave PAW–GGA framework [25, 32], of which the integrations throughout the supercell correspond to a usual total energy and an averaged stress tensor, respectively, in the conventional PAW method. Second, the energy and stress densities are integrated in each local region to satisfy the gauge-independent conditions, resulting in local energy and local stress as unique physical quantities. This is because the energy and stress densities have inherent gauge-dependency, namely non-uniqueness, concerning the selection of symmetric and asymmetric forms of kinetic-energy density and kinetic-stress density [35, 36]. A supercell is partitioned into each gauge-independent local region, where the differences between the symmetric and asymmetric forms of kinetic-energy density and kinetic-stress density have to be integrated to be zero [25, 37]. As discussed in [26, 37], a Bader region [38], containing an atomic core and partitioned by a surface where the normal gradient of valence charge density distribution is zero, can be such a gauge-independent local region for a local energy. For a local stress, the same Bader region can be used as the gauge-independent local region for a diagonal sum of stress tensor (hydrostatic stress). In this way, we obtain the local energy and local (hydrostatic) stress by integrating the energy and stress densities in each Bader region. Partitioning the supercell into such Bader regions is performed by the Yu–Trinkle algorithm [39] for the valence-charge density distribution. The sum of such local energies rigorously corresponds to the total energy per supercell, and the volume average of such local stresses rigorously corresponds to the cell-averaged hydrostatic stress of the supercell.
3. Results and discussion
3.1. Comparison between FPCTT results by 70-atom and 50-atom cells
Figures 2 and 3 show the energy–strain and stress–strain curves of the {0 0 1}  5 twist GB in Al by using the 70-atom and 50-atom supercells. The present results of the 50-atom cell were obtained via the VASP code [40] using the same PAW–GGA method with similar conditions, in contrast to the usage of the QMAS code for the 70-atom cell. Note that the results of the 50-atom cell are quite similar to our previous results of the same supercell using the QMAS code in [19]. We aim to show that our results of the dependency on the bulk-region size are general one, independent of used computational codes.

Figure 2. Energy–strain curves of the 70-atom and 50-atom supercells for the {0 0 1}  5 twist GB in Al. Total-energy increases against the initial configuration per half of the supercell are plotted for each strain step during the FPCTT.
Download figure:
Standard image High-resolution image
Figure 3. Stress–strain curves of the 70-atom and 50-atom supercells for the {0 0 1}  5 twist GB in Al. Cell-averaged stress-tensor components normal (
 ) and parallel (
 or
or  ) to the interface are plotted for each strain step during the FPCTT. Values of
  and
and  components are the same.
Download figure:
Standard image High-resolution imageFor the 70-atom cell, the tensile stress normal to the interface reaches the maximum value, 9.785 GPa, at the strain of 26%, where the tensile stress parallel to the interface is 7.176 GPa in the stress–strain curve of figure 3. Then just after this strain, the spontaneous failure occurs with catastrophic energy release in the energy–strain curve in figure 2. At the maximum stress point, the accumulated strain energy as 13.285 eV already exceeds the final energy state of fractured surfaces of about 10.95 eV, and thus the failure occurs as an exothermic reaction just after the maximum stress point. This kind of failure is usually observed in FPCTTs of pure GBs in various materials.
For the 50-atom cell, the stress–strain curve in figure 3 is rather similar to that of the 70-atom cell, while each stress component is a little bit smaller and the maximum stress point is a little bit smaller as 24% than 26% for the 70-atom cell. The maximum tensile stress normal to the interface is 9.07 GPa, where the stress parallel to the interface is 6.81 GPa. The energy-strain curve for the 50-atom cell shows quite different features in figure 2. The accumulated strain energy at 24% or 26% does not yet reach the level of the final energy state of fractured surfaces. Thus no spontaneous failure occurs, and successive tensile straining, namely successive work has to be added as a slow endothermic procedure, until reaching the converged energy state of fractured surfaces in figure 2. The final energy state is the same as that of the 70-atom cell. After the maximum stress point in figure 3, the stresses are greatly decreased, while the decreases are rather gradual, compared to the 70-atom cell. The 50-atom cell is greatly softened and easily stretched in this regime. All these features of the 50-atom cell are quite similar to the results by QMAS in [19].
Here we name the failure mode of the 70-atom cell as an exothermic reaction with catastrophic energy release, Type A, and the failure mode of the 50-atom cell as an endothermic reaction without any energy release, Type B. The occurrence of the Type-B failure should be caused by the thin bulk-region size in the 50-atom cell. The accumulated strain energy in one bulk slab can be regarded to be used to create fracture surfaces for one GB in a repeated supercell normal to the interface. The accumulated strain energy should be nearly proportional to the bulk-region thickness for the same strain. Figure 4 shows the ratio of the energy increases of the two GB supercells in figure 2. Until the failure, the ratio is nearly 1.4, similarly to the ratio of the bulk slab thickness, 7:5. However, the ratio is a little larger than 1.4. This point is concerned with the result that the stress value of the 70-atom cell is a little larger than that of the 50-atom cell at each strain in figure 3. These are caused by a little larger averaged elastic modulus of the 70-atom cell than that of the 50-atom cell, due to a higher ratio of the bulk-like layers with a little higher local elastic modulus than the interface layer.
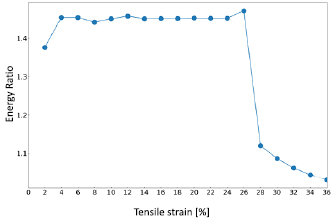
Figure 4. Variation of the ratio of the total-energy increases between the 70-atom and 50-atom supercells for each step of the FPCTT in the energy–strain curves in figure 2.
Download figure:
Standard image High-resolution imageIn all the GB supercells, the failure starts when the applied stress exceeds the common maximum stress, namely the GB strength in figure 3. We call this as the stress condition. Note that the cell strain to satisfy the stress condition is almost the same in both the GB supercells, because of thin GB regions in the present case. However, the strain to satisfy the Griffith condition (energy condition), namely the condition that the accumulated strain energy exceeds the necessary fracture energy (work of separation), remarkably depends on the bulk-region size as shown in figures 2 and 4. The occurrence of Type A or Type B is determined by the relation between the strains to satisfy the energy and stress conditions, respectively. For a GB supercell with thin bulk regions, even after the strain to satisfy the stress condition, the Griffith condition is possibly not yet satisfied in the energy-strain curve, leading to the failure of Type B.
As another factor for the occurrence of Type B, the work of separation (required fracture energy) is quite high for the present configuration of the {0 0 1}  5 twist GB in Al. This corresponds to the final energy state in the energy-strain curve in figure 2, which is common in both the 50-atom and 70-atom cells. In this manuscript, the term, work of separation, means the necessary energy in creating the final fracture surfaces for the GB configuration during the FPCTT. This is not the required one in ideal cleavage into the most stable (0 0 1) flat surfaces, nor the peak energy value just before the failure of Type A in figure 2. As analyzed in [19], the failure process of the Al {0 0 1}
  5 twist GB in the FPCTT is complicated. In the two interface layers facing each other, one atom per CSL cell in each interface layer is attracted and transferred toward the counter interface layer to each other, during the failure process, resulting in atomically rough (0 0 1) surfaces with quite high surface energies. This is caused by local strong reconstructed bonds at the interface, due to the covalent nature of Al–Al bonds. From the energy-strain curve in figure 2, a half of the work of separation (fracture energy) is 5.459 eV/CSL cell (0.134 eV
  = 2.154 J m
 ) as the final energy state of one surface against the initial state of a GB. On the other hand, the surface energy of the final relaxed fractured surface is 5.904 eV/CSL (0.145 eV
  = 2.329 J m
 ) against the bulk crystal, which is obtained by adding a half of the GB excess energy listed in table 1 in [26] to the above value. This final surface energy is twice as large as the energy of a simple flat (0 0 1) surface of Al as 0.94 J m
 in [41], for example. This is because of atomistic roughness of the fractured surface. In our recent FPCTT of the {2 2 1}
  9 tilt GB in Al [20], a half of the work of separation for this tilt GB is 2.130 eV/CSL cell (0.087 eV
  = 1.401 J m
 ). Similarly, the surface energy of the final fractured (2 2 1) surface is 2.480 eV/CSL (0.101 eV
  = 1.631 J m
 ) against the bulk crystal by adding the value from [26]. This value is in the range of usual Al surface energies [20], and is much smaller than that of the {0 0 1}
  5 twist GB. It can be said that the present configuration of the {0 0 1}
  5 twist GB in Al requires quite large work of separation (fracture energy), due to the formation of atomically rough surfaces, compared to the {2 2 1}
  9 tilt GB, while the maximum tensile stress, namely the strength of the
  5 twist GB, about 9.8 GPa, is only a little larger than that of the {2 2 1}
  9 tilt GB, about 8.5 GPa. These points should cause the easy occurrence of the Type-B failure for the Al {0 0 1}
  5 twist GB.
3.2. Factors to decide the failure mode
Here we consider three factors in FPCTTs of GBs; the accumulated strain energy, the work of separation, and the GB strength. The relation among the three factors and their dependence on the bulk-region size should dominate the failure mode. We deal with a GB supercell consisting of alternate stacking of bulk slabs with a thickness of  , where we assume that the elastic modulus
  is uniform in a supercell, namely constant in both the interface and bulk regions, and also constant during the tensile procedure, leading to a straight line as
  for the strain
  in the stress–strain curve. Of course, rigorously the elastic modulus is not uniform in the GB supercell as discussed in section 3.1, and such an elastic (linear) regime is only limited for small strains, while the present simple model can describe the essential features as will be shown. In the present model, the strain energy per interface is the integration of the force
  multiplied by
  until the strain
  , where
  is a cross section of the supercell. The resultant strain energy
  is expressed as
The work of separation, namely the required energy for creating fracture surfaces in a GB, is expressed by  , which is regarded to be already normalized by surface area
  here. This is the energy of the final state after the failure against the initial GB state in the energy-strain curve in figure 2, common in both Types A and B. The strain
  to satisfy the Griffith condition, namely the condition that the strain energy exceeds the work of separation as
  is expressed as follows:
For given values of  and
and  , the strain to satisfy the Griffith condition is inverse square-root proportional to the bulk-region size
  in equation (2). Here we also assume that the GB strength, namely the maximum sustained stress
  is common for the GB supercells of the same GB independent of a bulk-region size. This leads to the common critical strain
  to generate
  within the elastic (linear) model,
  , independent of
  as follows:
In this way,  depends on
  , while
  does not.
Figure 5 shows the plots of equations (2) and (3) as a function of a bulk-region size  for given
  ,
,  and
and  . The vertical axis means the strain
  . The plot of equation (2) is a downward-convex curve, indicating that the necessary strain for the Griffith condition
  becomes larger for smaller
  , while the plot of equation (3) is a horizontal line, showing the constant critical strain
  to generate the maximum stress
  , independent of
  . The cross point of the two plots leads to the critical bulk-region size
  from the condition,
  as
as
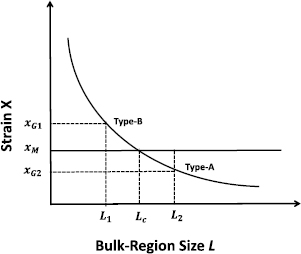
Figure 5. Schematic diagram showing a necessary strain  to satisfy the Griffith condition and a necessary strain
  to satisfy the stress condition during a FPCTT as functions of a bulk-region size
  in a GB supercell. The former condition is described by a downward-convex curve according to equation (2), and the latter condition is described by a horizontal line according to equation (3). The cross point of the curve and line indicates the critical size
  in the horizontal axis. For
  leading to
  , the GB supercell shows Type-A failure, and for
  , leading to
  , the GB supercell shows Type-B failure.
Download figure:
Standard image High-resolution imageThis divides the region of  in the horizontal axis into the areas of Types A and B. A GB supercell with the bulk-region size of
  has
has  , showing a failure of Type B, where the strain
  in the FPCTT reaches the stress condition before the Griffith condition, as the present 50-atom cell. On the other hand, a GB supercell with a bulk-region size of
  has
has  , showing a failure of Type A, where the strain
  in the FPCTT reaches the Griffith condition before the stress condition, as the present 70-atom cell. In this way, the critical size
  should exist between the 50-atom and 70-atom cells for the present twist GB in Al.
The diagram in figure 5 depends on the GB strength  and the work of separation (fracture energy)
  . The smaller
  leads to the downward shift of the line of equation (3), which moves the cross point
  to the right, resulting in a wider region of
  for Type B. The lower
  leads to the downward shift of the curve of equation (2), which moves the cross point
  to the left, resulting in a wider region of
  for Type A. All these are consistent with the form of equation (4).
Strictly speaking, the strain energy should be deviated from the simple elastic-energy descriptions as equations (1)–(3) for larger strains. For example, as shown in figure 3, the stress is lower than the linear value except for small  . Thus the shape of the curve of equation (2) in figure 5 should be changed to the upper direction for larger
  or smaller
  , while the essential feature of a downward-convex curve of equation (2) should not be changed. And for the line of equation (3), the coefficient to determine
  from
from  may be changed for larger
  . However, the above behavior of
  in equation (4) does not seem to be seriously changed, at least qualitatively.
3.3. Reinterpretation of previous FPCTT results of impurity-segregated Al GBs
As discussed above, figure 5 shows the relation between the bulk-region size  and the necessary strains for the stress and Griffith conditions,
  and
and  , deciding the failure mode for given
  . Moreover, we can consider the failure-mode change for fixed
  by the shifts of the line and curve of equations (3) and (2) due to the changes of
  and
and  . This is possible for the impurity segregation in the same GB supercell. Indeed, failure-mode changes were observed in the previous FPCTTs of the Al {1 2 2}
  9 tilt GB with segregation of various
  elements [8–10]. In these works, the common GB supercell with fixed
  was dealt with, while different segregated species induced different failure modes, perhaps according to the change of
  and
and  by each impurity species. In this subsection, the previous FPCTT results are reinterpreted from the present viewpoint of the shifts of the curve and line of equations (2) and (3) in figure 5.
From [8, 9], the supercell of the clean {1 2 2}  9 GB in Al shows usual Type-A failure with
  larger than
  for the given
  as expressed by black lines in figure 6. However, the same GB supercell with Ca segregation and that with Na segregation show Type-B failure in the FPCTTs in spite of the same
  . In the energy–strain and stress–strain curves [8, 9] (private communication), the GB strength
  for the Al
  9 GB with Ca is reduced by about 13% than the clean GB, while the work of separation
  is not changed. For the Al
  9 GB with Na,
  is much lower by about 50% than the clean GB, and
  is also much reduced by about 60% (as about 40%). Figure 6 explains the occurrence of Type-B failure for the segregation of Ca and Na by the shifts of the lines of equations (2) and (3) for the fixed
  . For the Ca-segregation, the curve of equation (2) is not changed from that of the clean GB as described in black, due to no change of
  , while the line of equation (3) is shifted downward a little as described in blue, due to the decrease of
  . For the clean GB (black line in figure 6), the bulk-region size
  should be located near the critical point
  and in the right-hand side of it. Then for the Ca-segregation, the downward shift of the line of equation (3) moves
  to the right of
  as indicated by
  in blue, leading to the Type-B relation for
  as
as  smaller than
  in figure 6. For the Na-segregation, both the line of equation (3) and the curve of equation (2) are greatly shifted downward as described in red, compared to the clean GB. Due to the linear and square-root dependences of equations (3) and (2) on
  and
and  , respectively, the shift of the line of equation (3) should be larger than that of equation (2), which also moves
  to the right of
  as indicated by
  in red, leading to the Type-B relation for
  as
as  smaller than
  as shown in figure 6. In both the Ca-segregation and Na-segregation cases, the effect of the downward shift of the line of equation (3) is more significant, leading to Type-B failure.

Figure 6. Schematic diagram showing failure-mode changes by impurity segregation at {1 2 2}  9 GB in Al. Impurity-induced changes in the work of separation
  and the GB strength
  lead to the shifts of the downward-convex curve (equation (2)) and the horizontal line (equation (3)), compared to the clean GB with the same GB supercell. This leads to the shift of
  , namely the change of the region of
  for Type-A or Type-B failure in the horizontal axis, resulting in failure-mode changes even for fixed
  . Black, blue, red and green lines represent the lines of equations (2) and (3) for the clean GB, the GB with Ca segregation, that with Na segregation, and that with Na and Si co-segregation, respectively, according to the results in [8, 9]. Note that the plots show only qualitative features.
Download figure:
Standard image High-resolution imageIn [9], the stress–strain and energy–strain curves of the same Al GB with co-segregation of Na and Si show that  is reduced by about 20% than the clean GB, and that
  is much smaller as about 35% (reduced by about 65%) than that of the clean GB, leading to Type-A failure similar to the clean GB, in contrast to Type-B failure for the Ca-segregation and Na-segregation cases. The reason is explained by green lines in figure 6. The line of equation (3) is a little lower than that of the Ca segregation expressed in blue, while the curve of equation (2) is also a little lower than that of the Na segregation expressed in red. The latter change is more significant, which moves
  to the left as expressed in green, keeping the Type-A failure for the fixed
  . In [10], S segregation in the same Al GB greatly reduces
  , while the reduction of
  is not so significant, similarly to the case of co-segregation of Na and Si. Thus the Type-A failure of this case [10] can be understood from the viewpoint of figure 6.
The present analysis has clarified that the failure mode observed in a FPCTT of a GB seriously depends on the bulk-region size  . The critical bulk-region size
  to decide the ranges of
  for the two types of failure modes is dominated by
  ,
,  and
and  . These three quantities should be associated with a configuration of a clean CSL GB as intrinsic quantities, and can be examined by a FPCTT for a given
  . As examined above, the impurity segregation can change the quantities of
  and
and  , possibly leading to a different failure mode from that of a clean GB, even with the same
  . As mentioned in section 3.2, the present argument is based on the analytical model of elastic energy and stress. The deviation from the elastic expression should lead to the change of the curve shape of equation (2) and some shift of the line of equation (3), while this does not seem to change the essential relation between the downward-convex curve and straight line in figures 5 and 6 as discussed above. On the other hand, the assumption of the uniformity of
  within a GB supercell may cause some problems in the cases of small values of
  or impurity segregation cases, where the difference in
  at GB regions may be enhanced. In the near future, it may be possible to incorporate such local changes of
  into the above analytical model, while the total effect does not seem to be so serious. Of course, too thin bulk regions should not be used in a FPCTT, because the bulk-like electronic structure or bonding is not well reproduced in such thin bulk regions, which can be examined by using our local-energy and local-stress schemes [26].
3.4. Application of local-energy and local-stress schemes
Experimentally, failure initiates at some weakest GB in a polycrystalline sample, and the grain size in a sample does not necessarily affect the failure mode, differently from FPCTTs, because the strain energy accumulated in the whole polycrystalline body can be used for creating failure surfaces at the weakest GB, resulting in Type-A failure usually. This indicates a serious question on the physical reality or real occurrence of Type-B failure in usual experiments of polycrystals. In Type-B failure, after the maximum-stress point, extremely large bond stretching seems to occur in back-bond and bulk regions, so that the total strain energy in small bulk regions reaches the work of separation. Such extreme degrees of deformation in a bulk region should become more significant for a smaller bulk-region size. This phenomenon does not seem to occur in usual experiments, except for some special nanoscale systems such as contacting nanoparticles or nanorods [42]. In other words, the atomic and electronic behaviors in Type-B failure in a FPCTT, at least, those after the maximum-stress point, cannot be regarded as general phenomena, and cannot be used as ab initio data for meso- or macroscopic simulations of usual polycrystal samples [18]. For this purpose, it is desirable to use FPCTT results of Type-A failure, at least. We should be aware of the distinction of the failure mode in a FPCTT, dominated by the three quantities and the bulk-region size, as analyzed in the present study for the first time.
Here we discuss the applicability of the local-energy and local-stress schemes to extract the local deformation and failure behaviors from the FPCTT results of Type-A failure of a GB, as suitable forms to be combined with meso- or macroscopic simulations. Figure 7 shows the variations of local-energy and local-stress (diagonal sum) values of each symmetrically-independent atom in the 70-atom GB supercell during the FPCTT showing Type-A failure. As shown in figure 1, the atoms Nos. 17 and 20 belong to the interface layer, Nos. 11 and 12 belong to the second (back) layer from the interface, Nos. 6 and 10 belong to the third layer from the interface, and Nos. 1 and 5 belong to the central bulk layer. In figure 7, the atoms on the interface layer, Nos. 17 and 20, mainly show remarkable variations of local energies and local stresses. In the early stage of the cell strain, the local energy and local stress are quite high at the interface atom No. 20, and in the late stage after around 13%, the interface atom No. 17 shows rapid increases of the local energy and local stress, becoming larger than those of No. 20, while at the final stage, the local energy and stress at No. 20 become large again, associated with the transfer of this atom toward the counter interface layer. Figure 8 shows the variations of the sum or average of local energies and local stresses of each layer. In the energy variation, initially the interface and second layers show increases, while after 13% only the interface layer shows a remarkable increase, in contrast to a gradual decrease in the second layer. It is interesting that the mid layer in the bulk region shows a rather constant energy increase until the failure.
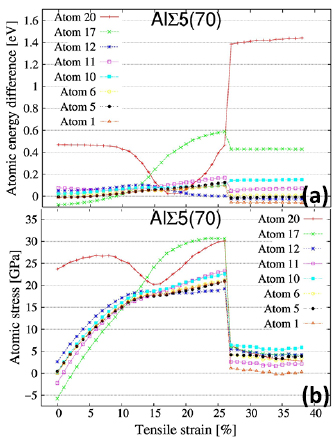
Figure 7. Variations of (a) local energies and (b) local stresses (diagonal sums) of symmetrically-independent atoms in the 70-atom supercell of the {0 0 1}  5 twist GB in Al during the FPCTT. The atomic energies are defined against the total energy of bulk fcc Al per atom. At each tensile strain, the sum of these atomic energies for the half of the supercell corresponds to the total energy in figure 2 with the initial GB energy. The volume average of the atomic stresses for the supercell corresponds to the sum of the three components of the cell-averaged stress in figure 3. Even in the initial configuration before the FPCTT, there are variations of atomic energies and stresses due to local structural disorder as analyzed in [26], while the atoms on the central bulk layer (Nos. 1 and 5) naturally show negligible values.
Download figure:
Standard image High-resolution image
Figure 8. Variations of (a) local energies and (b) local stresses (diagonal sums) of {0 0 1} atomic layers in the 70-atom supercell of the {0 0 1}  5 twist GB in Al during the FPCTT. The local energy of each layer is a simple sum of those of constituent atoms, while the local stress of each layer is a volume-average of those of constituent atoms. Layers 1 and 4 mean the interface and central-bulk layers, respectively.
Download figure:
Standard image High-resolution imageAbout the initial interface configuration [19, 28] shown in figure 1(b), the atoms of Nos. 20 and 21 are located on the four-fold symmetry sites. We call these atoms Type I. The atom of No. 20 on the lower interface layer neighbors the four atoms of Nos. 22–25 on the upper interface layer, while the atom of No. 21 on the upper interface layer neighbors the four atoms of Nos. 16–19 on the lower interface layer. We call the atoms of Nos. 16–19 and Nos. 22–25 Type II. Each Type I atom on the interface layer has twelve neighbors; four Type II atoms on the counter interface layer, four on the same (0 0 1) layer and four as the back bonds. Each Type-II atom on the interface layer has two neighbor atoms on the counter interface layer, one Type-I atom and one nearest Type-II atom. Thus each Type-II atom has ten neighbors.
Figure 9 shows bond-length changes around Type-II (No. 17) and Type-I (No. 20) interface atoms during the FPCTT. In the early stage till around 13%, the back bonds as No. 17–No. 15 and No. 20–No. 14 bonds at the interlayer between the interface and second layers are mainly stretched, while in the late stage after around 13%, the interfacial bonds between Type-II atoms (Nos. 17–25 bond) and the back bonds of a Type-I atom (Nos. 20–14 bond) are greatly stretched and broken. These features are consistent with the variations of the local energy and local stress of each atom and layer in figures 7 and 8. In the early stage, the local energies and local stresses of Type-I interface atoms (No. 20) and the atoms on the second layer (Nos. 11 and 12) are mainly increased, while in the late stage, Type-II interface atoms (No. 17) show remarkable increases of local energies and local stresses, until breaking of the interfacial bonds between Type-II interface atoms. Just before the failure, Type-I interface atoms also show rapid increases of local energy and local stress, associated with breaking of the back bonds of Type-I interface atoms due to the transfer to the counter interface layer.

Figure 9. Variations of bond lengths around Type-I (No. 20) and Type-II (No. 17) interface atoms in the {0 0 1}  5 twist GB in Al during the FPCTT. No. 20–14 and No. 17–15 bonds are back bonds of the interface atoms. No. 17–21 (No. 20–22) bonds are interfacial bonds between Type-I and Type-II interface atoms. No. 17–25 bond is an interfacial bond between Type-II interface atoms. No. 17–16 bond is an in-plane bond on the interface layer between Type-II interface atoms. No. 17–20 bond is an in-plane bond on the interface layer between Type-I and Type-II interface atoms.
Download figure:
Standard image High-resolution image
From the present analysis, it is clear that the atoms on the interface and second layers dominate the failure behavior, which is similar to the 50-atom supercell in [19]. From the viewpoint of extracting energy-traction relation for continuum fracture mechanics such as a CZM or RGS model [21–24] as mentioned in section 1, we propose the usage of the variation curve of a local energy of each layer as  , where
  means the layer index from the interface and
  means the strain. We can assume
  for
for  as extension for wider regions on both sides of a GB. About the variable
  , it may be better to use a quantity like a local strain or a local interlayer-distance change, instead of cell strain. If we obtain similar layer-energy functions to represent local-energy variations during the FPCTT for various CSL GBs via our local-energy scheme, we can embed such functions in each GB region with proper connection to macroscopic regions, which should open a new way of multi-scale simulations. In the practical application, it should be necessary to make further examination and consideration. The introduction of the response for shear deformation might be necessary. Of course, there may exist other effective ways of utilizing the local-energy and local-stress scheme in such multi-scale simulations. We would like to emphasize that our local-energy and local-stress scheme should be powerful tools to fully utilize rich information in FPCTTs or FPCSTs in meso or macroscopic mechanics simulations of practical polycrystalline materials.
4. Summary
We have examined the effects of the bulk-region size in a GB supercell on the failure mode in a FPCTT by using a twist CSL GB in Al. In usual FPCTTs at zero temperature without effects of kinetic or vibrational behaviors of atoms, the stress-strain curve until the maximum point and the value of the maximum stress are not so dependent on the bulk-region size. However, the Griffith condition that the accumulated strain energy in the bulk region exceeds the work of separation, is possibly not yet satisfied even at the maximum-stress point for a thin bulk-region size, which leads to Type-B failure as a gradual endothermic process with the strain energy increasing and converging to the final fractured surface state, in contrast to usual Type-A failure as a catastrophic exothermic fracture just after the maximum-stress point. We have analyzed the dominant factors of the failure mode as the accumulated strain energy depending on the bulk-region size, the work of separation, and the GB strength, namely the maximum sustained stress. By simple model equations, we have shown that the Type-B failure occurs for a bulk-region size smaller than some critical size, which becomes larger for larger work of separation or lower GB strength. From this viewpoint, the failure-mode changes in the previous FPCTTs of a tilt CSL GB in Al with GB segregation of various  impurities, in spite of the same bulk-region size, can be explained by the changes of the work of separation or the GB strength by impurities. To extract the local deformation and failure features in a FPCTT of a GB for the combination with meso- or macroscopic simulations, it is better to deal with Type-A failure, because experimentally Type-B failure seems to be limited to special nano-systems. For this purpose, the application of recently-developed ab initio local-energy and local-stress schemes is quite promising. We have shown the application to the FPCTT of the present twist GB in Al.
Acknowledgment
This study was supported by MEXT as a social and scientific priority issue (Creation of new functional devices and high-performance materials to support next-generation industries; CDMSI) to be tackled by using post-K computer. Computations were performed on the SR16000 supercomputer of Institute for Materials Research, Tohoku University. The authors greatly thank Professor Yoshinori Shiihara, Dr Shoji Ishibashi, and Dr Somesh Kr Bhattacharya for valuable information and discussion.