

Abstract
In order to make a new approach to the elucidation of the microscopic mechanisms of multiferroicity in the RMn2O5 family, experiments with different methods of polarized neutrons scattering were performed on a TbMn2O5 single crystal. We employed three different techniques of polarized neutron diffraction without the analysis after scattering, the XYZ-polarization analysis, and technique of spherical neutron polarimetry (SNP). Measurements with SNP were undertaken both with and without external electric field. A characteristic difference in the population of 'right' and 'left' helix domains in all magnetically ordered phases of TbMn2O5, was observed. This difference can be controlled by an external electric field in the field-cooled mode. The analysis of the results gives an evidence that antisymmetric Dzyaloshinsky-Moria exchange is effective in all the magnetic phases in TbMn2O5.
Export citation and abstract BibTeX RIS
Introduction
Being now one of the most interesting challenges in the condensed matter physics, the magnetic multiferroicity at the same time is promising for potential application in functional devices. Manganite compound TbMn2O5 belongs to the magnetic multiferroic family RMn2O5 (R—rare-earth element), which demonstrates, probably, the most interesting and close interrelations between magnetism and ferroelectricity. The intensive investigations of the family have been recently in progress in order to elucidate the microscopic mechanisms leading to such remarkable magneto-electric properties. Notwithstanding on the great amount of the experimental and theoretical work devoted to RMn2O5 (see e.g. [1, 2] and references therein) the mechanisms of ferroelectricity in this family are still not obvious.
It is generally accepted that all the members of the RMn2O5 family crystallize in an orthorhombic structure with Pbam space group (#55 Int. tables [3]) which consists of octahedra Mn4+O6 edge-shared along the c axis and pairs of tetragonal pyramids Mn3+O5 linking with two Mn4+O6 chains [4] (figure 1).
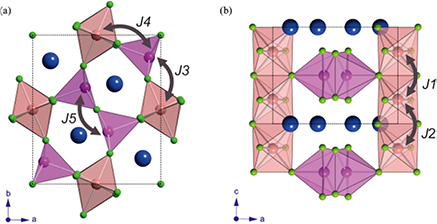
Figure 1. Crystal structure RMn2O5: (a)—projection on ab plane; (b)—projection on ac plane. Blue large balls—R3+ ions, rose midsize balls—Mn3+, orange midsize balls—Mn4+, green small balls—O2−. Double sided arrows indicate the different exchange interactions.
Download figure:
Standard image High-resolution imageThe particularities of the crystal structure lead to an essential exchange competition, which results in noncollinear magnetic structures and complex magnetic phases [5]. Five exchange interactions between the nearest neighbors are usually in consideration (see figure 1): J3, J4, J5, acting in ab plane and J1, J2, acting along c-axis.
The magnetic structure of multiferroics RMn2O5 is characterized by the temperature evolution of the propagation vector of type k = (½ − δx, 0, ¼ + δz), where δx varies from 0.012 to 0.028 and δz—from 0.013 to 0.027 depending on R and the temperature [1, 2]. TbMn2O5 exhibits the following series of the magnetic phase transitions: from paramagnetic to high-temperature incommensurate phase (HTIC) at TN ~ 43 K, then follows the transition to commensurate magnetic phase (CM) at TC1 ~ 33–37 K with a near collinear spin order, and then a reentrant transition into low-temperature incommensurate phase (LTIC) occurs at TC2 ~ 22–28 K [4–6]. In HTIC phase the propagation vector has the value k = (0.488 0 kz) with kz changing from 0.28 to 0.27 depending on the temperature, at CM phase k = (0.5 0 0.25), and at LTIC phase k = (0.492 0 0.312) [7]. The variation of TC1 and TC2 values depends not only on the conditions of sample preparations, but also on the temperature pre-history of a sample—whether observations were done in the 'heating' or 'cooling' regimes [7].
In the paramagnetic phase, TbMn2O5 is paraelectric though a possibility of the weak ferroelectricity in the paramagnetic phase was recently pointed out [8]. According to [2], the HTIC phase in TbMn2O5 is paraelectric at the temperatures down to about 38 K and weak ferroelectric (WFE) below 38 K. The CM phase is ferroelectric (FE), as well as LTIC phase, but it is important to note that the value of the electric polarization in CM is much higher than that in LTIC, so the latter one is recognized as WFE phase.
One should examine two different theoretical approaches for the consideration of the basic mechanism, ensuring the spin-driven ferroelectricity in RMn2O5. The exchange striction model is considered more often, according to which the electrical polarization arises due to the symmetric exchange interaction [9, 10]. In this case, the electrical polarization is proportional to the scalar product of the adjacent spins Pe ~ [Si · Sj]. This mechanism refers to the collinear spin orders where the symmetric exchange striction forces the two nearest ions with parallel spins to move closer to each other while those with antiparallel spins—to move away from each other. Thus, the displacement of the transition metal ions procure shift of O2− ions through which these metal ions coupled, which in turn lead to the net polarizations Pe.
Another model implies the Dzyaloshinsky-Moriya interaction (DMI) as the origin of the polarization. In this case, the polarization is proportional to the vector product of the adjacent spins Pe ~ [Si × Sj] [11, 12]. The consideration shows that an antisymmetric exchange in the helically ordered spin system leads to the possibility of small displacements of O2− ions, which enhance the DMI exchange interaction [11, 12]. The chirality of the helical spin order specifies the direction of the ligand O2− ion shifts and for the helices with one chirality all ligands shift in the same direction, asserting electric polarization, which is perpendicular to the helix propagation.
An antisymmetric exchange associated with a rather weak spin–orbit coupling, and this is the main reason why the exchange striction model is considered to be more applicable. Nevertheless, from another point of view, the competition of the superexchange interactions J1–J5 leads the spin structure to be highly frustrated [10], so a weak interaction could influence the magnetic properties considerably and subsequently also on the electric properties of such system. This is possibly the reason why not all the experimental facts on RMn2O5 family could be explained within the exchange striction model. It was shown e.g. that the essential magneto-electric features in YMn2O5 at least in LTIC phase governed by magnetic chirality [13].
We performed our investigations to elucidate the possible relation of DMI with magnetic properties of TbMn2O5. The multiple magnetic ordered phases and ferroelectric ones imply an elaborate coupling mechanism in this system, so it is natural to suggest that several mechanisms could be responsible for such a complicated magneto-electrical behavior.
Experimental details
A TbMn2O5 single crystal was grown by the spontaneous crystallization technique described in [14]. The crystal had parallelepiped-like shape with the dimensions of ~4 × 4 × 4 mm3 with the c-plane lying parallel to one of the crystal faces, and a and b axes are directed along the diagonals of this face. The quality of the single crystal sample has been checked by the x-ray phase analysis and confirmed to be a single phase of the high purity.
We have dealt with three methods of the polarized neutron scattering. The polarized neutron diffraction investigations without the polarization analysis and with the XYZ-polarization analysis were performed on the polarized neutron spectrometer with inverse scattering geometry at the WWR-M reactor (Petersburg Nuclear Physics Institute, Gatchina) [15]. On this instrument the neutron beam monochromatization is performed after neutron scattering from the sample. The polarization of the incident neutron beam made by a high efficiency neutron guide on the base of Fe–Co supermirrors. For the first mode of measurements—polarized neutron diffraction without polarization analysis (PND)—PG (pyrolytic graphite) crystal was used as a monochromator and the working wavelength was 2.08 Å. For the XYZ-polarization analysis, a Heusler crystal CuMn2Al was utilized as an analyzer of the polarization and a monochromator simultaneously and the neutron wavelength was 2.14 Å. The sample was placed in an 'orange' ILL-type cryostat during the experiments and the measurements were performed in the 'warming' mode after cooling the sample to the lowest possible temperature of 1.5 K.
The measurements, which employed the technique of Spherical Neutron Polarimetry (SNP), were performed on the diffractometer POLI at FRM-II reactor (Heinz Maier-Leibnitz Zentrum, Garching) [16] at wavelengths 1.14 Å and 0.7 Å. The unique feature of the POLI is that we can use both the neutron polarization and analysis with 3He spin filters. Such configuration is very efficient for the short wavelength neutrons from the point of view of a better resolution and a high flux of the polarized neutrons on the sample position. From another side, the time dependence of the polarizing (analyzing) efficiency of the filters represents a main drawback of the technique, since the precise knowledge of the incoming and scattered beam polarization is essential for the SNP. This requires some additional corrections, which lead to a decrease of the statistical accuracy of the measurement. The corrections, however, were successfully made according to the calculations described in [17]. The technique of SNP was implemented using the third generation zero-field cryogenic polarization analysis device (CRYOPAD) [18].
For the measurements with an electrical field, the sample was mounted between the electrodes built of aluminum plates and nylon screws. The electrical field was applied along b-axis. The sample was cooled with a standard FRM-II type top-loading closed-cycle refrigerator. The essentials of the measurements with high electric fields in the cryogenic environments consist in fine-tuning the pressure of helium exchange gas continuously on a thin line where it is possible to apply several kV mm−1 without an electric breakdown maintaining the necessary temperature of the sample at the same time. A reliable setup for the in situ pressure control and regulation within a cryostat has been developed and calibrated before the experiment was started. The technical details and calibration curves will be published elsewhere.
For the convenience of the polarization analysis in all experiments we employed the coordinate system in which the instrumental x-direction coincides with the scattering vector q, y-direction lays in the scattering plane and is perpendicular to x, and z-axis is directed vertically forming the right-handed Cartesian system. The crystal orientation was chosen as follows: b-axis was oriented vertically, a and c axes lying in a horizontal scattering plane. This arrangement allows the measurement of the reflections with the indices of the type q = (qx 0 qz).
Experimental results
Polarized neutron diffraction without analysis (PND)
The intensity of the polarized neutrons, scattered in the helix satellite is described as [19]:
where q—scattering vector, e = q/ǀqǀ, P—vector of neutron polarization, nr—portion of 'right' helices in crystal, nl = 1 − nr is a portion of 'left' helices, τ—reciprocal lattice vector, k—helix propagation vector.
We consider the magnetic order in a crystal as the helix structure, which can be described by the expression

where  —unit vectors, orthogonal each other,
 —corresponding amplitudes, rn—a cell position, helix vector
 ![$\boldsymbol{m}=\left[\boldsymbol{u}\times \boldsymbol{v} \right]$](https://content.cld.iop.org/journals/0953-8984/30/20/205804/revision2/cmaabdf6ieqn004.gif) .
.
The experiments were carried out at three temperatures, which correspond to three different magnetically ordered phases: 1.5 K (LTIC), 30 K (CM) and 38 K (HTIC). For space group Pbam symmetry operations, the propagation vector k = (kx 0 kz) provides two magnetic configuration domains characterized by the vectors k1 = (kx 0 kz) and k2 = (kx 0 − kz). Correspondingly, there are two pairs of magnetic satellites centered by one nuclear Bragg peak. Scans of some magnetic satellites of type (h 0 l) ± k1,2 were performed.
During the measurements the polarization of the incident neutrons was oriented parallel (↑↑) or antiparallel (↑↓) to the scattering vector q. In this case, the difference between scattered intensities for P↑↑q and P↑ ↓ q will be proportional to the difference between the population of domains with the helices of the opposite chiralities. In the experiment for almost all the magnetic reflections noticeable difference between intensities with P↑↑q and P↑ ↓ q is observed. As an example, the results for the scans of satellite (0 0 1) + k2 are presented in figure 2. Here one can see that a relative difference between ↑↑ and ↑ ↓ intensities is higher for low temperature—at LTIC phase—and is smaller at CP and HTIC phases. We attribute this difference to the fact that because of the resolution effect, we cannot observe the satellite scattering from only one configuration domain, but some tail from the satellite of another domain (which can have another chirality) always gives an admixture to the first one, the neighboring satellites intensity distribution is shown on figure 3.

Figure 2. Scans of (0 0 1) + k2 satellite along l-direction at the temperatures 1.5 K (LTIC), 30 K (CM), 38 K (HTIC) with neutron polarization parallel and antiparallel to the scattering vector q. h fixed to 0.492 for 1.5 K, 0.5 for 30 K, 0.488 for 38 K.
Download figure:
Standard image High-resolution image
Figure 3. Intensity maps of the neighboring satellites at 4 K: (a) satellites (0 0 1) + k2 and (1 0 1) − k1 (positions 0.492 0 0.688 and 0.508 0 0.688 correspondingly); (b) satellites (1 0 0) + k1 and (2 0 0) + k2 (positions 1.492 0 0.312 and 1.508 0 0.312 correspondingly).
Download figure:
Standard image High-resolution imageAt a low temperature, the intensity of the magnetic scattering is rather large and the effect of such an admixture is not so significant. At HTIC intensity of the magnetic scattering is not so large, thus an admixture of the scattering from the neighboring satellite gives a noticeable contribution. The same situation takes place at CP phase, where satellites from the configuration domains overlap completely. In the data treatment appropriate corrections for that were made. These results allow us to estimate the ratio between the domains with the 'right' and 'left' helices as 0.70(3):0.30(3)—in the configurational domain k2, and to conclude that that this difference remains similar for all the studied temperatures. Here we cannot define the true handedness of the chirality, thus our 'right' and 'left' definitions are rather arbitrary.
XYZ-polarization analysis
The measurements were performed at three temperatures—16 K (LTIC), 30 K (CM), 38 K (HTIC)—for some magnetic satellites of the type (h 0 l) ± k1,2 much like in the previous section. For all of them the measurements of the polarized neutron scattering intensities with the spin-flip (ISF) and non-spin-flip (INSF) for three orthogonal directions Px, Py, Pz of the incident neutron polarization were performed. It should be mentioned that ISF/INSF ratios for 1.5 K are exactly the same as for 16 K. In figure 4 the scans of (1 0 0) + k1 satellite in different magnetic phases are shown. The scans were made along l-direction while h index was fixed to 1.492 for 16 K, 1.5 for 30 K and 1.488 for 38 K, respectively. It is clearly seen that the peaks at T = 16 K are slightly asymmetric in the shape—the sequence of the resolution effects in the combination with overlapping from tails of (2 0 0) − k2 satellite. The ratios between ISF and INSF intensities are different for these adjacent reflections because they correspond to the satellites emerging from different configuration domains. In the treatment procedure, the necessary corrections were made in order to separate contributions from the adjacent satellites in the measured reflections.
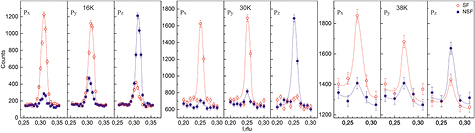
Figure 4. Scans of (1 0 0) + k1 satellite along l-direction with XYZ polarization analysis at 16 K, 30 K, 38 K. Px, Py, Pz symbols at left upper corner of each panel indicate the incident polarization direction at which measurements were made.
Download figure:
Standard image High-resolution imageThe results of our measurements for the reflections (1 0 0) + k1 and (−1 0 1) − k1 are presented in table 1. These reflections were chosen because for these particular positions the separation between the overlapped reflections from the different configurational domains can be done easier. The positions of the satellites in reciprocal space are different in different magnetic phases—so satellite (1 0) + k1 is positioned at (1.492 0 0.31), (1.5 0 0.25), (1.488 0 0.27) at 16 K, 30 K, 38 K respectively. Positions of satellite (−1 0 1) − k1 at temperatures 16 K, 30 K, 38 K are: (−1.492 0 0.69), (−1.5 0 0.75), (−1.488 0 0.73), respectively. In CP phase reflections corresponding to the two types of the configurational domains overlap completely, thus we have to make some corrections in the process of the calculations. For the sake of convenience, we can put  to be vertical (parallel to the crystal axis b which in turn parallel to z in our notification) and
  to lie in the horizontal ac plane. In this case, the ratios between scattered SF and NSF intensities for different directions of the polarization can be written as follows:
where β—angle between helix vector  and scattering vector q,
  ch⊥ =
ch⊥ =  [
[ ×
×  ]x, B—background.
Table 1. The ratios between ISF and INSF intensities for two magnetic satellites (1 0 0) + k1 and (−1 0 1) − k1 for magnetically ordered phases HTIC, CM, LTIC.
| (1 0 0) + k1 | 16 K (LTIC) | 30 K (CM) | 38 K (HTIC) |
|---|---|---|---|
 |
0.91(2):0.09(1) | 0.93(3):0.07(3) | 0.90(10):0.10(10) |
 |
0.82(1):0.18(1) | 0.84(3):0.16(2) | 0.76(11):0.24(11) |
 |
0.15(1):0.85(1) | 0.11(3):0.89(4) | 0.33(10):0.67(10) |
| (−1 0 1) − k1 | |||
 |
0.95(5):0.05(3) | 0.94(3):0.06(2) | 0.94(5):0.06(4) |
 |
0.37(4):0.63(5) | 0.22(2):0.78(3) | 0.29(5):0.71(5) |
 |
0.62(4):0.38(4) | 0.79(3):0.21(2) | 0.84(5):0.16(5) |
From the ratios, presented in table 1, for each satellite the angle between the helix vector m and scattering vector q and elliptical coefficient R = μu/μv can be extracted.
In this way, we obtain, e.g. β = 82(2)° for (1 0 0) + k1 satellite at 16 K. The consideration of both the reflections in table 1 leads to an angle α = 7(2)° between the magnetic helix plane and crystallographic ab plane. At this temperature R = 3.1(3), and this value corresponds to the tilt angle γ = 18(2)° of some 'average' magnetic ordered moment with respect to axes a.
At 30 K with commensurate propagation vector k = (0.5 0 0.25) the domains are completely overlapped, the corrections for that were also made. Using SF and NSF intensities, shown in table 1, yield angle β = 82(2)°. Since magnetic structure in this phase has another propagation vector we obtain the value α = 4(2)°, which can be regarded to be very close to that one found at 16 K. At the same time, the elliptical parameter R changes to a value of 4.4(3), which means that the 'average' magnetic moment turns closer to a-axes to the angle γ = 13(2)°, and this value coincides with that found at 27 K according to [10].
For 38 K, our XYZ-data give the same value for the angle α = 4(2)° as for 30 K, and almost the same value for the angle γ = 14(2)°. It should be also noted that this change of γ angle probably can be related to the decrease of Tb3+ ordered moment at CP and HTIC phases, rather than turn of the 'average' ordered magnetic moment.
Spherical neutron polarimetry
The experiments with SNP technique were performed at temperatures 14 K (LTIC), 30 K (CM), 38 K (HTIC) with the wavelength 1.14 Å, and at 5 K, 7 K, 30 K, 37 K with the wavelength 0.7 Å. During the experiment, we concentrated on the measurements of only those elements of the (3 × 3) polarization matrix, which are informative in case of incommensurate magnetic structure. Elements of interest in the case of TbMn2O5, are elliptical parameters  and
and  are as well as chirality parameters
  and
and  [20]. Following [21] we can express these terms as:

Some results for the elements of the polarization matrix, measured for the magnetic satellites (1 0 2) − k2, (0 0 − 2) + k2, and (1 0 0) + k1 are presented in table 2.
Table 2. Elements of polarization matrix, measured at 5 K, 30 K and 37 K without applied electrical field for magnetically ordered phases LTIC, CM and HTIC, respectively.
| 5 К (LTIC) | (1 0 2) − k2 | (0 0 − 2) + k2 | (1 0 0) + k1 | ||||||
| x | y | z | x | y | z | x | y | z | |
| x | −1.04(3) | −0.81(7) | −0.87(9) | ||||||
| y | −0.17(1) | 0.84(2) | 0.10(1) | 0.78(2) | 0.08(3) | −0.44(6) | |||
| z | −0.13(1) | −0.82(2) | 0.12(1) | −0.84(3) | 0.09(2) | 0.36(6) | |||
| 30 К (CM) | (1 0 2) − k2 | (0 0 − 2) + k2 | (1 0 0) + k1 | ||||||
| x | y | z | x | y | z | x | y | z | |
| x | −1.00(4) | −1.02(5) | −1.03(2) | ||||||
| y | 0.04(4) | 0.97(4) | 0.03(4) | 1.05(6) | 0.09(4) | −0.75(4) | |||
| z | −0.03(4) | −0.90(5) | 0.04(4) | −1.00(6) | 0.09(4) | 0.70(4) | |||
| 37 К (HTIC) | (1 0 2) − k2 | ||||||||
| x | y | z | |||||||
| x | −0.93(5) | ||||||||
| y | −0.11(6) | 0.96(7) | |||||||
| z | 0.04(2) | −0.92(2) | |||||||
The measurements for different temperatures within LTIC phase (5 K, 7 K and 14 K) give the same results within statistical errors. From table 2 one can see that for all three satellites chiral parameters  and
and  are non-zero for 5 K. They have similar absolute values (within the accuracy of measurements) at the same temperature for different satellites, although it should be noted that it may not necessarily happen.
  and
and  are close to each other in an absolute value for the mirrored reflections originated from the domain with k2: (1 0 2) − k2 and (0 0 −2) + k2 (positioned approximately at (0.51, 0, 2.31) and (0.49, 0, −2.31)). For satellite (1 0 0) + k1, which originates from the domain with k1 parameters
  and
and  could differ from those ones for k2. This difference can take place because of the different helix domain population in two configurational domains, and also because of the different angles between helix vector m and scattering vector q for these satellites. At the same time elliptical parameters
  and
and  are almost the same for the reflections (1 0 2) − k2 and (0 0 − 2) + k2 and have other values for (1 0 0) + k1 only because of the different angles between m and q. For higher temperatures, the chiral parameters do not exceed statistical errors, which are comparatively large because of the low satellite intensities at these temperatures. The elliptic parameters
  and
and  change their values appreciably when coming from for LTIC to CM and HTIC phases. From data in table 2 one can obtain angle α between the magnetic helix plane and crystallographic ab plane, which will be: at 5 K − 3(2)°, at 30 K and 37 K − 5(2)°. Note that these values for the angles are close to those deduced from XYZ measurements. The elliptical coefficient R will be 2.9(1) for 5 K and 9.2(1) for 30 K and 37 K, which yields to a tilt angle of 'average' magnetic moment to be equal γ = 19(2)° at 5 K (same as at 7 K and 14 K). As the temperature increases the value of γ lowers to 7(2)° at 30 K and 37 K, thus showing the same tendency—to go closer to horizontal plane—as it was observed by XYZ experiment.
The existence of small non-zero chiral parameters  and
and  at 5 K is a clear evidence of non-equal population of the domains with the 'right' and 'left' helices. The calculation gives an estimation of nl value in LTIC phase to be 0.62(3) for the domain with k2. At 37 K the intensity of satellite scattering becomes very small, and because of that the effect of overlapping of satellites from the two neighboring configurational domains (each of them could have a different chirality) becomes more significant. Therefore, similar to the measurements with PND, low values of chiral parameters
  and
and  at 37 K can be explained by the mixture of two satellites scattering originating from the two domains. The same situation takes place at 30 K, where two satellites from the two domains overlap completely.
For the study of the effect of the external electric field on the domain population, we performed the measurements of chiral polarization matrix elements under an applied field. In this case, the crystal was warmed up to the temperature 50 K, i.e. well above the transition TN = 43 K, then it was cooled down to 7 K under the applied electric field −3 kV (−6 kV cm−1). After that, the sample was warmed once more to the temperature higher than TN and the electric field +3 kV (+6 kV cm−1) was applied during the next cooling down to 7 K. The results for chiral parameters  and
and  for the reflection (0 0 − 2) + k2 are listed in table 3. These values correspond to the situation, when the application of the field −6 kV cm−1 lowers value nl to zero, i.e. leads to the equalization of the chiral domains population. The application of the field +6 kV cm−1 restores the inequality in chiral domain population up to nl = 0.58(3), which is close to the value previously measured in a crystal without a field application. Such a behavior corresponds to the situation when a chiral system does not return to its 'zero field state' through warming to 50 K, which witnesses about a strong pinning of the chiral domains to the crystal frame.
Table 3. Electric field dependence of polarizing matrix elements  for reflection (0 0 − 2) + k2 at 7 K.
| ZFC | FC −6 kV cm−1 | FC +6 kV cm−1 | |
|---|---|---|---|
 |
0.14(1) | 0.03(2) | 0.09(2) |
We could not change noticeably the chirality parameters under the reversal of the electrical field from −6 kV cm−1 to +6 kV cm−1 at fixed temperature 14 K after cooling in a zero field. This is another confirmation of the fact that domains are strongly pinned. This observation is in a good agreement with the previously results for TbMnO3 [22].
Discussion
By polarized neutron experiments, it was shown that the helix vector  makes a small angle α with c-axes of the crystal: its value resulting from different experiments varies from 3° to 7° at all temperatures. It is clear that the accuracy of each separate measurement is not high enough to make an unambiguous conclusion that this angle differs from zero, but the repetition of such results by different experimental techniques reduces the deviation in the determination of this angle effectively. Thus, one can conclude that
  makes angle α ≈ 5° with c-axes or helix plane makes angle α ≈ 5° with ab-plane. Regarding a magnetic spiral structure as Dzyaloshinsky–Moriya helix, one could assume that the direction of helix vector
  coincides in direction with DM vector D.
Considering the antisymmetric superexchange through an anion as [23, 24]:

allows to define DM vector as:

where R1, R2—unit vectors, connecting magnetic ions with anion, and their vector product fix the direction of D. The antisymmetric exchange parameter d(θ) depends in a rather complex manner on the local anisotropy of metal ion, on the particularities of metal-ligand bonds and its sign depends on the bond angle θ [24]. d(θ) in turn, defines the value and sign of DM vector D. The sign of antisymmetric parameter d(θ)changes at a critical angle θk which is characteristic for each interacting cation-anion group, similar to what takes place in the situation with a symmetric superexchange.
Regarding DM interaction in TbMn2O5 it is reasonable to take a Mn4+ ion and consider its neighborhood. A Mn4+ ion is surrounded by four Mn3+ ions, mediated via oxygen and with approximately equal exchange paths (figure 5(a)). Also there are two neighboring Mn4+ ions, which placed on c-axis and since there is an inversion point between Mn4+ ions, there is no sense to consider them as acting entities in DMI. For the calculation of the total energy of antisymmetric interaction one should make a total D calculation, connected with Mn4+ ion. For this purpose, one should consider four pairs of manganese ions Mn3+, centered around Mn4+, they are explicitly shown on figure 5(b): Mn11–O31–Mn21, Mn11–O32–Mn22, Mn11–O43–Mn23, Mn11–O44–Mn24. In the Pbam structure, these four pairs could be divided into two sets of equivalent pairs of interacting manganese ions: first set (1S): Mn11–O31–Mn21, Mn11–O32–Mn22 and second set (2S): Mn11–O43–Mn23, Mn11–O44–Mn24. Certainly, in the Pbam structure overall D will be zero since the pairs in each set are exactly equivalent. However, there are some indications [5, 25] about the symmetry lowering in RMn2O5, from a usually considered Pbam down to Pb21m polar group at low temperatures. Recently, Baledent et al in [8] reported that space group of RMn2O5 compounds is non-centrosymmetric at room temperature proposing a non-centrosymmetric monoclinic space group Pm (γ = 90°) rather than a centrosymmetric one Pbam considered usually. It is also worth noting that the largest displacements from the atomic positions in Pbam, were detected in [8] for the oxygen ions, involved in DM interaction under our consideration. These displacements lead to the small non-equivalency of exchange paths. Considering Pm as a true structure, S1 and S2 sets mentioned above become non-equivalent and one can define the parameter d(θ) for each set as d1(θ) and d2(θ) correspondingly.

Figure 5. DMI consideration: (a) part of crystal structure to be involved (b) exchange paths for Mn4+–Mn3+ pairs.
Download figure:
Standard image High-resolution image
Since the difference between the exchange paths in each set is very small, the parameter d1(θ) should be the same for both pairs for 1S. The same consideration is applied also to the parameter d2(θ)—for set 2S. The distances and surroundings of manganese ions for four pairs are similar in a large degree, and, as a result, d1(θ) and d2(θ) should be of the same order and in some approximation one can consider that ǀd1(θ)ǀ ≈ ǀd2(θ)ǀ. The sign of the antisymmetric exchange parameter is very sensitive to the bond angle in the vicinity of some critical angle value θk. The bond angles for Mn11–O31–Mn21 and Mn11–O32–Mn22 exchange paths are approx. 132°, while for Mn11–O43–Mn23, Mn11–O44–Mn24 ones they are ~123°. These angles are in the region of the critical angles typical for the symmetrical superexchange in RMn2O5 [26], and the antisymmetrical critical angle θk could lie in the same range as is shown in [24]. In this case d1(θ) and d2(θ) could have either the same or different signs.
The direction of total DM vector can be expressed through unit vector d as
For our model calculations, we took atom positions from [8], obtained for room temperature, and used the same labelling scheme of the ions. In this way we obtain a non-zero value of the overall interaction DM vector D and angle αD between vector D and c-axis to be equal ≈5° for the d1(θ) and d2(θ) of the same sign or ≈15° if d1(θ) and d2(θ) have opposite signs. This qualitative consideration can serve as an argument that the helix magnetic structure in TbMn2O5 can be regarded as being of DM nature.
The geometry of the layout and the size of ions involved in the consideration of interaction leads to the critical positions for oxygen ions [26]. In this case, tiny deviations of the intermediate ion from its initial position could cause a sharp change of the magnetic interaction, including the reorientation of the magnetic moments. We can suppose that the geometry arrangement of Mn11–O31–Mn21, Mn11–O32–Mn22, Mn11–O43–Mn23, Mn11–O44–Mn24 provides critical position for the antisymmetric exchange also. The application of the electrical field could lead to some striction effects—displacements of oxygens, which in turn provokes the variation of Mn − O bond angles. Such a variation is enough to change the sign of the antisymmetric exchange parameter d(θ) in some domains, which leads to the change of the ratio of the domains with the 'right' and 'left' helices.
Summary
We report the results of the single crystal TbMn2O5 investigation, performed by three different polarized neutron scattering methods. We show that the magnetic structure of exchange frustrated TbMn2O5 is chiral in all the magnetic phases, i.e. high-temperature incommensurate, commensurate magnetic and low-temperature incommensurate phases. Our results provide evidence that antisymmetric DM exchange should be considered as an effective interaction, which could be responsible for the magnetic and magneto-electric phenomena in RMn2O5 family. This assumption is confirmed by the qualitative analysis of the antisymmetric superexchange model, which shows that DM interaction could exist in manganites RMn2O5 for the structures with the symmetry lower than Pbam. The responsibility of DM interaction for the appearance of ferroelectricity concerns each magnetically ordered phase, while great enhancement of the ferroelectric polarization in commensurate phase can be due to some another mechanism, e.g. oxygen spin polarization [27] or exchange striction [1].
We observed the difference in the population of the 'right' and 'left' domains in all magnetically ordered phases in as-grown crystal. The value of this difference is occasional since it originates from the particularities in the process of crystal growth and following cooling down after that on the one hand and the vicinity of antisymmetric exchange paths to the critical value—on the other hand. It is possible to control this difference by the external electric field in a field-cooled mode, while the control of chirality in a magnetic ordering phase is impossible or requires a very high electric field. Such a situation corresponds to rather rigid chiral domain coupling to a crystal structure at low temperatures.
Acknowledgments
The authors thank S V Maleyev for fruitful discussions, E I Golovenchits and V A Sanina for sample preparation. We are grateful to the Russian Foundation for Basic Research for its financial support (grant No. 16-02-00545-a).