
Abstract
The method of neutron diffraction with isomorphic substitution was used to measure the structure of the rare-earth chalcogenide glasses  (Ga2X3)0.33(GeX2)0.60 with
  or Ce and
  or Se. X-ray diffraction was also used to measure the structure of the sulphide glass. The results are consistent with networks that are built from GeX4 and GaX4 tetrahedra, and give R–S and R–Se coordination numbers of 8.0(2) and 8.5(4), respectively. The minimum nearest-neighbour R–R distance associated with rare-earth clustering is discussed.
Export citation and abstract BibTeX RIS

Original content from this work may be used under the terms of the Creative Commons Attribution 3.0 licence. Any further distribution of this work must maintain attribution to the author(s) and the title of the work, journal citation and DOI.
1. Introduction
Many of the trivalent rare-earth ions exhibit intra-4f shell luminescence that can be exploited to make photonic glasses for, e.g. fibre amplifiers and lasers that operate at wavelengths compatible with fibre communications technology [1–3]. Here, the luminescence of the material will depend, e.g. on the solubility of rare-earth ions in the glass, and on the tendency of rare-earth ions to cluster within their matrix material. The latter leads to a non-uniform distribution of rare-earth ions that can limit the fluorescence lifetime, or lead to the formation of rare-earth compounds that are optically inactive. The luminescence can also be affected by multiphonon relaxation, wherein the probability of non-radiative channels is increased if the phonon energies of the host glass are close to gaps in energy between the 4f electron states of a rare-earth ion. It is therefore desirable to develop glassy materials in which the rare-earth ions are uniformly distributed within a glass matrix having appropriately small phonon energies and low transmission losses at the optical wavelengths of interest.
Chalcogenide glasses, containing one or more of the chalcogen elements (S, Se, Te), have photonic applications that range from digital memory storage to thermal imaging and infrared transmitting media [4–6]. They are also ideal hosts for luminescent rare-earth ions because their maximum phonon energies (e.g. ∼460 cm−1 for Ge–Ga–S versus ∼340 cm−1 for Ge–Ga–Se glasses in which the rare-earth solubility is high [7, 8]) are generally small as compared to silica (∼1100 cm−1) and fluoride glasses (∼400–650 cm−1) [3, 4, 9], although it is important to avoid an introduction of the vibrational bands associated with impurities to the phonon density of states [9–13]. The high refractive index of these materials (>2.1) helps to increase the cross section for stimulated emission [14, 15]. Even though rare-earth ions are barely soluble in the binary Ge–S system [10], germanium sulphide based glasses have attracted much attention because of their transparency in the visible spectrum. Here, the rare-earth solubility can be enhanced by making multicomponent glasses such as R2S3–Ga2S3–GeS2 [7, 16–21], in which the ability of Ga to form negatively charged GaS4 tetrahedra helps to balance the positive charge on rare-earth ions. The incorporation of Ga also has a tendency to reduce rare-earth clustering [22–24]. This reduction will either (i) increase the fluorescence lifetime if all of the rare-earth ions initially form a single population of clustered species, or (ii) increase the fluorescence intensity corresponding to the longer fluorescence lifetime if the rare-earth ions initially form two populations of clustered versus dispersed species. Accordingly, there have been many investigations to characterise the physico-chemical, optical and luminescent properties of R2S3–Ga2S3–GeS2 glasses to explore their potential for use in, e.g. optoelectronic devices [7, 11, 13, 15–18, 20, 21, 23, 25–42]. There have been comparatively few investigations of the corresponding selenide or mixed sulphide/selenide glasses [9, 40–48].
In this paper, the method of neutron diffraction with isomorphic substitution (NDIS) of the rare-earth element [49–54] was employed to measure the structure of the rare-earth glasses ( )0.07(Ga2X3)0.33(GeX2)0.60, with
  or Ce and
  or Se. X-ray diffraction was also used to measure the structure of the sulphide glass. The aim is to provide a point of comparison for the effect of different chalcogens on the glass structure. The regions of glass formation in ternary
  –Ga2X3–GeX2 systems containing large rare-earth ions are described in [16, 18, 20, 21]. The composition chosen for study contains a relatively large atomic fraction of the rare earth species cR = 0.0368 which is necessary for an application of the NDIS method. Here, the assumption is made that the 4f electrons of La3+ and Ce3+ , which characterise the difference between their electronic configurations, are sufficiently removed from the valence shell that the cations share a common structural chemistry and form isostructural compounds [1, 55]. This premise is supported by the similarity between the ionic radii of these trivalent cations (1.16 versus 1.14 Å for eightfold coordinated cations) [56] and the similarity between the Pettifor chemical parameters for La and Ce (0.705 versus 0.7025) [57]. There is a significant difference, however, between the neutron scattering lengths of La and Ce that will lead to a contrast between the measured neutron diffraction patterns for isostructural glasses containing one or other of these elements. In this way, it is possible to measure difference functions that separate, essentially, the R–R and R-μ pair-correlation functions from the μ−μ' pair-correlation functions, where μ (or μ') denotes a matrix atom, i.e. Ge, Ga or X. This simplification in the structural complexity associated with a single diffraction pattern enables the NDIS method to provide the type of site-specific structural information that is required in the development of realistic structural models, a prerequisite for establishing the structure-function relationships for rare-earth chalcogenide glasses.
The paper is organised as follows. The essential diffraction theory is given in section 2, and the experimental methodology is described in section 3. The results for the sulphide and selenide glasses are presented in section 4, and are discussed in section 5 by reference to (i) the structural models that have been proposed and (ii) the presence of rare-earth clustering. Conclusions are drawn in section 6.
2. Theory
In an x-ray or neutron diffraction experiment on ( )0.07(Ga2X3)0.33(GeX2)0.60 glass, the desired structural information is described by the total structure factor [58]
where α and β denote the chemical species, n = 4 is the number of different chemical species,  represents the atomic fraction of chemical species α,
  and
and  are the scattering length (or atomic form factor) and its complex conjugate for chemical species α, respectively,
  is a Faber–Ziman [59] partial structure factor, and Q is the magnitude of the scattering vector.
  is related to the partial pair-distribution function
  by the Fourier transform relation
where n0 is the atomic number density and r is a distance in real space. The mean coordination number of atoms of type β, contained in a volume defined by two concentric spheres of radii ri and rj centred on an atom of type α, is given by
The scattering lengths are independent of Q for the case of neutron diffraction, but not for the case of x-ray diffraction. In order to compensate for this Q dependence, the total structure factor can be rewritten as
where  is the mean scattering length. The corresponding real-space information is contained in the total pair-distribution function

In x-ray diffraction experiments, the normalisation defined by equation (4) has the advantage that it allows for a better resolution of the peaks in G(r).
Consider a neutron diffraction experiment performed on two samples of R–Ge–Ga–X glass that are identical in every respect, except that  , a 50:50 mixture of La and Ce, or Ce. Let the corresponding total structure factors be denoted by
  ,
,  and
and  , respectively, where
  . Then, if the rare-earth elements can be regarded as isomorphic, the contribution to a total structure factor from the μ-
 pair-correlation functions can be eliminated by taking a difference function such as
Related difference functions are defined by 
 and
and  . Similarly, it is possible to eliminate the R-μ pair-correlations by taking a difference function such as
where ![$ \Delta {{F}_{\mu {{\mu}^{\prime}}}}(Q)\equiv {\sum}_{\mu =1}^{m}{\sum}_{{{\mu}^{\prime}}=1}^{m}{{c}_{\mu}}{{c}_{{{\mu}^{\prime}}}}{{b}_{\mu}}{{b}_{{{\mu}^{\prime}}}}\left[{{S}_{\mu {{\mu}^{\prime}}}}(Q)-1\right]$](https://content.cld.iop.org/journals/0953-8984/29/22/225703/revision1/cmaa68c0ieqn025.gif) contains only the μ-
contains only the μ- pair-correlation functions and m = 3 is the total number of matrix species. Related difference functions are defined by
 ![$ \Delta {{F}^{(2)}}(Q)\equiv \,{{}^{\text{La}}}F(Q)-\left[{{b}_{\text{La}}}\,/\,\left({{b}_{\text{La}}}-{{b}_{\text{Mix}}}\right)\right] \Delta F_{R}^{(2)}(Q)$](https://content.cld.iop.org/journals/0953-8984/29/22/225703/revision1/cmaa68c0ieqn027.gif) and
and ![$ \Delta {{F}^{(3)}}(Q)\equiv \,{{}^{\text{Mix}}}F(Q)-\left[{{b}_{\text{Mix}}}\,/\,\left({{b}_{\text{Mix}}}-{{b}_{\text{Ce}}}\right)\right] \Delta F_{R}^{(3)}(Q)$](https://content.cld.iop.org/journals/0953-8984/29/22/225703/revision1/cmaa68c0ieqn028.gif) . The coherent neutron scattering lengths are
. The coherent neutron scattering lengths are  (4) fm,
  (4) fm,
  (2) fm,
  (2) fm,
  (20) fm,
  (1) fm and
  (9) fm [60]. The ratio of the R–R weighting factor
  to the weighting factors for the μ-
 pair-correlations is small (e.g. in the case of
  , 0.285% for the sulphide glass versus 0.087% for the selenide glass), i.e. the
  functions are dominated by the μ-
 pair-correlation functions.
The real-space functions corresponding to  and
and  (
( ) are obtained by Fourier transformation, and are denoted by
  and
and  , respectively. The equations for, e.g.
  and
and  are obtained from equations (6) and (7), respectively, by replacing each
  function by the corresponding partial pair-distribution function
  .
.
3. Experimental method
3.1. Glass synthesis and characterisation
Each sulphide glass was prepared in 3 g batches by loading high-purity elemental Ge (Aldrich, 99.999%), Ga (Aldrich, 99.9999%) and S (Alfa Aesar  , 99.9995%) along with La2S3 (Alfa Aesar, 99.9%) or Ce2S3 (Alfa Aesar, 99.9%), with the correct mass ratio, into a silica ampoule of 5 mm inner diameter and 1 mm wall thickness that had been etched using a 40 wt% solution of hydrofluoric acid, rinsed using distilled water then high-purity acetone, and baked dry under vacuum at 750 °C for 2 h. The ampoule was loaded in a high-purity argon-filled glove box, isolated using a Young's tap, and then transferred to a vacuum line where it was sealed under a pressure of 10−5 Torr. The sealed ampoule was placed in a rocking furnace, which was heated at a rate of 1 °C min−1 from ambient to a temperature T = 1100 °C, dwelling for 4 h each at T = 112 °C, T = 445 °C and T = 937 °C, near to the melting and boiling points of S, and the melting point of Ge, respectively. The highest temperature was maintained for
  24 h before the rocking motion was stopped, the furnace was placed vertically for 12 h to let the melt collect at the bottom of the ampoule, and the ampoule was then dropped into an ice/water mixture. The selenide glasses were prepared similarly, except that Se (Aldrich, 99.999+ %) and either La (Alpha Aesar, 99.9%) or Ce (Alpha Aesar, 99.9%) metal were used as starting ingredients, the lowest dwell temperatures were set at T = 221 °C and T = 685 °C, corresponding to the melting and boiling points of Se, and the upper dwell temperature was set to either T = 920 °C or T = 795 °C, corresponding to the melting temperatures of elemental La and Ce, respectively. Each sample was broken out of its ampoule inside a high-purity argon-filled glove box.
The density of each glass was measured using a Quantachrome helium gas pycnometer (table 1). The sulphide glasses were investigated by simultaneous differential scanning calorimetry and thermal gravimetric analysis using a TA Instruments SDT Q600 machine operated with oxygen free nitrogen gas at a scan rate of 10.00 °C min−1. The samples started to lose mass in the vicinity of the crystallisation exotherm, i.e. at a temperature greater than the glass transition temperature Tg (table 1). For glassy (La2Se3)0.07(Ga2Se3)0.33(GeSe2)0.60, Tg was taken from the reversible heat flow measured by modulated differential scanning calorimetry using a TA Instruments Q100 machine operated with oxygen free nitrogen gas at a scan rate of 3 °C min−1 and modulation rate of ±1 °C min−1.
Table 1. The measured mass density ρ, atomic number density n0 and glass transition temperature Tg for ( )0.07(Ga2X3)0.33(GeX2)0.60 glasses.
| R | X | ρ (g cm−3) | n0 (Å−3) | Tg (midpoint) (°C) |
|---|---|---|---|---|
| La | S | 3.26(1) | 0.040(1) | 430(2) |
| Mix | S | 3.27(1) | 0.040(1) | 444(5) |
| Ce | S | 3.24(1) | 0.040(1) | 446(2) |
| La | Se | 4.79(1) | 0.037(1) | 403(2) |
| Ce | Se | 4.79(1) | 0.037(1) | — |
3.2. High energy x-ray diffraction experiments
High energy x-ray diffraction experiments were performed on three (R2S3)0.07(Ga2S3)0.33(GeS2)0.60 glasses, with  , Mix or Ce, using beamline ID15B at the ESRF, France. Finely powdered samples were sealed between two layers of kapton 77–80 tape, giving a slab geometry with a sample thickness of 1 mm. The incident x-ray energy was 88.76 keV and the diffraction patterns were measured using a MAR345 two-dimensional image plate detector placed at a distance of 303.55 mm from the sample position. Diffraction patterns were measured at room temperature for each sample in its container, an empty kapton container, and the empty instrument. The program FIT2D [61, 62] was used to correct each data set for geometrical effects and polarisation of the incident beam before integrating over the Debye–Scherrer cones to produce a one dimensional diffraction pattern, which was normalised to the incident beam intensity. The data sets for each sample were then corrected for background and container scattering, taking attenuation effects into account, and were scaled to fit the sum of the Compton scattering [63] and self-scattering
  contributions at high Q values, where neutral atom form factors
  were taken from [64]. The Compton and self-scattering contributions were then subtracted to obtain
  , which was converted to the total x-ray structure factor
  using equation (4).
3.3. Neutron diffraction experiments
Neutron diffraction experiments were performed on three (R2S3)0.07(Ga2S3)0.33(GeS2)0.60 glasses, with  , Mix or Ce, using the GEM instrument [65] at the ISIS facility. Powdered samples (each of mass ∼6 g) were held in a cylindrical vanadium container of 6.8 mm inner diameter and 0.1 mm wall thickness. Diffraction patterns were taken for each sample in its vanadium container, the empty container, the empty instrument, and a cylindrical vanadium rod of diameter 8.36 mm at ambient temperature (
 C). The intensities for each detector group were saved at regular intervals, and no deviation between these intensities was observed outside the statistical variation, which verified the diffractometer stability [66]. The data sets were processed using the GUDRUN analysis program [67], and the data sets for the Ce and Mix samples were also corrected for the paramagnetic scattering from Ce3+ by using the procedure described in [49]. Self-consistency checks were performed to ensure that (i) a measured neutron total structure factor
  obeys the sum-rule relation
 ![${\int}_{0}^{\infty}\text{d}Q\,{{Q}^{2}}\left[{{S}_{\text{N}}}(Q)-1\right]=-2{{\pi}^{2}}{{n}_{0}}$](https://content.cld.iop.org/journals/0953-8984/29/22/225703/revision1/cmaa68c0ieqn061.gif) which follows from equation (5) by taking the limit as
which follows from equation (5) by taking the limit as  ; (ii) the low-r features in the corresponding
  function oscillate about their theoretical
  limit; and (iii) the back Fourier transform of
  , after the low-r oscillations are set to
  , is in good overall agreement with the measured
  function [68].
Neutron diffraction experiments were also performed on two (R2Se3)0.07(Ga2Se3)0.33(GeSe2)0.60 glasses, with  or Ce, using the GLAD instrument [69] at the intense pulsed neutron source (IPNS). Powdered samples (each of mass ∼12 g) were held in cylindrical vanadium containers of 4.64 mm inner diameter and 0.13 mm wall thickness. The experimental procedure followed that described for GEM, except that a cylindrical vanadium rod of diameter 9.5 mm was used for calibration purposes, and the data sets were processed using the ISAW analysis program [70].
4. Results
4.1. Sulphide glasses
The x-ray total structure factors  measured for the rare earth sulphide glasses (figure 1(a)) have a first sharp diffraction peak (FSDP) at 1.08(2) Å−1 (table 2) that is indicative of ordering on an intermediate length scale [71]. The atomic form factors for the rare-earth ions are similar because the atomic numbers for La and Ce are
  and
and  , respectively. Thus, the close similarity between the measured
  functions (figure 1(b)) is indicative of structural isomorphism.
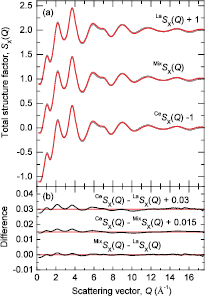
Figure 1. (a) The x-ray total structure factors  ,
,  and
and  for glassy
  . The vertical (dark grey) bars represent the measured data points with statistical errors, and the solid (red) curves are the back Fourier transforms of the corresponding
  functions shown in figure 2 after the unphysical low-r oscillations are set to the theoretical
  limit. (b) Differences between the total structure factors shown in (a).
Download figure:
Standard image High-resolution imageTable 2. First three peak positions Q1–Q3 in the reciprocal-space functions measured for glassy ( )0.07(Ga2X3)0.33(GeX2)0.60, where R represents La, Ce or Mix, and X represents S or Se. The peak positions r1–r4 in the corresponding real-space functions are also listed, together with the coordination number
  obtained from the area under the peak at r1 by assuming that
  , and the coordination number
  obtained from the area under the peak at r2.
| X | Function | Q1 (Å−1) | Q2 (Å−1) | Q3 (Å−1) | r1 (Å) |  |
r2 (Å) |  |
r3(Å) | r4(Å) |
|---|---|---|---|---|---|---|---|---|---|---|
| S |  |
1.08(2) | 2.19(2) | 3.71(2) | 2.25(2) | 4.0(1) | 3.03(3) | 8.5(2) | 3.66(5) | — |
| S |  |
1.08(2) | 2.19(2) | 3.71(2) | 2.25(2) | 4.1(1) | 3.03(3) | 8.4(2) | 3.66(5) | — |
| S |  |
1.08(2) | 2.19(2) | 3.71(2) | 2.25(2) | 4.1(1) | 3.03(3) | 8.4(2) | 3.66(5) | — |
| S |  |
1.05(2) | 2.18(2) | 3.68(2) | 2.25(2) | 3.9(1) | 3.01(3) | 8.8(9) | 3.63(5) | — |
| S |  |
1.07(2) | 2.19(2) | 3.68(2) | 2.25(2) | 3.9(1) | 2.97(3) | 11.8(9) | 3.62(5) | — |
| S |  |
1.05(2) | 2.19(2) | 3.68(2) | 2.24(2) | 3.9(1) | 2.94(3) | 10.2(9) | 3.60(5) | — |
| S |  |
1.05(2) | 2.22(2) | 3.67(2) | 2.24(2) | 4.0(1) | — | — | 3.59(5) | — |
| S |  |
1.05(2) | 2.23(2) | 3.67(2) | 2.25(2) | 4.1(1) | — | — | 3.61(5) | — |
| S |  |
1.05(2) | 2.21(2) | 3.67(2) | 2.24(2) | 4.1(1) | — | — | 3.57(5) | — |
| S |  |
1.05(2) | 1.95(2) | — | — | — | 3.05(3) | 8.0(2) | 3.89(5) | 4.69(5) |
| S |  |
1.02(2) | 1.92(2) | — | — | — | 3.16(3) | 7.9(2) | 3.84(5) | 4.56(5) |
| S |  |
1.06(2) | 1.97(2) | — | — | — | 3.07(3) | 8.0(2) | 3.85(5) | 4.70(5) |
| Se |  |
1.03(2) | 2.08(2) | 3.50(2) | 2.38(2) | 3.9(1) | 3.09(3) | 8.1(9) | 3.82(5) | — |
| Se |  |
1.03(2) | 2.06(2) | 3.50(2) | 2.38(2) | 3.9(1) | 3.14(3) | 9.8(9) | 3.85(5) | — |
| Se |  |
1.03(2) | 2.05(2) | 3.50(2) | 2.37(2) | 4.0(1) | — | — | 3.87(5) | — |
| Se |  |
1.09(2) | 2.46(2) | — | — | — | 3.11(3) | 8.5(4) | 3.84(5) | 4.75(5) |
The first peak in  at 2.25(2) Å (figure 2) is attributed to a superposition of nearest neighbour Ga–S and Ge–S pair-correlations, and its position compares with Ga–S and Ge–S intra-tetrahedral bond distances of
  (Å)
(Å)  in crystalline Ga2S3 [72–74] versus
  (Å)
(Å)  in crystalline GeS2 [75–77]. The atomic form factors for Ga and Ge are similar because their atomic numbers are similar at
  and
and  . Hence, by converting
  to
to  and dividing by
 ![${{c}_{\text{Ge}}}{{c}_{\text{S}}}\left[\,f_{\text{Ge}}^{\ast}(Q){{f}_{\text{S}}}(Q)+{{f}_{\text{Ge}}}(Q)f_{\text{S}}^{\ast}(Q)\right]$](https://content.cld.iop.org/journals/0953-8984/29/22/225703/revision1/cmaa68c0ieqn110.gif) , the Q-dependent weighting factors on the Ga–S and Ge–S partial structure factors are more-or-less removed. In this way [78], the Fourier transform of the resultant Q-space function enables the Ga–S and Ge–S coordination numbers to be extracted by direct integration of the first peak. If it is assumed that
, the Q-dependent weighting factors on the Ga–S and Ge–S partial structure factors are more-or-less removed. In this way [78], the Fourier transform of the resultant Q-space function enables the Ga–S and Ge–S coordination numbers to be extracted by direct integration of the first peak. If it is assumed that  , then
  is obtained by integrating over the range 1.90
  (table 2). The results are therefore consistent with the formation of both GaS4 and GeS4 tetrahedra. The second peak in
  at 3.03(3) Å is attributed to nearest-neighbour R-S pair-correlations by comparison with the bond lengths found in crystalline R–Ga–Ge–S, R–Ga–S and R–Ge–S materials with
  or Ce (table 3). By converting
  to
to  , dividing by
 ![${{c}_{R}}{{c}_{\text{S}}}\left[\,f_{R}^{\ast}(Q){{f}_{\text{S}}}(Q)+{{f}_{R}}(Q)f_{\text{S}}^{\ast}(Q)\right]$](https://content.cld.iop.org/journals/0953-8984/29/22/225703/revision1/cmaa68c0ieqn118.gif) , and Fourier transforming into real-space [78], a mean coordination number
, and Fourier transforming into real-space [78], a mean coordination number  is obtained by integrating over the range
  (table 2).
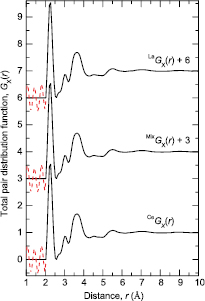
Figure 2. The x-ray total pair-distribution functions  ,
,  , and
, and  obtained by Fourier transforming the
  functions shown in figure 1 after truncating at a maximum scattering vector
  Å−1. The broken (red) curves indicate the extent of the unphysical low-r oscillations.
Download figure:
Standard image High-resolution imageTable 3. The Ga–X, Ge–X and R–X coordination numbers  ,
,  and
and  , and corresponding bond distances
  ,
,  and rRX, respectively, in crystalline R–Ga–Ge–S, R–Ga–X or R–Ge–X materials, where
  or Ce and
  or Se. In several of these materials, Ga or Ge have both tetrahedral and octahedral coordination environments. Also given are the minimum nearest-neighbour R–Ga, R–Ge and R–R distances
  ,
,  and
and  , respectively. More information is available on the crystal structures of the sulphides as compared to the selenides.
| Crystal |  |
 (Å) (Å) |
 |
 (Å) (Å) |
 |
rRX (Å) |  (Å) (Å) |
 (Å) (Å) |
 (Å) (Å) |
Reference |
|---|---|---|---|---|---|---|---|---|---|---|
| La2Ga2GeS8 | 4 | 2.24–2.29 | 4 | 2.19–2.26 | 8 | 2.93–3.12 | 3.75 | 4.45 | 4.87 | [79] |
| La3Ga0.5(Ge0.5/Ga0.5)S7 | 4 | 2.20–2.25 | 4 | 2.20–2.25 | 8 | 2.89–3.28 | 3.57 | 3.68 | 4.42 | [80] |
| 6 | 2.59–2.63 | |||||||||
| LaGaS3 | 4 | 2.09–2.53 | — | — | 8.3 | 2.82–3.48 | 3.50 | — | 4.33 | [81] |
| LaGaS3 | 4 | 2.20–2.33 | — | — | 8 | 2.81–3.59 | 3.69 | — | 4.33 | [82] |
| La6Ga3.33S14 | 4 | 2.23–2.28 | — | — | 8 | 2.85–3.39 | 3.56 | — | 4.44 | [83] |
| 6 | 2.66–2.86 | |||||||||
| Ce6Ga3.33S14 | 4 | 2.23–2.25 | — | — | 8 | 2.82–3.38 | 3.53 | — | 4.41 | [83] |
| 6 | 2.63–2.84 | |||||||||
| La4Ge3S12 | — | — | 4 | 2.19–2.24 | 9 | 2.86–3.74 | — | 3.71 | 4.05 | [84] |
| La2GeS5 | — | — | 4 | 2.80–2.98 | 8 | 2.61–3.89 | — | 3.82 | 4.06 | [85] |
| La2GeS5 | — | — | 4 | 2.18–2.25 | 8.5 | 2.83–3.32 | — | 3.76 | 4.30 | [86] |
| La2GeS5 | — | — | 4 | 2.18–2.26 | 8.5 | 2.84–3.33 | — | 3.77 | 4.32 | [87] |
| LaGe1.25S7 | — | — | 4 | 2.17–2.22 | 8 | 2.85–3.17 | — | 3.51 | 4.34 | [88] |
| — | — | 6 | 2.63–2.64 | |||||||
| La4Ge3S12 | — | — | 4 | 2.19–2.25 | 9 | 2.86–3.73 | — | 3.71 | 4.05 | [89] |
| La6Ge3S14 | — | — | 4 | 2.00–2.34 | 8 | 2.85–3.46 | — | 3.64 | 4.47 | [90] |
| — | — | 6 | 2.45–2.66 | |||||||
| Ce4Ge3S12 | — | — | 4 | 2.19–2.24 | 9 | 2.85–3.72 | — | 3.70 | 4.03 | [89] |
| Ce4Ge3S12 | — | — | 4 | 2.20–2.24 | 9 | 2.86–3.72 | — | 3.69 | 4.02 | [91] |
| Ce6Ge3S14 | — | — | 4 | 2.12–2.29 | 8 | 2.86–3.25 | — | 3.58 | 4.38 | [90] |
| — | — | 6 | 2.65–2.85 | |||||||
| Ce6Ge2.5S14 | — | — | 4 | 2.13–2.27 | 8 | 2.86–3.26 | — | 3.56 | 4.37 | [87] |
| — | — | 6 | 2.64–2.84 | |||||||
| La6Ga3.33Se14 | 4 | 2.33–2.34 | — | — | 8 | 2.92–3.36 | 3.66 | — | 4.57 | [83] |
| 6 | 2.79–2.80 | |||||||||
| Ce6Ga3.33Se14 | 4 | 2.27–2.31 | — | — | 8 | 2.94–3.38 | 3.63 | — | 4.54 | [83] |
| 6 | 2.72–2.73 | |||||||||
| La3Ge1.48Se7 | — | — | 4 | 2.31–2.37 | 8 | 3.02–3.27 | — | 3.69 | 4.55 | [92] |
| — | — | 6 | 2.84–2.88 | |||||||
| La6Ge3Se14 | — | — | 4 | 2.27–2.33 | 8 | 3.02–3.35 | — | 3.72 | 4.59 | [93] |
| — | — | 6 | 2.77–2.78 | |||||||
| Ce3Ge1.47Se7 | — | — | 4 | 2.32–2.37 | 8 | 3.00–3.27 | — | 3.66 | 4.52 | [92] |
| — | — | 6 | 2.82–2.86 | |||||||
| Ce6Ge3Se14 | — | — | 4 | 2.26–2.31 | 8 | 2.99–3.33 | — | 3.69 | 4.56 | [93] |
| — | — | 6 | 2.74–2.76 |
The neutron total structure factors  measured for the rare-earth sulphide glasses are shown in figure 3, and the corresponding total pair-distribution functions
  are shown in figure 4. The positions of the leading peaks in both reciprocal and real space are listed in table 2. There is a small but measurable contrast between the reciprocal-space functions that is particularly marked in the region of the FSDP at ≃1.05 Å−1, as emphasised by the difference functions
  shown in figure 5(a). As for the x-ray results, the first peak in
  at 2.25(2) Å is attributed to a superposition of nearest neighbour Ga–S and Ge–S pair-correlations. On the assumption that
  , integration of this peak over the range
  (Å)
(Å)  gives
gives  . The second peak in
  at ≃2.94–3.01 Å is attributed to nearest neighbour R–S pair-correlations. The
  values obtained by integrating this peak over the range
  (Å)
(Å)  are not, however, the same (table 2), which indicates a contribution to the second peak from μ-
 pair-correlations. The height of the nearest-neighbour R–S peak is more pronounced in
  (figure 2) as compared to
  (figure 4), because the large atomic number of R gives larger weighting factors to the R-β partial pair-distribution functions.
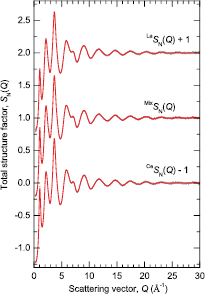
Figure 3. The neutron total structure factors  ,
,  , and
, and  for glassy (R2S3)0.07(Ga2S3)0.33(GeS2)0.60. The vertical (dark grey) bars represent the measured data points with statistical errors, and the solid (red) curves are the back Fourier transforms of the corresponding
  functions shown in figure 4 after the unphysical low-r oscillations are set to the theoretical
  limit.
Download figure:
Standard image High-resolution image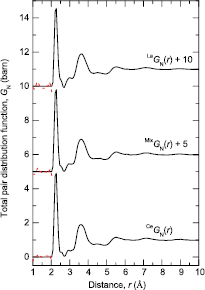
Figure 4. The neutron total pair-distribution functions  ,
,  , and
, and  for glassy (R2S3)0.07(Ga2S3)0.33(GeS2)0.60 as obtained by Fourier transforming the
  functions shown in figure 3 after spline fitting the data and applying a cosine window function over the range 25–30 Å−1. The broken (red) curves indicate the extent of the unphysical low-r oscillations.
Download figure:
Standard image High-resolution image
Figure 5. The difference functions (a)  (i = 1, 2, 3), and (b)
  (i = 1, 2, 3) for glassy (R2S3)0.07(Ga2S3)0.33(GeS2)0.60. The vertical (dark grey) bars represent the measured data points with statistical errors. The solid (red) curves are the back Fourier transforms of the corresponding
  or
or  functions, shown in figure 6, after the unphysical low-r oscillations are set to the
  or
or  limits. For clarity of presentation, several of the data sets are displaced vertically.
Download figure:
Standard image High-resolution imageThe difference functions  and
and  are shown in figure 5, and the corresponding real-space functions
  and
and  are shown in figure 6. The first peak in
  at ≃3.09 Å is attributed to R–S pair-correlations (table 3) and its integration over the range
  (Å)
(Å)  gives a mean coordination number
  . This value is smaller than obtained from the second peak in
  (table 2), which is consistent with a contribution to the latter from μ-
 pair-correlations. The second peak in
  at ≃3.86 Å is attributed to a superposition of R–Ge and R–Ga pair-correlations (table 3). The third peak in
  at ≃4.65 Å is expected to have a contribution from nearest neighbour R–R pair-correlations on the basis that the minimum R–R distance is
  4.02–4.87 Å for the crystalline sulphides reported in table 3. As in the case of
  , the first peak in
  at 2.24(2) Å is attributed to a superposition of Ga–S and Ge–S pair-correlations and, if it is assumed that
  , a coordination number
  is obtained by integrating over the range
  (Å)
(Å)  . The second peak in
  at ≃3.59 Å overlaps with the first peak in
  at ≃3.09 Å, which confirms a contribution from μ-
 pair-correlations to the second peak in
  .
.
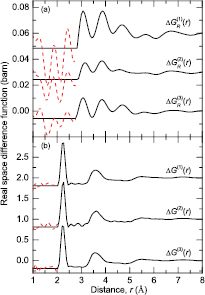
Figure 6. The difference functions (a)  (i = 1, 2, 3), and (b)
  (i = 1, 2, 3) for glassy (R2S3)0.07(Ga2S3)0.33(GeS2)0.60, as obtained by Fourier transforming the corresponding
  or
or  functions shown in figure 5 after spline fitting the data and applying a cosine window function over the range 5–20 Å−1 for
  or 25–30 Å−1 for
  . The broken (red) curves indicate the extent of the unphysical low-r oscillations. For clarity of presentation, several of the data sets are displaced vertically.
Download figure:
Standard image High-resolution imageIt was not possible to extract reliably the R–R partial structure factor from the measured data sets by using difference function methods [51, 68, 94]. This situation is likely to have originated from the small atomic fraction of the rare-earth ions (cR = 0.0368), and the possibility of some residual μ- pair- correlations in
  , i.e. the sample compositions may not have matched exactly.
4.2. Selenide glasses
The neutron total structure factors  measured for the rare-earth selenide glasses are shown in figure 7, and the corresponding total pair-distribution functions
  are shown in figure 8. The positions of the leading peaks in both reciprocal and real space are listed in table 2. The first peak in
  at 2.38(2) Å is attributed to a superposition of nearest neighbour Ga–Se and Ge–Se pair-correlations, and its position compares with intra-tetrahedral bond distances of
  (Å)
(Å)  in crystalline Ga2Se3 [95, 96] versus
  (Å)
(Å)  in crystalline GeSe2 [97]. On the assumption that
  , integration of this peak over the range
  (Å)
(Å)  gives
gives  . The results are therefore consistent with the formation of a network containing both GaSe4 and GeSe4 tetrahedra. The second peak in
  at ≃3.09–3.14 Å is attributed to nearest-neighbour R–Se pair-correlations by comparison with the bond lengths found in crystalline R–Ga–Se and R–Ge–Se materials with
  or Ce (table 3). The
  values obtained by integrating this peak over the range
  (Å)
(Å)  are not, however, identical (table 2), which indicates a contribution to the second peak from μ-
 pair-correlations.
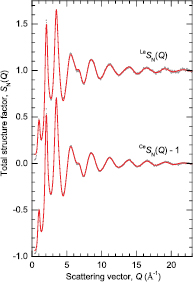
Figure 7. The neutron total structure factors  and
and  for glassy (R2Se3)0.07(Ga2Se3)0.33(GeSe2)0.60. The vertical (dark grey) bars represent the measured data points with statistical errors, and the solid (red) curves are the back Fourier transforms of the corresponding
  functions shown in figure 8 after the unphysical low-r oscillations are set to the theoretical
  limit.
Download figure:
Standard image High-resolution image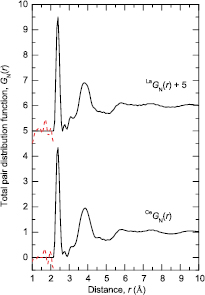
Figure 8. The neutron total pair-distribution functions  and
and  for glassy (R2Se3)0.07(Ga2Se3)0.33(GeSe2)0.60, as obtained by Fourier transforming the corresponding
  functions shown in figure 7 after spline fitting the data and applying a cosine window function over the range 18–23 Å−1. The broken (red) curves indicate the extent of the unphysical low-r oscillations.
Download figure:
Standard image High-resolution imageThe difference function  and its Fourier transform
  are shown in figures 9(a) and 10(a), respectively. The
  function is relatively noisy, so the data set was truncated at
  Å−1 to reduce Fourier transform artifacts in
  . The first and second peaks in
  at 3.11(3) and 3.84(5) Å are attributed to the nearest-neighbour R–Se pair-correlations and to a superposition of the R–Ga and R–Ge pair-correlations, respectively. As compared to
  for the corresponding sulphide glass (figure 6(a)), the first peak is higher than the second peak because
  . The first peak gives a coordination number
  by integrating over the range
  (Å)
(Å)  to the first minimum, which compares to
  –9 for large rare earth ions in related crystalline materials (table 3). This coordination number is different to those found from the
  functions (table 2), which points to an overlap of the the R−Se and μ−μ' pair-correlation functions in GN (r), and to the difficulty in extracting
  from the total pair-distribution functions. The third peak in
  at 4.75(5) Å is likely to have a contribution from R–R pair-correlations on the basis that
  –4.59 Å for the crystalline selenides reported in table 2.
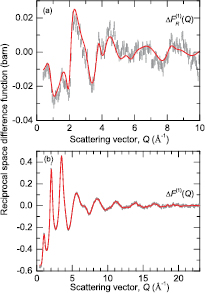
Figure 9. The difference functions (a)  , and (b)
  for glassy (R2Se3)0.07(Ga2Se3)0.33(GeSe2)0.60. The vertical (dark grey) bars represent the measured data points with statistical errors. The solid (red) curves are the back Fourier transforms of the corresponding
  and
and  functions shown in figure 10, after the unphysical low-r oscillations are set to the theoretical
  or
or  limit.
Download figure:
Standard image High-resolution image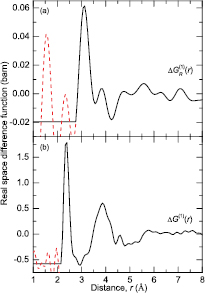
Figure 10. The difference functions (a)  and (b)
  for glassy (R2Se3)0.07(Ga2Se3)0.33(GeSe2)0.60 as obtained by Fourier transforming the corresponding
  and
and  functions shown in figure 9 after spline fitting the data and applying a cosine window function over the range 7.5–10 Å−1 for
  or 18–23 Å−1 for
  . The broken (red) curves indicate the extent of the unphysical low-r oscillations.
Download figure:
Standard image High-resolution image
The difference function  and its Fourier transform
  are shown in figures 9(b) and 10(b), respectively. As for the case of
  , the first peak in
  at 2.37(2) Å is attributed to a superposition of Ga–Se and Ge–Se pair-distribution functions and, if it is assumed that
  , a coordination number
  is obtained by integrating this peak over the range
  (Å)
(Å)  . The glass composition can be re-written as (R2Se3)0.07[(Ga2Se3)0.3548(GeSe2)0.6452]0.93, i.e. the base glass is rich in GeSe2. Hence, by comparison with the structure of glassy GeSe2 [98], the shoulder in
  at ≃3.1 Å may have a contribution from the Ge–Ge distances in edge-sharing GeSe4 tetrahedra, the peak at 3.87(5) Å may have a contribution from Se–Se pair-correlations, and the low-r shoulder on this peak at ≃3.6 Å may have a contribution from the Ge–Ge pair-correlations in corner-sharing tetrahedra. In comparison, Raman and multinuclear (71Ga, 77Se) solid state nuclear magnetic resonance experiments on the base glass-forming system (Ga2Se3)x(GeSe2)1−x with
  support the formation of a network based primarily on corner-sharing GaSe4 and GeSe4 tetrahedra in which there are also some edge-sharing GeSe4 tetrahedra and Ge–Ge homopolar bonds that appear in ethane-like Se3Ge-GeSe3 units [8]. With increasing x, the glass becomes increasingly Se deficient because the Ga:Se ratio is 1:3/2, i.e. less of the Ga and Ge atoms are able to take coordination environments in which they are bound exclusively to four Se atoms. In response, the fraction of homopolar bonds in ethane-like units increases, and Se atoms can also increase their coordination number from two to three by the formation of triclusters in which each higher coordinated Se atom is shared between three (Ga/Ge)Se4 tetrahedra. In this way the Ga and Ge atoms can retain fourfold coordination environments.
5. Discussion
The local structure in R2S3–Ga2S3–GeS2 glasses containing La and Ce has been investigated by extended x-ray absorption fine structure (EXAFS) spectroscopy [30, 31]. In the case of glassy (La2S3)0.167(Er2S3)0.083(Ga2S3)0.417(GeS2)0.333, EXAFS investigations at the Ga and Ge K-edges indicate the formation of GaS4 and GeS4 tetrahedra with bond distances of  Å and
Å and  Å [30]. Similar observations were made for the Ga and Ge coordination environments for glasses in the La2S3–Er2S3–Ga2S3–GeS2 system from other EXAFS investigations at the Ga and Ge K-edges in which the ratio of Ga2S3 to GeS2 was varied [31]. In the case of glassy (R2S3)0.25(Ga2S3)0.417(GeS2)0.333 (
 ), EXAFS investigations at the R LIII-edge gave a coordination number
  with a bond distance
  Å or a coordination number
  with a bond distance
  Å [30]. In comparison, EXAFS investigations of glasses in the La2S3–Ga2S3 system at the Ga K-edge and La LIII-edge indicate a network based on corner-sharing GaS4 tetrahedra with a bond distance
  –2.27 Å, and a coordination number
  with a bond distance
  –2.93 Å [99].
Raman spectroscopy was used to measure the structure of glassy (La2S3)x[(Ga2S3)0.4(GeS2)0.6](1−x) with  [7]. For x = 0, the results were interpreted in terms of a network made from corner-sharing GaS4 and GeS4 tetrahedra, in which the S deficiency associated with the Ga:S ratio of 1:3/2 is compensated by the formation of Ga–Ga or Ge–Ge homopolar bonds. It was argued that Ge–Ge bonds predominate on the basis that Ge–S bonds are more easily ruptured than Ga–S bonds, for which the electronegativity difference between the atomic species is greater. Edge-sharing tetrahedral connections are allowed, especially in respect of Ga centered units. The negative charge on units such as GaS
 is compensated by the positive charge on units such as (S3Ge–GeS3)2+ , where these charges are calculated on the basis of bridging S atoms. When La2S3 is introduced, the provision of additional S atoms breaks homopolar bonds to enable all of the Ge and Ga atoms to form corner-sharing GaS4 or GeS4 tetrahedra in which some of the S atoms are non-bridging. In addition, edge-sharing tetrahedra are converted to corner-sharing tetrahedra, and the resultant motifs may also contain non-bridging S atoms. Hence, negatively charged tetrahedral units are formed that can balance the positive charge on the added La3+ ions.
The present neutron and x-ray diffraction work on the structure of glassy (R2S3)0.07(Ga2S3)0.33(GeS2)0.60, where the composition can be re-written as (R2S3)0.07[(Ga2S3)0.3548(GeS2)0.6452]0.93, is consistent with the formation of GaS4 and GeS4 tetrahedra as network forming motifs. By contrast, in the crystalline structures of R–Ga–Ge–S, R–Ga–S and R–Ge–S materials with  , the Ga and Ge atoms can form either tetrahedral or octahedral motifs with S atoms, depending on the composition (table 3). The first peak in the measured
  functions (figure 4) has a small high-r shoulder at ≃2.55 Å, a distance that is longer than typical intra-tetrahedral Ga–S and Ge–S distances (table 3). It may therefore originate from the longer bond lengths found in higher coordinated Ge or Ga centred polyhedra, or from Ga–Ga homopolar bonds, where the Ga–Ga nearest-neighbour distance is 2.45 Å in crystalline GaS [100], 2.43–2.48 Å in crystalline GaSe [101], or 2.48–2.69 Å in the different polymorphs of crystalline Ga [102–105]. A shoulder at ≃2.55 Å does not, however, manifest itself as a notable feature in
  (figure 6), i.e. this feature in
  may have a contribution from Fourier transform artifacts. The coordination number
  (2) found from the measured
  functions for glassy (R2S3)0.07(Ga2S3)0.33(GeS2)0.60 (table 2) compares to
  –9 for large rare earth ions in related crystalline materials (table 3).
For glassy (R2S3)0.07(Ga2S3)0.33(GeS2)0.60, a nearest-neighbour R–R distance of ≃4.65 Å, as estimated from the position of the third peak in  (table 2), compares to a minimum nearest-neighbour R–R distance
  4.02–4.87 Å in crystalline R–Ga–Ge–S, R–Ga–S and R–Ge–S materials with
  or Ce (table 3). In these crystalline materials,
  corresponds to R–S–R connections, i.e. two rare-earth ions share a common sulphur atom. By contrast, if the rare-earth ions were uniformly distributed within the glass matrix on a simple cubic lattice in order to optimise their separation, the R–R distance
  Å. Hence, there appears to be a clustering of rare-earth ions in the sulphide glass, and a distance
  –4.9 Å is likely to be representative of R2S3–Ga2S3–GeS2 glasses in which this clustering occurs. For glassy (R2Se3)0.07(Ga2Se3)0.33(GeSe2)0.60, a nearest-neighbour R–R distance of ≃4.75 Å can be estimated from the position of the third peak in
  (table 2), which compares to
  Å for the glass and
  –4.59 Å in crystalline R–Ga–Se and R–Ge–Se with
  or Ce (table 3). For the latter,
  corresponds to R–Se–R connections. In rare-earth glassy materials, a distance
  is desirable because it will minimise the non-radiative energy transfer between rare-earth ions, thereby helping to optimise the radiative quantum efficiency [14, 36].
6. Conclusions
The structure of ( )0.07(Ga2X3)0.33(GeX2)0.60 glasses, where R denotes La or Ce and X denotes S or Se, was investigated by using the method of neutron diffraction with isomorphic substitution. X-ray diffraction was also employed to measure the structure of the sulphide glass. The experiments on both the sulphide and selenide glasses reveal structures that are based on networks built from GaX4 and GeX4 tetrahedra in which the rare-earth ions reside with an R-X coordination number
  or
or  . The results for the Ga and Ge centered network-forming motifs are consistent with the findings from spectroscopic investigations of glasses in the R2S3–Ga2S3–GeS2 system, and show that these conformations are also present in glasses from the R2Se3–Ga2Se3–GeSe2 system. For sulphide and selenide
  –Ga2X3–GeX2 glasses in which rare-earth clustering occurs, representative minimum nearest-neighbour R–R distances are likely to be 4.0–4.9 Å and 4.5–4.8 Å, respectively, and correspond to R–X–R connections.
Acknowledgments
We are grateful to Lawrie Skinner, Joan Siewenie and Veijo Honkimäki for their help with the experiments. PSS would like to thank Bruce Aitken (Corning Inc.) and Andrey Tverjanovich (Saint-Petersburg State University) for useful discussions. The Bath group thanks the EPSRC for support via Grant No. EP/C003594/1, and acknowledges use of the EPSRC funded National Chemical Database Service hosted by the Royal Society of Chemistry. PSS and AZ are grateful to Corning Inc. for the award of Gordon S Fulcher Distinguished Scholarships during which this work was completed. AZ is supported by a Royal Society—EPSRC Dorothy Hodgkin Research Fellowship. The data sets created during this research are openly available from the University of Bath data archive at https://doi.org/10.15125/BATH-00343.