

Abstract
O− ion flux from the indium tin oxide (ITO) sputter target under Ar ion bombardment is quantitatively evaluated using a calorimetry method. Using a mass spectrometer with an energy analyzer, O− energy distribution is measured with spatial dependence. Directional high-energy O− ion ejected from the target surface is observed. Using a calorimetry method, localized heat flux originated from high-energy O− ion is measured. From absolute evaluation of the heat flux from O− ion, O− particle flux in order of 1018 m−2 s−1 is evaluated at a distance of 10 cm from the target. Production yield of O− ion on the ITO target by one Ar+ ion impingement at a kinetic energy of 244 eV is estimated to be 3.3 × 10⁻³ as the minimum value.
Export citation and abstract BibTeX RIS
1. Introduction
Recently, various oxide films are utilized in electronics device fabrication. Indium tin oxide (ITO) is a well-known oxide film that is optically transparent and electrically conductive, and is used in various electronics devices such as flat panel displays, solar cells, and so on. Zinc oxide (ZnO) [1], aluminum zinc oxide (AZO) [2] or indium-gallium-zinc-oxide (IGZO) [3] is also transparent and electrically conductive materials used for display device applications and so on. Magnesium oxide (MgO), electrically insulating material, is also important material for magnetic tunneling junction of magneto-resistive random access memory (MRAM) [4]. For deposition of these oxide thin films, magnetron plasma is one of the most important tools. However, the possibility of physical and electronic damages to the film by energetic particles from the sputtering target has been pointed out [5–9]. In the case of magnetic tunneling junctions for magneto-resistive random access memory (MRAM), for example, sensitive variation of the magnetic and/or electrical properties depending on the sputtering conditions has been reported, suggesting damage to the deposited film interface [9]. Therefore, the measurement of energetic particles in magnetron plasma is required to understand their behavior and to control the deposition process.
One of possible high-energy species is the energetic Ar atom that is produced through surface neutralization and backscattering of high energy Ar ion impinging on the target. So far, we have investigated the behavior of high-energy Ar atoms backscattered from a sputtering target using a quadrupole mass analyzer with an energy analyzer (QMA-EA) [10–13]. We have also demonstrated that control of the sputtering target potential can reduce the kinetic energy of recoiled Ar atoms and improve the quality of multilayer magnetic recording films [11]. Another possible energetic species in magnetron plasma is negative oxygen (O−) ion. For DC and RF reactive sputtering with oxygen gas, energy distribution of O− ions that are produced near the sputtering target have been reported [14, 15]. Furthermore, in the case of the oxide targets, it is known that O− ions are often produced on the target surface. When the oxide surface is negatively biased with respect to the plasma, the cathode fall potential in front of the oxide target accelerates surface-produced O− ions up to a few hundred eV [8], resulting in severe damage on the sputter deposited oxide films. So far, energy distribution of O− ions ejected from a YBaCuO target has been investigated by energy-dispersive mass spectrometry [16]. In the case of the TiO2 film deposition by RF magnetron plasma, strong spatial variation of a crystalline phase in sputter-deposited film has been reported [17]. A similar result has been reported in the case of transparent conductive film of ITO films [8, 18]. We have reported spatial variation of high energy O− ions in an RF magnetron plasma with MgO target, showing strong spatial dependence of the O− energy [19]. We have also observed a fine structure in the O− energy distribution and have clarified the mechanism of the fine structure formation [20].
So far, various measurements of high energy O− ions have been reported and the relation between high-energy O− ion and film properties has been discussed. For the detailed discussion, however, quantitative measurement of high energy O− ion flux is unavoidable, and there have been few reports on the quantitative measurement of high energy O− flux in the case of CeO2 sputtering [21]. In this paper, we report absolute measurement of high energy O− ion flux in a DC magnetron plasma of an ITO target, using an energy-resolved mass spectrometer and calorimetry method.
2. Experimental procedure
Experimental apparatus is schematically shown in figure 1. A vacuum vessel of 30 cm in diameter and 25 cm in height is evacuated by a turbo-molecular pump down to ~10−4 Pa. Ar gas (10 sccm) is introduced to the vessel through a mass flow controller at a pressure (p) of 0.2–0.4 Pa. An ITO sputter target (In2O3/SnO2 ratio: 0.9/0.1, diameter: 12 cm) is installed on the top of the vessel. A pair of ring magnets for the magnetron plasma production is installed on the backside of the target where the center of the ring magnet is 1.6 cm apart from center of the target. The ring magnet center is rotatable with respect to the center of the target. Hereafter, the origin of radial (r) and co-axial (z) axes is defined at the ring magnet center on the target surface. The maximum parallel magnetic field on the target surface is 0.12 T at r = 2 cm and null-point (zero magnetic field) is positioned at z = 6 cm on the co-axial axis of the ring magnet (r = 0), producing 'balanced' magnetron plasma. DC power at discharge voltage (Vd) of 240–280 V and discharge current (Id) of 0.2–0.3 A is applied to the target, producing ring-shaped magnetron plasma with a ring radius of ~2 cm. A movable shutter is installed in front of the target to control sputtered particles and the plasma. The magnetic field at z = 10 cm is weak (1.3 mT) and electron Larmor radius (~a few mm) is almost comparable with the collision mean free path.
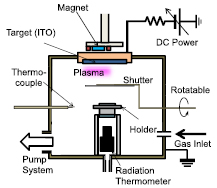
Figure 1. Experimental apparatus.
Download figure:
Standard image High-resolution imagePlasma density at z = 10 cm and Id = 0.3 A is measured by a Langmuir probe (0.1 mm diameter, 5 mm length), where influence of the magnetic field is considered to be small. Measured plasma density (n0) was 8 × 10¹⁵ and 5 × 10¹⁵ m−3 at r = 0 and 3 cm, respectively with an electron temperature (Te) of 4.3 eV irrespective of the radial position. Energy distribution of the O− ion is measured by the QMA-EA that is installed at the bottom of the vessel facing to the ITO target (not shown in the figure). By rotating the ring magnets, i.e. ring-shaped magnetron plasma, r dependence of the O− energy distribution is measured without moving the QMA-EA. A sheathed thermocouple (TC) of 0.5 mm in diameter is installed at z = 10 cm and is movable along the r axis. The metal sheath of the TC is grounded in this study. The heat flux is evaluated by calorimetry method where the temperature increase rate of the TC after opening the shutter is measured. A detailed structure of the TC is shown in figure 2. The sheathed TC is installed with a stainless-steel shield plate (width: 3 mm, distance from the TC: 10 mm). Debye shielding thickness evaluated from the plasma parameters is <0.5 mm, which is much thinner than the TC-shield plate distance. This confirms that the shield plate scarcely influences the plasma density in the vicinity of the TC. The shield plate enables us to discriminate anisotropic heat flux (high energy O− ion or infra-red radiation from the target) from isotropic heat flux (electrons and ions). Both the TC and the plate are connected to a rotatable stainless-steel tube as shown in figure 2 and angle-resolved measurement of the heat flux is realized. Absolute calibration of the heat flux is carried out from temperature measurement of very thin stainless-steel substrate (0.5 × 0.5 cm2, 0.1 mm thick) using a radiation thermometer from the backside of the substrate through a BaF2 window.
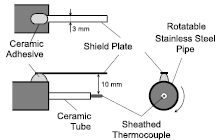
Figure 2. Thermocouple for the heat flux measurement.
Download figure:
Standard image High-resolution image3. Results and discussions
3.1. Measurement of O− ion by QMA-EA
Using the QMA-EA, various negative ions in the magnetron plasma are measured. From mass spectra of negative ions at various kinetic energies, abundant O− was measured with a negligibly small intensity of  . The result is consistent with our previous measurements of negative ions in the case of MgO [19, 20]. Hereafter, we focus on O− ion as the high-energy negative ion in the ITO sputter plasma. Figure 3 shows the O− energy distribution function (EDF) from r = 1.6 to 4.0 cm at a pressure of 0.2 Pa. Discharge voltage and discharge current are 280 V and 0.15 A, respectively. The O− EDF shows an intense peak at ~280 eV irrespective of the radial position. The measured O− energy (~280 eV) is the same as the energy accelerated by the target potential (280 V). This means that O− ions are produced on the target surface and are accelerated by the electric field of the cathode fall in the vicinity of the target surface. It should be also noted that the peak intensity shows its maximum at r = 2 cm. This result indicates that the O− ions are mostly produced at the plasma-ring position on the target surface and that the produced high-energy O− ions are ejected from the target perpendicularly from the target surface to the QMA-EA at z = 10 cm.
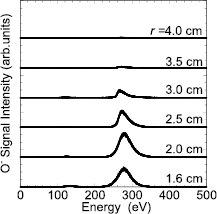
Figure 3. O− energy distributions at different radial positions.
Download figure:
Standard image High-resolution imageFigure 4 shows pressure dependence of the O− peak intensity at r = 2 cm and z = 10 cm. The O− peak intensity decreases almost exponentially with the Ar pressure. Axial and pressure dependences of high-energy O− flux Γ is expressed by the following equation

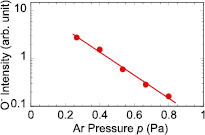
Figure 4. O− peak intensity as a function of the Ar pressure.
Download figure:
Standard image High-resolution imageHere, Γ0, σ and nAr are initial O− flux at the target surface, scattering cross section of O− by Ar and number density of Ar, respectively. From the result, we can derive the decay parameter K is 1.8 × 10⁻² Pa m, which is useful to correlate heat flux at different axial position.
3.2. Detection of energy flux originated from high-energy O− ion
Heat flux is measured using the calorimetry method [22]. To evaluate spatial profile of the heat flux using the calorimetry method, the TC is scanned across the vessel at z = 10 cm and temporal variation of the TC temperature is measured. Figure 5(a) shows an example of the TC temperature after opening the shutter. The TC temperature starts to increase just after opening the shutter and the temperature increase rate gradually decreases to a saturation temperature. Conservation of heat energy in the TC can be expressed in a simplified form as follows:
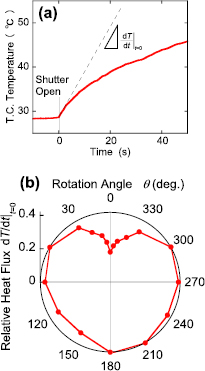
Figure 5. (a) TC temperature after opening the shutter and (b) relative heat flux as a function of TC rotation angle.
Download figure:
Standard image High-resolution imageHere, J is energy flux to the TC tip per unit area and time, S, C and A are surface area, heat capacity of the TC tip to receive the energy and cross section of the thermocouple, h is heat transfer coefficient between the TC tip at a temperature of T1 and the root of the TC wire at a fixed temperature T2. Supposing that the TC is at a thermally equilibrium condition before the plasma exposure, T1 is considered to be equal to T2. After opening the shutter (t > 0), the TC tip starts to receive the heat flux and the time-derivative of the TC temperature (dT1/dt) at t = 0 becomes proportional to the heat flux. From this, (dT1/dt)t=0 (slope of a broken line tangential to the temperature curve at t = 0) is measured as relative heat flux. Figure 5(b) shows the relative heat flux as a function of the rotation angle of the TC in the polar coordinate. The TC is positioned at r = 2 cm and z = 10 cm. Here θ = 0° corresponds to the direction where the shield plate of the TC is facing to the target. At θ = 0°, i.e. the condition that the heat flux directly coming from the target is shielded, decrease in the relative heat flux is clearly observed. The full-width at half-maximum of the heat flux dip Δθ is ~25°, which value is close to a shielding angle of the shield plate (~20°) calculated from geometrical structure of the TC and the shield plate. The result indicates the existence of anisotropic heat flux that reaches the TC from the direction of the target.
Next, the radial profile of the relative heat flux is measured both in the cases of with-shield (θ = 0°) and without-shield (θ = 180°) conditions, as shown in figure 6. When the shield is turned to the direction of the ITO target (θ = 0°), heat flux is rather uniform along r direction up to 2 cm and gradually decreases at r > 2.5 cm. Plasma density was measured by a Langmuir probe scanning along the radial direction at the same discharge condition, and the plasma density profile was similar to that of the radial profile of the relative heat flux. When the shield is turned around to the lower position (θ = 180°), localized increase of the heat flux is clearly observed at r ~ 2 cm.
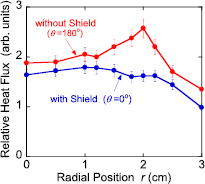
Figure 6. Radial profile of relative heat flux at rotation angles θ of 0° and 180°.
Download figure:
Standard image High-resolution imageIn magnetron plasmas, the solid surface is irradiated with various particle- and photon-fluxes including high energy O− ions. Total energy flux per unit solid surface and unit time J is composed of following heat fluxes.

Here, Ji, Je, Jrec, Jradt, Jradp, Jsp, Jbs and  are fluxes of ion impingement, electron impingement, ion recombination on the surface, radiation from the target, radiation from the plasma, aggregation and chemical reaction of sputtered particles on the substrate, backscattered Ar atoms and high energy O− ions, respectively. These heat fluxes are classified into two components according to the directionality of the heat flux, i.e. isotropic and anisotropic ones. Ji, Je and Jrec are considered as isotropic components, because the plasma surrounds the TC even in the case of the with-shield condition (θ = 0°). Jradt, Jradp, Jsp, Jbs and
  are considered as anisotropic components, because all fluxes are originated from the target. Furthermore, the anisotropic component can be classified into two. In the cases of Jradt, Jradp, Jsp and Jbs, their emission angle with respect to the target surface normal is broad and the resultant radial profile at z = 10 cm becomes rather smooth.
  , however, is different from Jradt, Jradp, Jsp and Jbs because
  is the only anisotropic flux where all of the emitted O− ions have strong directionality perpendicular to the target surface due to the accelerating E-field in front of the target surface. This behavior results in strong radial (r) dependence of the heat flux only in the case of the O− heat flux even when the axial position is far from the target surface. Considering the radial profile of high-energy O− (figure 3) and the present discussion, the peak of the heat flux at r ~ 2 cm is considered to be the heat flux originated from the high-energy O− ions. In figure 6, however, the difference of the relative heat flux is observed not only at r = 1.5–2.5 cm originated from O− ions, but also at other radial positions. We consider that the difference is due to the suppression of the plasma by the shield plate even though the distance between the shield plate and the TC is 10 mm. Taking account for the influence of the reduced plasma density, subtraction of the relative heat flux with the shield from that without the shield is made by multiplying a factor to the relative heat flux with the shield before the subtraction so that the relative heat flux at r ⩽ 1 cm to be suppressed.
To calibrate the relative heat flux obtained by the TC, a stainless-steel substrate (0.5 × 0.5 cm2, 0.1 mm in thick) is placed on a substrate holder at r = 2 cm and z = 10 cm and its temperature variation after opening the shutter is measured by the radiation thermometer. To eliminate influence of the film deposition on the emissivity and the resultant temperature measurement, the radiation thermometer is installed inside a substrate holder and the substrate temperature is measured from the backside of the substrate through a BaF2 window. A spacer is inserted between the substrate holder and the substrate to suppress thermal contact between them. Based on the temperature increase rate measurement, absolute heat flux is measured with the known substrate surface area and the heat capacity of the stainless-steel substrate. After calibration of relative heat flux (figure 6) and subtraction heat fluxes except for high-energy O− ions, absolute heat flux density of high-energy O− ions is obtained as shown in figure 7. From the result with an error observed in the experiment, a heat flux density of ~80 ± 20 W m−2 at r = 2 cm is obtained as the heat flux of high-energy O− ions. In the figure, the spread of the heat flux along radial position is about 1 cm at FWHM. Considering plasma ring radius (2 cm), plasma ring width (1 cm), target erosion radius (2 cm), erosion ring width (~1 cm) and erosion depth (~0.2 mm) the spread of the O− heat flux in radial position is due to the size of the plasma and slight influence of deflected high-energy O− ion from eroded target [23].
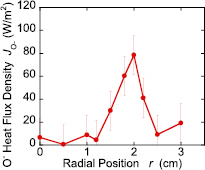
Figure 7. Radial profile of directional heat flux originated from high-energy O− ion.
Download figure:
Standard image High-resolution image3.3. Particle flux density of high-energy O− ion
From the heat flux measurement of O− ions, particle flux of high-energy O− ions can be evaluated. In the course of the O− impingement on the surface, however, not all their kinetic energies are converted into the heat and ratio of the heat flux to the incident O− energy flux must be discussed. Total energy  that is not used for the surface heating per incident O− ion is composed of (i) electron detachment energy from incident O− ion: EED, (ii) secondary electron emission by O− impingement: ESE, (iii) average kinetic energy of backscattered O atom:
  , and (iv) energy for ITO re-sputtering on the surface by O− ion impingement:
  , accordingly,
  is expressed as

Next, each energy values are discussed as follows. Firstly, energy for (i) the electron detachment EED is obtained from the literature [24] to be 1.5 eV. Secondly, (ii) energy lost by the secondary electron  is expressed as γSEEW, where γSE and EW are secondary electron emission probability and work function of the ITO film, respectively. EW is obtained from [25] to be 4.5 eV. However, γSE is not known for the ITO and γSE ~ 2 is adopted in the calculation, considering higher secondary electron emission for oxide surface [26]. Accordingly, ESE ~ 9 eV is obtained.
Thirdly, (iii) average energy loss due to backscattered O atom per one incident O atom is expressed as follows:

Here, EB is kinetic energy of each backscattered atom, f(EB) is energy distribution function of backscattered O atoms. In equation (5), backscattering yield γB is also taken into account. To evaluate energies lost by the backscattering  , the TRIM (transfer of ion in matters) code simulation is used [27]. The TRIM is a simulation based on the Monte Carlo method and simulates the trajectory of incident high energy atoms in the solid. From the simulation, sputtering yield and backscattering yield are obtained with energies and directions of backscattered and sputtered atoms. In this study, the O atom is supposed as the incident species, and 104 atoms are injected to a target of 36% In, 3% Sn and 61% O in the atomic ratio that corresponds to the ITO composition (In2O3/SnO2 = 0.9/0.1). Then, trajectory of each incident atom in the ITO film is calculated and the number of backscattered atoms is counted with their backscattering energies. Figure 8 shows simulated backscattering probability γB and average backscattering energy (
 =
=  ) per backscattered O atoms as a function of the incident O energy. In figure 8(a), the γB is ~14% at incident energies above 100 eV. In figure 8(b), the
  is almost proportional to the incident O energy Ei and from the slope,
  is approximately expressed by
  = 0.25Ei. From these results,
  (=γB
(=γB ) is calculated to be 8.6 eV at an O− incident energy of 244 eV.
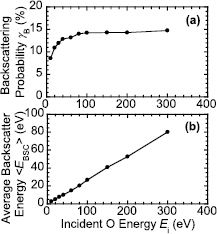
Figure 8. Simulated (a) backscatter yield and (b) average backscattering energy, of oxygen atom as a function of incident O energy.
Download figure:
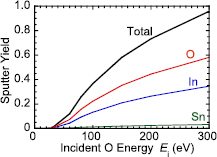
Standard image High-resolution imageFinally, (iv) energy lost by re-sputtering  is also calculated by the TRIM simulation. In the simulation, sputtered In, Sn and O atoms by the incident O atom is counted with their kinetic energies. Energy lost by the re-sputtering
  is expressed as
Here, the subscript i denotes each atomic species (In, Sn, O). γRS is sputtering yield of In, Sn and O per one incident O atom, ERS is kinetic energies of sputtered atoms, f(ERS) is energy distribution function of sputtered atoms.  and
and  are composition ratio of In2O3 and SnO2 in the ITO, respectively. In this study, composition ratio of In2O3/SnO2 is 9/1 in weight for the sputter target, and the composition of the deposited film is supposed to be the same with that of the ITO target.
  and
and  are energies to dissociate In2O3 and SnO2, and to produce one indium and tin atoms in the gas phase, respectively. From simulated result (figure 9), sputtering yields of In, Sn and O are 0.30, 0.03 and 0.50, respectively.
  and
and  are calculated to be 8.0 eV and 11.7 eV, using enthalpies of formation for In2O3 (922 kJ mol−1) [28] and SnO2 (577 kJ mol−1) [29], heat of vaporization for In and Sn atoms and O2 dissociation. From these values, energy required to release ITO atoms from the solid to the gas phase per one incident O atom is calculated to be 2.7 eV and considering kinetic energy of sputtered atoms (~5 eV) in average,
  is calculated to be ~8 eV. From the above discussion with some ambiguity of the data used for the calculation, total energy that is not used for the surface heating is obtained from equation (4) to be ~27 ± 5 eV per one incident O− ion at an incident energy of 244 eV. This means that almost 89 ± 2% of incident kinetic energy is used to heat the solid.
Figure 9. Simulated sputter yield of ITO as a function of incident O energy.
Download figure:
Standard image High-resolution image
From this result, particle flux of the incident high-energy O− ions is finally obtained to be 2.3 × 10¹⁸ ions m−2 s−1 with a random error of 25% and a systematic error of 2% at a position of z = 10 cm and r = 2 cm, an Ar pressure of 0.4 Pa and a discharge current of 0.3 A. As shown in figure 4, the O− flux decays exponentially with the Ar pressure and the result suggests that the O− flux decays also with respect to the axial position z. Using the parameter K obtained from figure 4, we can estimate the O− flux at the target position using equation (1) and its value becomes 2.0 × 10¹⁹ ions m−2 s−1. In the present study, FWHM of the erosion ring width on the ITO target is ~5 mm with a ring radius of 2 cm. From the erosion area, current path area on the target is estimated, and discharge current density is estimated from the current path area and the discharge current. As the resulting discharge current density at r = 2 cm is roughly estimated to be 960 A m−2. Secondary electron emission coefficient for the ITO with the Ar ion impact is not known and it is difficult to evaluate exact value of the incident Ar ion flux to the target, as well as the O− production probability per incident Ar ion. If neglecting the secondary electron emission current from the evaluated discharge current density, the maximum value of O− production probability per one incident Ar ion can be roughly evaluated to be 3.3 × 10⁻³ at an Ar ion impact energy of 244 eV. Although actual O− production probability is more than this value depending on the secondary electron emission coefficient, the O− production yield on the target is much lower than that of O sputtering yields (~0.5) or In, Sn sputtering yields. However, it should be noted that the flux ratio of high-energy O− to sputtered species varies depending on the axial position. As was mentioned, the O− ions are strongly accelerated by the cathode fall and are directed to the deposition surface with sharp directionality. Considering rather broad angular distribution of sputtered atoms from the target, flux ratio of the high-energy O− to the sputtered particles becomes much larger than the ratio of the production yield on the target with increasing the distance from the target.
4. Conclusion
In conclusion, O− ion flux from the ITO sputter target under Ar ion bombardment was quantitatively evaluated using a calorimetry method. Using a mass spectrometer with an energy analyzer, O− energy distribution was measured varying radial position of the magnetron ring. High-energy O− ion at an energy accelerated by the cathode fall was observed at a radial position corresponds to the magnetron plasma ring radius. Using a rotatable sheathed-thermocouple with a shield plate, heat flux originated from the high-energy O− ion was discriminated from other heat fluxes. After a calibration, heat flux density of 80 W m−2 was obtained for high-energy O− ion. Using the simulated results, the ratio of the kinetic energy flux to converted heat flux was evaluated. From the evaluation of absolute high-energy O− flux density, production yield of O− ion on the ITO target was estimated to be 3.3 × 10⁻³ as the minimum value at an Ar ion energy of 244 eV.