

Abstract
Time-resolved Kerr microscopy (TRSKM) has been used to explore the small amplitude picosecond magnetization dynamics induced by spin–orbit torques in a Ta(4 nm)/Co40Fe40B20(1 nm)/MgO(1.6 nm)/Ta(1 nm) Hall bar structure. The time dependent polar magneto optical Kerr effect was recorded following injection of a current pulse of 70 ps duration. Macrospin simulations provide a reasonable description of the precession and a transient background response as the field strength and current polarity are varied, while confirming that the in-plane spin–orbit torque is dominant within this system. Increasing the current density within the simulations leads to coherent magnetization reversal. Inclusion of a modest in-plane bias field is found to reduce both the switching current and the time required for switching. The orientation of the in-plane field relative to the direction of the current determines whether the magnetization can be switched backwards and forwards by current pulses of the same or opposite polarity.
Export citation and abstract BibTeX RIS
Introduction
Magnetic random access memory (MRAM) promises lower write currents and reduced volatility compared to existing dynamic RAM (DRAM) [1]. Information is encoded by using spin transfer torque (STT) to switch the magnetization of the 'free' layer in a magnetic tunnel junction (MTJ) structure, while the tunnel magnetoresistance (TMR) [2] allows the magnetic state of the free layer to be read back with high signal-to-noise ratio. Consequently, both TMR and current induced switching using STT have been the subject of extensive research [3–13]. MTJs with perpendicular magnetic anisotropy (PMA) are favoured for their high thermal stability and switching characteristics. While data may be written by injecting current into the free layer through the tunnel barrier, the required current densities lead to reduced device lifetimes. Therefore generation of STT by an in-plane current, by means of spin–orbit torques (SOTs) is particularly attractive.
Within heavy metal/ferromagnet/oxide trilayer structures, flow of current within the plane of the heavy metal leads to injection of a spin current into the ferromagnet, with an associated STT, due to the spin Hall effect (SHE). Due to the asymmetric interfaces of the ferromagnetic layer, additional STT may be generated by current flowing through the ferromagnetic layer due to the Rashba effect (RE). The SOTs may be conveniently characterized by magnetotransport measurements that are either essentially quasi-static [14, 15], or else are carried out in the frequency domain at microwave frequencies in the case of STT induced ferromagnetic resonance (STT-FMR) [7]. Picosecond time domain measurement techniques, such as time resolved scanning Kerr microscopy (TRSKM), are also able to determine the values of SOTs from the observation of small amplitude precessional oscillations, and may in principle be extended to the observation of large amplitude non-linear processes such as magnetization reversal.
Ta/CoFeB/MgO structures have shown particular promise for SOT induced switching [16–23]. Previous studies have used short electrical pulses (with duration from 300  s to 3 ns) to observe current driven and current assisted switching [4, 6, 21]. However, the response of the sample magnetization has not been measured on the ps timescales on which switching is expected to occur. Furthermore, there is continued debate about whether the STT has components parallel or perpendicular to the plane defined by the magnetization and the injected spin polarization vector, with layer thickness and fabrication conditions appearing to play a key role [17, 20].
In the present work, measurements of the polar magneto optical Kerr effect (MOKE) with an in-plane applied magnetic field are made to explore the static and dynamic properties of Ta/CoFeB/MgO Hall bars that possess PMA. TRSKM measurements show that the small amplitude magnetization dynamics induced by a current pulse with ps rise time are well described by the Landau–Lifshitz–Gilbert (LLG) equation and dominated by the action of the in-plane STT. By extending the simulations to larger current amplitudes, the conditions for current-induced switching are explored, paving the way to future studies of large amplitude dynamics by means of TRSKM.
Experimental set-up
A Hall bar of 20  140
140  m2 size with Au contacts, shown in figure 1(a), was formed from a Si/Ta(4 nm)/Co40Fe 40B20(1 nm)/MgO(1.6 nm)/Ta(1 nm) thin film produced by magnetron sputtering. Details of the fabrication process and characterisation by static Kerr microscopy and Hall resistance measurements have been reported previously [24]. In the present study, the probe beam of the TRSKM was used to record the out-of-plane component of magnetization, by means of the polar MOKE, using a polarisation bridge detector with two balanced photodiodes [25]. The beam was focused on to the Hall bar at normal incidence using the full aperture of the microscope objective. In this geometry the longitudinal MOKE cancels out and can only be recovered through the use of a polarisation bridge with quadrant photodiodes [26], albeit with somewhat reduced sensitivity. Wire-bonds were used to connect the Hall bar to the end of a 50
  coplanar waveguide (CPW), so that high frequency electrical current could be passed along the length of the Hall bar, parallel to the x axis. Current passing through the 4 nm Ta underlayer is expected to generate a spin current, with spin polarization parallel to the y axis, propagating perpendicular to the plane, into the CoFeB layer, by means of the SHE [27]. Low frequency current waveforms were previously shown to induce stochastic switching of the CoFeB magnetization by propagation of domain walls from the edges of the device [24]. In the present work, stroboscopic TRSKM measurements are used to observe deterministic magnetization precession, from which the nature of the driving torques can be inferred.
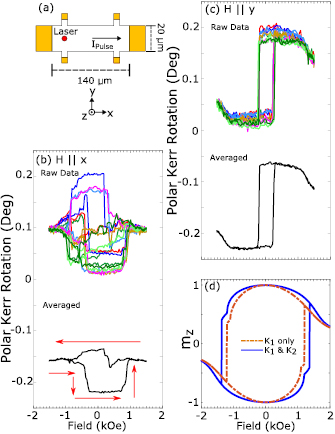
Figure 1. (a) Schematic of the Hall bar and co-ordinate system used, with beam spot position and direction of positive current indicated. Individual and averaged measured hysteresis loops for (b)  , and (c)
  . (d) Calculated loops are shown for H canted out of the plane by an angle of
  , assuming M = 1000 emu cm−3,
  erg cm−3, and K2 = 0 and
  erg cm−3.
Download figure:
Standard image High-resolution imageTheoretical framework
A macrospin model may be used to describe the static and dynamic behaviour of the CoFeB magnetization. The magnetic free energy density is assumed to have the form

where  is the magnetization vector,
  is a unit vector parallel to the magnetization
  ,
,  is the applied field, and K1 and K2 are the first and second order anisotropy constants that give rise to the PMA. The orientation of the static magnetization is obtained by minimising the energy density using a numerical nonlinear equation solver. Hysteresis loops may be calculated by obtaining a solution at a particular field value, and then using the obtained value as the starting point for the next calculation at a somewhat different field value. Typically the calculation begins by assuming quasi-alignment of
  with
with  at high field.
The dynamic response of the magnetization to an injected current can be calculated from the LLG equation
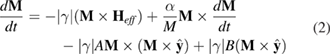
where the third and fourth terms on the right hand side are the 'in-plane' (in the plane defined by M and  , the direction of the injected spin polarization) anti-damping torque proposed by Slonczewski, and the 'out-of-plane' field-like torque. Here
  is the gyromagnetic ratio,
  is the effective field calculated from the gradient of the energy density with respect to the magnetization,
  is the Gilbert damping constant, and A and B define the amplitudes of the anti-damping and field-like torques respectively. An ordinary differential equation solver [28] may be used to calculate the trajectory of the magnetization in response to a time dependent current and/or magnetic field.
Experiment and modelling
Hysteresis loops of normalized out-of-plane magnetization mz in response to an in-plane static field were first acquired to explore the equilibrium orientation of the magnetization. Individual and averaged loops obtained for  and
and  are plotted in figures 1(b) and (c) respectively. For
  the switching process is highly repeatable. While propagation of domain walls may lead to switching at the coercive field, it is likely that the other sections of the loop are associated with coherent rotation of the magnetization.
A different behavior is observed for  , where loops repeated under similar conditions exhibit different shapes. While some of the individual loops may exhibit regions of coherent rotation, there are also numerous sharp transitions to intermediate values of the out-of-plane magnetization. With H applied in-plane and for H less than the saturation value, the magnetization may be canted into or out of plane with equal probability so that a domain structure is expected. Therefore the observed stochastic behaviour is most likely associated with domain walls entering and leaving the area of the focused optical probe spot that had ∼600 nm diameter. The loops in figure 1(b) demonstrate a higher level of repeatability as the field is swept from negative to positive values. Similar behaviour within CoFeB Hall bars has previously been attributed to nucleation of domain walls with a particular chirality due to the Dzyaloshinskii–Moriya interaction (DMI) [10, 29], although the DMI is expected to be small in the present case [30, 31].
The different behaviours observed in figures 1(b) and (c) may be attributed to either an in-plane magnetic anisotropy or to H being misaligned relative to the plane of the film by different amounts. Measurements made previously with an out-of-plane magnetic field yielded a coercivity of about 10 Oe. Given the coercivity of 280 Oe observed in figure 1(b), H would have to be canted by about ∼2° from the plane to yield an out of plane field component of similar magnitude. Misalignment of this order can be expected due to the construction of the quadrupole electromagnet used in the TRSKM. The sample sits on a stub between the four poles of a quadrupole electromagnet with pole face diameter of 10 mm. Given that the microscope objective must come close to the sample, and electrical feeds must enter between the poles without fouling upon them, it is often necessary to move the sample a small distance from the centre of the magnet where there may be a small deviation of the field direction that is difficult to characterise in situ. A canting angle of  was assumed for both the
  and
and  cases for the purposes of macrospin modelling, so as to better reproduce the field dependence of the precession frequencies that will be discussed later. The assumption of this tilt does not affect the conclusions drawn within this paper.
A calculated hysteresis loop is shown in figure 1(d). The macrospin calculations are not expected to reproduce the measured coercivity values which instead depend upon domain wall propagation. It should be noted that the inclusion of the higher order anisotropy term does not affect the saturation field when H is applied parallel to the sample plane, rather a positive value of K2 tends to flatten the top of the loop. On the other hand the detailed shape of the MOKE loops may not accurately reflect the field dependence of the out of plane magnetization component. The detailed shape of the averaged loop in figure 1(c) is different for positive and negative field values, and the top of the loop is less curved than that of an anomalous Hall effect (AHE) loop obtained from the same sample [24]. The AHE loop may contain contributions from the planar Hall effect, while higher order contributions can modify the MOKE loops [32], so that caution is required in interpreting the detailed shape of each type of loop. Assuming a value of M = 1000 erg cm−3 [12, 27], values of  erg cm−3 and
  erg cm−3 were found to best describe the time resolved data to be presented later, while providing an adequate description of the loop shape.
A small amplitude precession was excited by passing a current pulse of 70 ps full width half maximum (FWHM) duration parallel to the long x-axis of the Hall bar. The pulse reflected from the device was directed into an oscilloscope by means of a directional coupler. Figure 2(a) compares the pulse reflected from the device with that reflected from the cable to the device after it had been detached from the device fixture (the open circuit cable fully reflects the pulse). The amplitude of the pulse reflected from the device is smaller by a factor ∼2.5 and is broadened with some additional structure visible. This suggests imperfect impedance matching between the device and the connecting cable, most obviously at the wire bonds between the Hall bar and the CPW, and loss within the device, such that the detailed form of the pulse at the Hall bar sample is not known precisely.
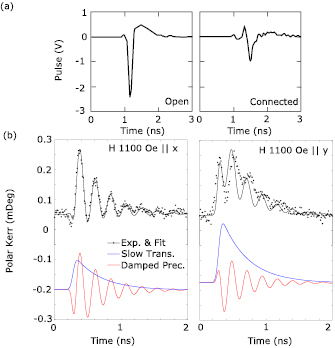
Figure 2. (a) Pulse reflected from the Hall bar device (right), and from the end of the open circuit connecting cable when detached from the device (left). (b) Time dependent polar MOKE for static field  and
and  . The black dots are the experimental points while the black line is a guide to the eye composed of a transient background (blue line) and a damped oscillation (red line). The black curve has the form
 ![$f_{pulse}(t)[a \sin(2\pi ft+\phi)+b]$](https://content.cld.iop.org/journals/0022-3727/52/35/355003/revision2/dab2693ieqn031.gif) with amplitudes a and b, frequency f , and phase
with amplitudes a and b, frequency f , and phase  . The pulse profile has the form
  with rise and decay times T1 = 0.05 ns and T2 = 0.290 ns respectively. For
  , a = 0.08, b = 0.06,
  , and t0 = 0.28 ns, while for
  , a = 0.06, b = 0.12,
  , and t0 = 0.29 ns.
Download figure:
Standard image High-resolution imageExamples of the resulting time dependent polar Kerr rotation signals are shown in figure 2(b) for  and
and  , together with a guide to the eye, which consists of a damped oscillatory term and a transient background. The temporal form of the transient background is the same for both measurements and is inferred to be similar to that of the current pulse within the Hall bar. The oscillations are well described by the damped sinusoid for
  , while an irregular variation of the amplitude of successive cycles of oscillation is observed for
  . This latter behaviour can be attributed to additional finer scale structure within the current pulse profile that can cause coherent suppression, or enhancement, of precession at certain frequencies [33, 34].
The time resolved data can be described by a numerical solution of equation (2). The simulations assumed the same values of M, K1, K2, and field canting angle as for the hysteresis loop represented by the dashed curve in figure 1(d). A value of  was found to give a reasonable description of the damping of the observed oscillations. This relatively large value may result from spin pumping into the Ta layer, and the combined effect of inhomogeneous broadening and two magnon scattering that has been found to occur in similar structures [35]. The pulse generator produces a pulse of 7 V (140 mA) amplitude and 70 ps FWHM duration. From figure 2(a) the pulse reflected from the device appears stretched in time to a few hundred ps duration, which is consistent with the 340 ps FWHM of the transient background in figure 2(b), and has its amplitude reduced by ∼60%. Therefore it is reasonable to assume that the peak current within the device is reduced by a factor of at least
  , yielding a value of 17 mA. In fact a slightly smaller value of 10 mA was found to give a better correspondence with the experimental data, suggesting some further loss within the device. This corresponds to a peak charge current density of
  A cm−2 within the Ta layer of the Hall bar, and an in-plane Oersted field of 3.1 Oe along the y axis at the middle of the Hall bar where the probe spot was positioned. The peak amplitude of the spin current density Js, in charge units, was assumed to be equal to that of the charge current density multiplied by a spin Hall angle of ∼0.08 [27] and an additional factor of 0.14 that may account for attenuation of the spin current within the Ta layer and finite spin transmission at the Ta/CoFeB interface. The amplitude of the in-plane STT terms has the form
  where d is the thickness of the CoFeB layer, leading to an effective field amplitude of
  Oe2. In the present case the out of plane STT has equivalent analytical form to the Oersted torque generated by the current, but its amplitude is expected to be small in the present material so that the value of B was set equal to zero.
The measured and simulated components of the normalized out of plane component of magnetization mz are shown in figure 3 for the case that a field H = 900 Oe is applied along either the x axis or the y axis, for all possible combinations of field and current polarity. As discussed previously, the polar hysteresis loops in figure 1(c) may contain higher order magneto-optical contributions, and so may not correspond directly to the hysteresis loop for the out of plane component of magnetization. The calculated hysteresis loops have therefore been used to determine the out of plane magnetization component for small field values. For H = 900 Oe the calculated hysteresis loop of figure 1(d) shows that M is in a canted state so that tracking the orientation of the different field and torque vectors is complicated. The simulations assumed that H was reduced from +1400 Oe to the stated value in each case. Therefore, for negative field values, the sign of the out of plane component of magnetization is assumed to have changed compared to that for positive field values. The absolute phase of the current pulse relative to the laser pulse is not precisely known and so the experimental curves were shifted in time to obtain agreement with the simulated curves. The current polarity was changed by introducing a polarity inverter of finite electrical length. Therefore experimental traces acquired for opposite current polarity were shifted by an amount that was different by 65 ps. Nevertheless a single set of material and experimental parameters is seen to provide a reasonable description of the signals obtained from all experimental configurations, when allowance is made for coherent suppression effects sometimes producing abrupt changes in oscillation amplitude between successive cycles. The most extreme example of coherent enhancement is seen in the lower left panel of figure 3, where the second antinode has larger amplitude than the first and the transient background appears enhanced.
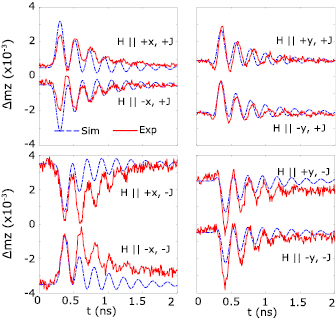
Figure 3. Comparison of experimental (red) and simulated (blue) out of plane magnetization component with a static field H = 900 Oe, applied along either the x or y axes, for all possible combinations of field and current polarity. The parameter values used within the simulations are described within the main text.
Download figure:
Standard image High-resolution imageThe dependence of the observed and simulated mz signals upon H is presented in figure 4. Again the same set of simulation parameters used in figure 3 is seen to provide good agreement between experiment and simulation. The largest differences are observed for  at the largest field values. The amplitude of oscillation is suppressed, presumably due to fine structure in the profile of the current pulse, as suggested previously in relation to figures 2(b) and 3. This accentuates the appearance of the transient background which is seen to increase as H is increased. The origin of this background, which is about a factor of two greater for
  compared to
  , can be explained. For large H values,
  lies close to
  so that for
  , the in-plane STT produces an effective field parallel to
  that lies normal to the plane of the sample and causes the transient deflection of
  out of the plane. Alternatively for
  ,
,  lies in the yz plane, so that
  lies parallel to the x axis. The vector addition of this field to the external field, applied parallel to
  , produces a total effective field with an increased component in the plane of the sample. Figure 1(d) shows that mz responds more strongly to this in-plane field component as H is increased, at least up to the maximum value of H used in the dynamic measurements. Therefore the transient background is expected to increase with H within this field range.
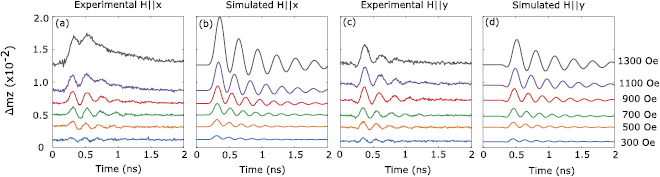
Figure 4. Comparison of simulated and experimental normalized out of plane magnetization component mz for different values of H, the static applied field. (a) experiment and (b) simulation for  . (c) experiment and (d) simulation for
  . The simulations assume the same material parameter values as used in figure 3, and are described within the main text.
Download figure:
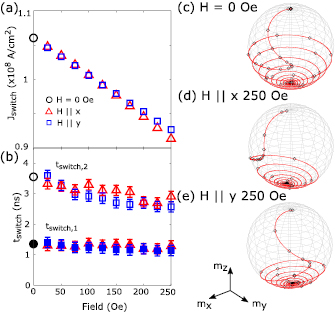
Standard image High-resolution imageThe macrospin model can also be used to describe the magnetization reversal induced by larger pulsed currents. Assuming identical material parameters and an identical temporal profile for the current to that used to describe the small amplitude precession, the current amplitude was increased until mz was observed to change sign. The minimum peak current density required for switching (Jswitch) for each static field value is plotted in figure 5(a). The relationship between Jswitch and H is observed to be close to linear, while a somewhat lower value of Jswitch is observed for  . A similar dependence of Jswitch upon H has been previously observed [21, 36, 37], however only for
  .
.
Figure 5. Macrospin simulations of current-induced magnetization reversal. (a) Minimum current density required for magnetization reversal for the case of no bias field (black circle),  (red triangles), and
  (blue squares). (b) Switching times tswitch,1 and tswitch,2 associated with the minimum current density in (a). Magnetization trajectories are plotted for the case of (c) no bias field, (d) H = 250 Oe applied parallel to
  and (e) H = 250 Oe applied parallel to
  . Open symbols are placed at intervals of 0.2 ns.
Download figure:
Standard image High-resolution image
Two measures of the time required for switching are plotted in figure 5(b). The first, tswitch,1, considers the time taken for  to cross the xy plane while the second, tswitch,2, considers the time taken for
  to switch from the equilibrium position for which mz > 0 to within
  of the other equilibrium position for which mz < 0. Increasing in-plane bias field is observed to lead to a reduction of tswitch,1 by
  and tswitch,2 by up to
  . Examples of the magnetization trajectory have been plotted in figures 2(c)–(e). It may be seen that
  moves to the xy plane during the first half-cycle of precession and then relaxes to the new equilibrium position over the course of a number of further cycles. In the absence of a bias field the magnetization spends more time near the xy plane before precessing towards the new equilibrium position. At any particular value of the bias field, increasing Jswitch causes both tswitch values to be reduced. While the orientation of the in-plane bias field is seen to have surprisingly little effect upon the switching times, it was found to determine the polarity of current pulses required to switch the magnetization back and forth. For
  , current pulses of opposite polarity are required to switch mz from positive to negative values, and vice versa, while for
  pulses of the same polarity are required. Again previous studies [6, 23, 37] have focused on the case of
  rather than that of
  . The single polarity switching observed in the latter case may offer additional freedom in future device design.
In summary, TRSKM measurements have been performed upon a Ta(4 nm)/Co40Fe40B20(1 nm)/MgO(1.6 nm)/Ta(1 nm) Hall bar to gain understanding of the spin–orbit torques present. The shape of hysteresis loops for the out of plane magnetization induced by an in-plane applied field suggests the presence of a higher order perpendicular magnetic anisotropy, that is also necessary to reproduce the observed frequency of precession. Macrospin simulations provide a reasonable description of the frequency and phase of precession as the field strength and current polarity is varied, while confirming that the in-plane spin–orbit torque is dominant within this system. Extending the simulations to the coherent magnetization reversal expected within single domain elements, the inclusion of a modest in-plane bias field is found to reduce both the switching current and the time required for switching, while its orientation determines the pulse polarity required to set and reset the magnetic state. Further TRSKM measurements are now required on Hall bar structures of smaller width so that larger current densities and hence dynamics of larger amplitude may be studied experimentally.
We acknowledge financial support from the Engineering and Physical Sciences Research Council (EPSRC) of the United Kingdom, via the EPSRC Centre for Doctoral Training in Metamaterials (Grant No. EP/L015331/1), and Grants No. EP/I038470/1 and EP/P008550/1. All data created during this research are openly available from the University of Exeter's institutional repository at https://doi.org/10.24378/exe.1443.