

Abstract
Stochastic fields can play a 'constructive' role in their interaction with quantum systems. In this paper, we demonstrate that the phase-diffusion field (PDF) in the terahertz range (THz) induces macroscopic polarization in molecular gas. We explain the observed effect using a simple model in which the PDF is treated as a series of ultrashort pulses of a regular signal, resulting in transient absorption in molecular gas. The experimental investigation of this effect is carried out using ammonia, and the PDF is generated by an oscillator based on stacks of Bi2Sr2CaCu2O8 intrinsic Josephson junctions. These radiation sources do not require a phase-lock loop system to provide high resolution, which simplifies the spectrometer considerably. The PDF radiation sources open up new horizons for the development of compact high-resolution THz spectrometers and applications thereof.
Export citation and abstract BibTeX RIS
1. Introduction
The rich history of studying the interaction of quantum systems with stochastic fields continues today. Research interest has been stimulated primarily by the development of nano- and biotechnology, for example in cases where the dynamics of single biological molecules and quantum qubits is affected by the resulting noise [1, 2].
The general view of the influence of noise is mostly restricted to destructive effects such as quantum decoherence [3] and imposed relaxation [4]. Moreover, noise is generally associated with hindrance, which hampers the transmission and detection of signals. However, the 'constructive' role of stochastic fields has also been demonstrated. Amplification of the probe field is possible in a three-level atom, driven by a strong coherent field and a weak stochastic field [5]. The authors of [6] showed that noise can create phase correlation between the neighbouring dressed states of the two-level atom, which results in anomalous modifications of the resonance fluorescence spectra. Moreover, appropriate tuning of the stochastic field can stimulate various effects: population inversion, photon anti-bunching, spectral linewidth narrowing, spectral linewidth broadening and both suppression and enhancement of spectral height [7, 8]. Thus, the stochastic field can be considered as a reservoir, whose properties may be engineered simply by changing its central frequency and other characteristics. Spectral noise introduced into the laser pulse can be used to improve the resolution and efficiency of coherent Raman spectroscopy [9]. We stress that the effects of the noise also strongly depend on the statistics of a field.
Consideration of the constructive effects and wide natural occurrence of various forms of noise produced by the environment or generated by external radiation sources opens up opportunities for employing these stochastic fields for the study and control of quantum systems.
Theoretical and experimental research into quantum systems under the influence of stochastic fields has historically been focused on optical effects in atoms, since lasers were the main radiation sources of noise for experimental measurements. One of the most important types of noise is the phase-diffusion field (PDF). It can be synthesized by extra cavity modulation of a frequency-stabilized continuous-wave laser [10].
The statistical characteristics of the PDF include phase fluctuation, while the amplitude is stabilized [11]. Fluctuating phases are assumed to be uncorrelated and to obey the Wiener–Levy stochastic process [12].
Experimental studies of the interaction of the PDF with atoms have been reported in several papers. Most of these studies considered strong stochastic fields and thus measured nonlinear optical effects such as two-photon absorption [13, 14], four-wave mixing [15], amplification of the probe field [16] and saturation effects in the fluorescence spectra [17]. The application of a non-saturating PDF for observation of the Hanle resonances in fluorescence spectra and the optical absorption spectra of atoms is presented in [18, 19], respectively.
The authors of [19] reported one of the first observations of high-resolution spectra in a radio-frequency range using the PDF signal. The radiation source was an IR diode laser with a stable amplitude and fluctuating frequency, and the output of the single mode was applied to a cell filled with Cs or Rb vapour. The transmitted signal was detected by an avalanche photodiode. Zeeman and hyperfine spectra in both the ground and excited states were observed simultaneously by frequency analyzing the intensity fluctuation of the light transmitted through a sample cell.
In this work, we study this effect in detail and demonstrate the detection of molecular spectra in the THz range using the PDF signal.
2. Methods
2.1. Oscillator fabrication
The radiation source employed in the experiment was an oscillator based on a stack of Bi2Sr2CaCu2O8 (BiSCCO) intrinsic Josephson junctions (IJJs). An IJJ is formed naturally in the BiSCCO unit cell, with the CuO2 layers forming the superconducting electrodes and the BiO and SrO layers forming the barrier layer [20]. A crystal of thickness of 1 µm contains about 670 IJJs. It was reported in 2007 that such stacks can emit coherent radiation at frequencies of up to 0.85 THz with a directly detected power of about 10 nW [21].
The intrinsic Josephson junction stack used in the experiments was fabricated from a slightly under-doped BiSCCO single crystal with Tc ~ 83 K, grown using a floating zone technique [22]. Some of the critical steps involved in the process are summarized as follows. Firstly, a gold layer of thickness 200 nm was deposited onto the surface of a cleaved BiSCCO single crystal, which was fixed on a silicon substrate using epoxy. Following this, a 1.1 µm thick rectangular-shaped mesa with dimensions of 350 × 70 µm was patterned by photolithography and argon ion milling. In the next step, the sample was contacted with a second (MgO) substrate with epoxy, and then transferred to the MgO substrate by cleaving, with its gold-covered face downwards. The freshly cleaved surface was immediately covered with a gold layer of thickness 100 nm. Finally, a piece of 300 × 210 µm rectangular photoresist was patterned using photolithography; the whole sample was then etched down to the bottom gold layer by ion milling, resulting in a 1.1 µm thick mesa with lateral dimensions of 300 × 70 µm in contact with the top and bottom gold layers [23].
2.2. Superconducting integrated receiver and spectral measurements
To carry out high-resolution spectral measurements, a superconducting integrated receiver (SIR) [24, 25] is implemented. The SIR [24] contains, on a single chip, a low-noise SIS mixer with a quasi-optical antenna, a flux-flow oscillator (FFO) acting as a local oscillator (LO) and a second SIS harmonic mixer (HM) for the FFO phase locking. All components of the SIR microcircuits are fabricated using a high-quality Nb-based tri-layer in one chip on a Si substrate. The receiver chip is placed on the flat rear surface of the silicon lens, forming an integrated lens-antenna. Continuous tuning of the phase-locked LO is realized at all frequencies in the range of 300–750 GHz. The output power of the FFO is sufficient to pump the matched SIS mixer within a wide range of frequencies and can be adjusted electronically. The free-running linewidth of the FFO is measured between 0.3 and 5 MHz, resulting in a spectral ratio for the phase-locked FFO of above 70% over the whole range. As a result of the optimization of the receiver, the DSB noise temperature is measured below 100 K, that is, about 4 hf/kB; the intermediate frequency range is 4–8 GHz and the spectral resolution is well below 1 MHz [25]. These parameters enable the development of a 450–650 GHz integrated receiver for various applications [25–27]. For the purposes of the measurements in this paper, the SIR frequency is phase-stabilized at 566 GHz in order to allow comprehensive measurements of the NH3 line at the intermediate frequency of around 6.5 GHz.
3. Results
3.1. Noise characteristics
Terahertz emission from intrinsic BiSCCO stacks can be obtained at both low-bias (where the temperature distribution in the stack is almost homogeneous) and high-bias (where an over-heated part and a cold part of the sample coexist) regimes [28, 29]. Application of the SIR allowed, for the first time, the measurement of radiation emitted from intrinsic Josephson junction stacks in both regimes with a spectral resolution of better than 1 MHz [29]. While at low bias we found that the linewidth was not smaller than 500 MHz, at high bias, the emission linewidth was shown to be in the range 10–100 MHz. We attribute this to the hot spot acting as a synchronizing element; emission in the high-bias regime was used for spectroscopic measurements. The frequency of the BiSCCO stack embedded between two gold layers [23] can be tuned in the range 450–800 GHz; improved cooling allows for a remarkable increase in emission frequency compared to previous designs.
To prove that the BiSCCO signal satisfies the PDF model, its amplitude and phase characteristics were studied. The results of the measurements of the amplitude fluctuations showed that deviation from the average value does not exceed 0.1% (figure 1(a)). A spectrum of the phase fluctuations is shown in figure 1(b). It can readily be seen that the spectrum is broad, meaning that the phase undergoes strong fluctuations. The spectrum of the signal, approximated by the Lorentz curve, is presented in figure 1(c). Thus, the results of the measurements demonstrated that the BiSCCO signal can be described by the standard PDF model with an exponential correlation function (see e.g. [11]). It should be mentioned that the emission characteristics of the BiSCCO oscillators depend on the bath temperature Tb [29]. The results presented here were obtained for a Tb of about 20 K, at which maximum emission power can be obtained; the temperature was controlled using a special heater installed near the oscillator. The SIR was situated in a different cryostat, and its temperature was 4.2 K.
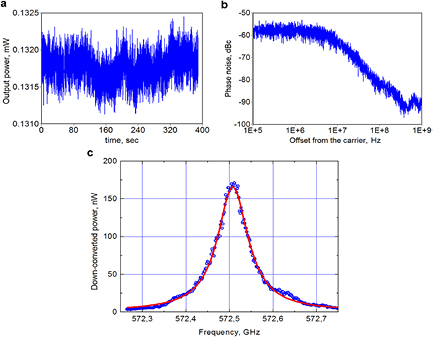
Figure 1. BiSCCO oscillator characterization. (a) Fluctuations of the signal power versus time, measured by a power meter. (b) Phase fluctuations of the oscillator signal. (c) Down-converted spectrum of the BiSCCO signal (blue circles) at 572.5 GHz, approximated by the Lorentz profile (red line) with a 3 dB linewidth of 83 MHz. The signal is measured by the SIR with the LO phase locked at 566 GHz and an intermediate frequency range 4–8 GHz (see section 2).
Download figure:
Standard image High-resolution image3.2. Absorption spectra of ammonia
The absorption spectra of ammonia mixed with water (10% solution) were probed using the setup illustrated in figure 2. Since the vapour pressure of ammonia is several orders of magnitude higher than that of water, the gas measured in the experiment was assumed to contain only ammonia molecules. The results of the measurements of the absorption line at 572.5 GHz (J = 0 → J = 1, K = 0) for different gas pressures are presented in figure 3(a). To extract the absorption line from the experimental data (figure 3(a)), we subtracted each ammonia absorption profile obtained at a given pressure from the background curve (at a pressure of 5 · 10−3 mbar). The background curve corresponds to the case where ammonia was absent from the cell. Examples of ammonia absorption lines are shown in figure 3(b). The experiment was performed under conditions that determine the Lorentzian profile of absorption lines.
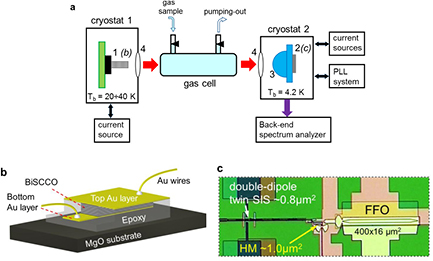
Figure 2. Experimental setup. (a) Block diagram of spectrometer setup: 1—BiSCCO mesa oscillator; 2—SIR mounted on 3—silicon lens; and 4—Mylar output and input windows of the cryostats. Red arrows show the emission detected by SIR. (b) Sketch of the BiSCCO oscillator. (c) Image of the central part of the SIR microchip.
Download figure:
Standard image High-resolution image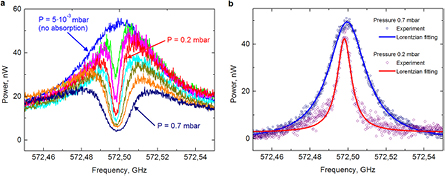
Figure 3. Absorption lines of ammonia at 572.498 GHz. (a) Lines were measured for pressure in the range 5 · 10−3–7 · 10−1 mbar (from top to bottom). (b) Absorption lines at two pressures approximated by the Lorentzian profile.
Download figure:
Standard image High-resolution imageTo compare the theory with the experiment, we calculated the ratio α between incident P0 and absorbed radiation power ΔP:
The ratio is directly connected to the absorption coefficient of molecular gas according to Beer's law:

where γ is the absorption coefficient of gas and l is the length of a gas cell. (In our experiment l = 50 cm.)
The calculation of the ratio α from the experimental data must take into account the power losses along the path taken by radiation from a source to a detector. Therefore, in applying Beer's law to our studies we adopt a simple model of losses,

where Pm is the transmitted power measured in the experiment, P0 is the incident power, coefficient x takes into account power losses due to the radiation pattern of the source and the reflection from the cell's wall, and y is the power loss along the optical path due to the radiation pattern of the detector. Coefficient y can be excluded by measurements of the power Pv transmitted through a vacuum cell.
Then, for the ratio α we have:
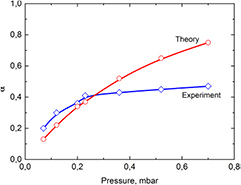
Coefficient x is usually in the range 0.5–1 and can be used as an adjustable parameter. The ratio α, calculated with expression (4) for x = 0.65, P0 = 165 nW and Pv = 55 nW, is shown by diamonds in figure 4.
Figure 4. Dependence of the ratio α on pressure. Experimental (blue diamonds) and theoretical (red circles) results are shown. Solid curves are basic splines and are given as a guide to the eye.
Download figure:
Standard image High-resolution image
3.3. Analysis of interaction: transition absorption in the case of PDF.
In our analysis, we use a model that was proposed in [30]. It was theoretically shown that in the short time regime, where t ≪ tc (tc is the correlation time of the PDF), the noise acts like a coherent signal, inducing polarization in a quantum system. The induced polarization, Pi, can be described with a model of a coherent signal with the amplitude divided by  (
( ):
):
where E0 is an amplitude of the probe field, d12 is a dipole matrix element taken for resonance transition, n0 is a population difference, Ω is a Rabi frequency and τ is a molecular (rotational) relaxation time. Here we assume the transverse relaxation time, T2, to be equal to the longitudinal relaxation time, T1: T1 = T2 = τ. (Let us underline the fact that low incident power and high gas pressures prevent the effects of the relaxation time decreasing from appearing, see [30].) In this case, the relaxation of macroscopic polarization is determined by intermolecular collisions. Thus, we took τ as equal to Δω−1, where Δω is a HWHM of the ammonia absorption line, derived from the experiment. The population difference, n0, is given by statistical distribution for symmetric-top molecules [31]:
where ρ0 is a concentration of molecules, the nuclear spin is I = 1/2, the rotational constants are B = 298,1 GHz and C = 186,7 GHz [32], the temperature is T = 297 K, the vibration statistical weight is  and k is the Boltzmann constant. To calculate the concentration ρ0, we use the experimental value of pressure and apply the ideal gas law.
The PDF can be considered as an ultrashort pulse with length tc, interacting with the quantum system. Furthermore, the tc is a short relative of the relaxation processes in the molecular gas that results in the phenomenon of transient absorption. Then, for tc > t, the PDF 'loses' its coherence and the molecules emit radiation.
The average power (in unit volume) used for inducing macroscopic polarization  by the electric field
  is given by [33]:
where the vinculum means time averaging. Consider that the vectors  and
and  are parallel to the x axis and can be expressed as


where  is a unit vector and
  and
and  are the real and imaginary parts of macroscopic polarization, respectively.
For the initial conditions  , equilibrium population difference
  and simplification T1 = T2 = τ, we have
  , and the expression for
  is given by (5) [34]. Applying (5) to expression (7), and providing averaging over tc, we arrive at the following expression:
Then, combining (10) with  , and taking into account the fact that according to Beer's law
where I is the intensity, and  , we obtain an expression for γ(ω):
The dependence of α on pressure calculated using (2) and (11) is plotted in figure 4 using circles.
4. Discussion
Despite the simplicity of the proposed model, the experimental and theoretical curves (figure 4) show good agreement. The greater difference between the experimental and theoretical curves at pressures higher than 0.4 mbar is likely to be due to the variation in the ammonia content of the vapour. Since the saturation pressure of ammonia is much higher than that of water, ammonia evaporates first. Furthermore, its content decreases slightly, resulting in experimental values of α which are lower than theoretical ones.
The results of the study and an analogy with ultrashort pulses imply that the PDF sources may be employed for the observation of transition processes in the range including microwave, THz and IR frequencies. Observation of the transition phenomenon in conventional microwave physics is performed using very short electromagnetic pulses. In our case, the noise field does not need to be switched off, since its inherent characteristics provide two regimes of interactions simultaneously. Another important difference involves the fact that for tc > t the PDF still interacts with the quantum system [30] and can significantly change the relaxation times during emission, provided that the power is strong enough. In the conventional case (when the pulse is switched off), however, the free induction decay is determined solely by the properties of the molecular system (molecular collisions, for example). The requirements for high sensitivity force conventional experimenters to work with pressures that determine the relaxation time in microseconds and even smaller units of time. This means that transition processes have to be observed in periods that are much smaller than a microsecond. The application of a PDF with a wide frequency band would thus provide a short interaction time without complicating experiments.
Furthermore, it should be emphasized that this work and [19] employed a non-saturating PDF. For saturating fields, the theory predicts a strong decrease in relaxation time, population inversion and repeated induction of macroscopic polarization [30]. The latter may be similar to the photon echo effect observed in regular fields. Experimental proofs and studies of these phenomena, depending on the PDF parameters (central frequency and intensity) and statistics, can not only provide new information about light–matter interaction, but may also provide a method of controlling quantum systems.
The practical aspects involve the application of phase-diffusion signals in high-resolution spectroscopy, especially in the THz range. Until recently, the only spectrometer employing a noise radiation source in the IR and THz ranges was the Fourier transform spectrometer, based on a mercury lamp or heated ceramic plate ('globar'). These radiation sources generate almost 'white' or 'coloured' noise. The conditions necessary to obtain molecular spectra with this spectrometer include the use of a Michelson interferometer. This provides a signal with a non-zero average value and a restricted spectrum. The spectral resolution of the Fourier transform spectrometer is determined by the finite path (maximum retardation) of a moving mirror that technically limits the resolution to 0.001 сm−1, which is insufficient for gas spectroscopy. To obtain a high resolution and allow the discrimination of gas absorption lines, sources with extremely narrow generation lines are typically used.
Today a cornerstone of high-resolution THz spectroscopy is a generator that provides tunable radiation with a linewidth that is much narrower than that of gas absorption lines. One of the first generators applied was a backward-wave oscillator (BWO), which operates mostly in the microwave and sub-terahertz (sub-THz) frequency ranges [35]. The maximal generation frequency is about 1.5 THz. The advantages of the BWO for high-resolution spectroscopy include wide tuning and power of up to mW. Another radiation source that is suitable for high-resolution spectroscopy is a generator based on amplification and multiplication chains driven by microwave sources, for example AWG and Gunn generators. The multiplication chains can achieve milliwatt power levels into the sub-THz range. They are commercially available [36] and operate in many spectrometers (see, e.g. [37, 38]). Most measurements in the THz range are made on gas absorption lines with widths ranging from 100 kHz to a few megahertz, and the probe radiation linewidth is therefore required to be about 1 kHz. This is enabled by application of the phase-lock loop (PLL) system, which has to be combined with a tuning system, considerably complicating the design of the instrument [39]. Moreover, observation of the transient effects would require manipulation of the probe radiation at timescales smaller than a microsecond, which further complicates the technique. THz radiation sources without PLL, such as difference frequency generation using two CW optical lasers in a photomixer [40], provide a frequency resolution of several MHz [41], and this is not always sufficient. PDF radiation sources do not require a PLL system, thus substantially simplifying the spectrometer. At the same time, the spectral resolution is determined by the characteristics of the receiver. The power of the PDF source used in the experiment is less than that of conventional radiation sources and is estimated to be about 10 µW; however, the use of a high-sensitivity receiver enables the detection of molecular absorption lines. We anticipate that further development of superconducting technologies will yield oscillators that meet all the requirements for high-resolution THz technology.
5. Conclusions
In summary, this work demonstrates the surprising result that a simple model can describe the effects of the interaction of a PDF with a molecular gas. The PDF can be considered as a series of ultrashort pulses of a regular field. Tests performed on ammonia with a BiSCCO generator demonstrate good agreement between experimental and theoretical data. The application of PDF radiation sources opens up new horizons for molecular spectroscopy. The short interaction time is suitable for the observation of transition absorption and emission, and the detection of unstable molecules and radicals. Furthermore, radiation sources with a wide generation band are able to probe several absorption lines simultaneously without frequency tuning. The PDF source does not require a phase-lock system, and provides a method for the development of a compact THz spectrometer with high resolution.
Acknowledgments
The work is supported by Ministry of Education and Science of the Russian Federation (project no. 14.607.21.0100, ID RFMEFI60714X0100).
Author contributions
ES, NK and VK performed the experiments; MJ, ML and HW fabricated the BiSCCO emitters; NK and VK elaborated the SIR data; ES and VV made theoretical calculations and analyzed the data; ES, NK, VK and VV wrote the paper.