
Abstract
Spectra of laser-produced plasmas of cerium have been recorded in the 1.5 to 15.5 nm spectral region. The plasmas were formed using the frequency doubled pulsed output of a neodymium-doped yttrium aluminium garnet (Nd:YAG) laser at 532 nm. At the power densities incident on-target, ranging from 8.6 × 10⁹–2.1 × 10¹³ W cm−2, Ce4+ to Ce27+ ions gave rise to emission from Δn = 0, 1 transitions to final states where n = 4. The spectra are dominated by an intense unresolved transition array (UTA) in the 8–10 nm region arising from n = 4 to n = 4 transitions. Two distinct components of this UTA are observed whose appearance is strongly dependent on laser power density, corresponding to transitions involving ions with open 4d and open 4f subshells, the latter at longer wavelengths. Multiple other transition arrays are identified and UTA statistics are given. The analysis was aided by atomic structure calculations and the use of a steady state collisional-radiative model.
Export citation and abstract BibTeX RIS

Original content from this work may be used under the terms of the Creative Commons Attribution 4.0 licence. Any further distribution of this work must maintain attribution to the author(s) and the title of the work, journal citation and DOI.
1. Introduction
Laser produced plasmas (LPPs) are formed when high-power laser pulses are incident on a solid, liquid or gaseous target. They have been exploited for emission and absorption spectroscopy of atoms [1], ions [2] and molecules [3]. LPPs have been deployed in laser induced breakdown spectroscopy (LIBS) to measure surface quality, composition and contamination [4, 5].
In recent years LPPs have been developed as sources of extreme ultraviolet (EUV) and soft x-ray (SXR) radiation for applications including semiconductor processing [6] and microscopy on the nanoscale [7]. Tin plasmas formed on liquid microdroplets are the chosen source for EUV lithography applications and these sources, operating at 13.5 nm, entered industrial production in 2018 [8]. At shorter wavelengths between 2.33 nm and 4.40 nm, the K-edges of oxygen and carbon respectively, in the 'water window', liquid nitrogen jet targets [9] and solid targets [7] are being developed as sources for laboratory-scale SXR microscopes. The intense spectral feature at 13.5 nm in the tin LPP spectrum is an unresolved transition array (UTA), a result of 105–106 overlapping transitions in a narrow band typically 1 nm in width. The UTA was initially thought to primarily arise from resonance 4p64dN to 4p64dN−14f + 4p54dN+1 (4–4) transitions in open-4d subshell ions, in this particular case ranging from Sn10+ to Sn14+. However, it has been recently shown that the bulk of the emission originates from multiply excited 4–4 transitions in ions where there is reduced occupancy in the 4d subshell [10] which serves to broaden the UTA, thus resolving the observation that in a Sn LPP the width of the array was always greater than that predicted from consideration of resonance transitions alone. The effect of such transitions within a single stage was already demonstrated in charge exchange experiments [11]. In the elements from tin (Z = 50) to bismuth (Z = 83) this UTA shifts to shorter wavelength [12], reaching its narrowest profile at cerium (Z = 58), where it lies at 8.8 nm. The narrowness of this feature is attributable to the overlap between the 4d and 4f wavefunctions, reaching a maximum at cerium due to the contraction of the 4f wavefunction with increasing ionisation, the proximity of 4p–4d and 4d–4f transition energies and the relatively small spin orbit splitting of the 4p subshell [13].
Features due to n = 3–n = 4 and n = 4–n = 5 transitions dominate at shorter wavelengths in the LPP spectra of these elements. Unlike the 4–4 UTAs, these transition arrays shift to shorter wavelength with increasing ionisation, resulting in a series of modulations in the SXR spectrum. These features also shift to shorter wavelength with increasing atomic number. This provides the possibility to tune the emission characteristics of the plasma by choice of target element, in addition to varying the laser pulse parameters.
Recent studies of LPPs in the EUV/SXR spectral region illustrate n = 3–n = 4 and n = 4–n = 5 transitions in addition to n = 4–n = 4 arrays, as well as individual lines and groups of lines. Wu et al [14] report spectra, between 1.0 and 8.5 nm, of ytterbium plasmas formed by pulses from a neodymium aluminium-garnet (Nd:YAG) laser operating at the fundamental wavelength of 1064 nm. Transitions from the 4p and 4d subshells in ions ranging from Yb13+ to Yb34+ are identified. Wu et al [15] report studies of holmium ions in the same spectral region using plasmas formed with Nd:YAG pulses of both 6 ns and 170 ps duration. Ionisation stages ranged from Ho17+ to Ho36+, with n = 4–n = 4 and n = 4–n = 5 transitions dominant in the spectra. Lokasani et al [16] performed a study on samarium plasmas, formed with Nd:YAG pulses of 150 ps duration. n = 4–n = 4 and n = 4–n = 5 transitions were again the principal features in the spectrum, with ions observed ranging from Sm12+ to Sm31+. Li et al [17] presented analysis of hafnium and tantalum plasmas in the 1 to 7 nm region, formed with Nd:YAG pulses of 10 ns and 170 ps duration. With the 10 ns pulses the highest ion stages achieved were Hf25+ and Ta26+, both of which have a closed 4d subshell. Using the 170 ps laser pulses the 4d subshell was opened up in the ions in the plasma, as evidenced by the appearance of 4d–5p transitions. A significant enhancement of emission from the tantalum plasmas was observed using pre-pulses to preionise the solid target, leading to increased coupling of the main laser pulse into the target plasma. Sheil et al [18] analysed SXR emission from LPPs of dysprosium, erbium and thulium, formed with 1064 nm pulses of 6 ns duration from a Nd:YAG laser. The power densities on target ranged from 1.3 to 6.6 × 10¹² W cm−2 yielding a maximum ion stage of Tm32+. In addition to transition arrays, some single transitions along the Ag-like, Pd-like, Rh-like and Sr-like isoelectronic series were identified. An investigation by Churliov et al into gadolinium and terbium vacuum spark and LPP sources [19] identified 4d–4f and 4f–5d transitions in multiple ion stages, highlighting the UTA emission at 6.78 and 6.54 nm respectively. Both elements have been of interest as potential candidates for beyond EUV (BEUV) lithography in a technology to replace tin-plasma based tools with a shorter operating wavelength in the region of 6.7 nm [20, 21]. These, and other investigations concentrated on optimising the emission from Pd-like and Ag-like ions in the plasma [22].
Cerium ions have been the subject of multiple spectroscopic studies, typically using triggered vacuum sparks [23], tokamaks [24] and laser plasmas [25]. Many of these studies followed isoelectronic sequences as systematic trends greatly aided identifications and analysis. As with the bulk of the rare earth elements, cerium spectra in the EUV and SXR regions are complex, presenting large regions of quasi-continuum, modulated by UTA features, and interrupted by groups of lines and few strong individual lines. Here, the cerium target was irradiated at 532 nm in order to examine the spectra of higher density LPPs, specifically to investigate weaker transitions, whose intensity is expected to be enhanced by the higher density of emitting ions. However the increase in ion density also increases the plasma opacity for stronger transitions. Since the plasma electron temperature varies according to (λ2 ϕ)n [26], where λ is the laser wavelength, ϕ is the power density and n = 0.6 for a simple collisional radiative (CR) equilibrium model, the reduced plasma electron temperature resulting from the reduced laser wavelength is somewhat compensated for by the tighter spot size, and hence the higher power density, obtained when 532 nm light is focused compared to 1064 nm light. Plasma opacity and the presence of multiple ion stages in the plasma increase the difficulty of the spectral analysis. In the current study varying the power density of the laser pulse incident on the target aided in the identification of lines and groups of features as they tend to rise and fall in intensity with changes in plasma electron temperature.
2. Experimental procedure
A plano-convex lens with a focal length of 50 mm was used to focus pulses from a Q-switched Continuum Surelite III Nd:YAG laser (full width at half maximum (FWHM) = 4.7 ± 0.15 ns), at normal incidence, onto a planar cerium target in vacuum (10−4 mbar). Some surface oxidation was present on the target, whose removal by mechanical means left a smooth, but not polished finish. The laser operated at its second harmonic with a wavelength of 532 nm and with a repetition rate of 10 Hz. Both the cerium target position, and that of the lens, were controlled under vacuum using motorised stages to both vary the distance between the lens and the target and to ensure a fresh area of target was presented for each shot. The pulse energy was kept constant at 155 ± 15 mJ. The distance between the lens and target was adjusted to vary the power density on target. The power density ranged from 8.6 × 10⁹–2.1 × 10¹³ W cm−2.
The spectra were recorded at 45° to the target normal using a 0.25 m flat-field grazing incidence spectrometer with a 1200 grooves/mm Shimadzu grating equipped with a cooled, back-illuminated, x-ray ANDOR DX436-BN charge-coupled device (CCD) camera. The resolving power λ/Δλ is 195 at 2.878 nm [27]. Spectra from individual laser pulses were recorded between 1.5 and 15.5 nm and were corrected for background noise signals on the CCD camera. Lines from LPPs of carbon, copper and reaction bonded silicon nitride were used to perform a wavelength calibration. Previously identified lines in the spectrum of cerium, for example the 4f–5g and 5s–6p transitions in Ce11+ [28], found in the current spectra were also used in the calibration. The calibration yielded maximum residuals of 0.0097 nm, while the pixel spacing in the CCD camera ranged from 0.005 nm per pixel at 2 nm to 0.009 nm per pixel at 12 nm.
3. Calculations
Atomic structure calculations using the Cowan code [29] were undertaken to aid identification of the features in the spectra. Multiple configurations were included in the input to account for configuration interaction. For spectra of open 4f subshell ions, i.e. below Ce12+, configurations listed in table 1 were included along with the corresponding 4d–4f excited state, with the exception of those lying above the ionisation potential of the relevant ion, which are identified with an asterisk*. For Ce9+, Ce10+ and Ce11+, extra configurations were included to account for higher-lying excited states. For spectra of open 4d shell ions, that is Ce12+ to Ce 21+, configurations of the type 4p64dk , 4p64dk−15s1, 4p64dk−1np1 (n = 5–7), 4p64dk−1nf1 (n = 4–7), 4p54dk+1, 4p54dk ns1 (n = 5–7), 4p54dk nd1 (n = 5–7), 4p64dk−25s15p1, 4p64dk−25s1nf1 (n = 4, 5) were included for k = 1–10, except 4p54dk+1 where k ranged from 1 to 9, and 4p64dk−25s15p1, 4p64dk−25s1nf1 where k ranged from 2 to 10.
Table 1. Table showing the lower configurations in Ce4+–Ce11+ and the corresponding configuration average energy (Eav) calculated using the Cowan code. Marked with an asterisk* are configurations whose Eav values lie above the ionisation potential.
| Ce4+ | Ce5+ | Ce6+ | Ce7+ | ||||
|---|---|---|---|---|---|---|---|
| Config. | Eav (eV) | Config. | Eav (eV) | Config. | Eav (eV) | Config. | Eav (eV) |
| 5s25p64f0 | 0 | 5s25p54f0 | 0 | 5s25p44f0 | 0 | 5s25p34f0 | 0 |
| 5s25p54f1 | 16.2 | 5s25p44f1 | 14.2 | 5s25p34f1 | 12.1 | 5s25p24f1 | 9.8 |
| 5s25p44f2 | 35.2 | 5s25p34f2 | 31.5 | 5s25p24f2 | 27.5 | 5s25p04f3 | 39.1 |
| 5s25p34f3 | 56.5 | 5s25p24f3 | 51.3 | 5s25p14f3 | 45.5 | 5s25p14f2 | 23.0 |
| 5s25p24f4 * | 79.7 | 5s25p14f4 | 73.2 | 5s25p04f4 | 65.8 | 5s15p04f4 | 73.3 |
| 5s25p14f5 * | 104.2 | 5s25p04f5 * | 96.6 | 5s15p54f0 | 22.7 | 5s15p24f2 | 41.9 |
| 5s25p04f6 * | 129.6 | 5s15p64f0 | 23.2 | 5s15p34f1 | 30.3 | ||
| Ce8+ | Ce9+ | Ce10+ | Ce11+ | ||||
|---|---|---|---|---|---|---|---|
| Config. | Eav (eV) | Config. | Eav (eV) | Config. | Eav (eV) | Config. | Eav (eV) |
| 5s25p24f0 | 0 | 5s25p14f0 | 0 | 5s25p04f0 | 0 | 5s15p04f0 | 0 |
| 5s25p14f1 | 7.4 | 5s25p04f0 | 4.7 | 5s05p14f1 | 42.6 | 5s05p04f1 | 18.6 |
| 5s25p04f2 | 18.2 | 5s05p14f2 | 51.7 | 5s05p04f2 | 44.9 | 5s05p14f0 | 23.1 |
| 5s15p04f3 | 48.8 | 5s05p24f1 | 46.6 | 5s05p24f0 | 44.1 | ||
| 5s15p14f2 | 36.5 | 5s05p34f0 | 45.4 | 5s15p14f0 | 20.4 | ||
| 5s15p24f1 | 27.3 | 5s15p14f1 | 24.1 | 5s15p04f1 | 20.6 | ||
| 5s15p34f0 | 21.6 | 5s15p04f2 | 30.7 | ||||
For Ce22+ to Ce27+ configurations of the type 4s24pk , 4s24pk−1np1 (n = 5, 6), 4s14pk 5s1, 4s14pk 4d1, 4s24pk−14f1, 4s24pk−1ns1 (n = 5–7), 4s24pk−1nd1 (n = 4–7), 4s14pk+1, 4s14pk 5p1 were included for n = 1–6 except for 4s14pk+1 which was included for n = 1–5.
Transitions from n = 6 and n = 7 levels are not expected to appear in the spectra presented here since their collisional ionisation lifetime is significantly shorter than that for radiative decay, but were included for completeness of the overall calculation. For the bulk of the ions the calculations were run with the electrostatic integrals, FK , GK and RK , scaled to 85% of their ab initio values while the spin–orbit integrals, ζ, were maintained at 99% [18]. However, for spectra up to Ce XII, and for Ce XIII the integrals were scaled at 75% and 81% respectively, with the spin–orbit integral unchanged. These scalings resulted in the best fit of the strongest 4d–4f line in each of these spectra, the latter of which, at 8.92 nm, has already been identified as 4d10(1S0)–4d94f(1P1) by Churilov [25]. The synthetic spectra seen in figures 2 and 3 were formed using the gA values obtained from the Cowan calculations. The gA values were obtained for each transition within an ion, then convolved with a Gaussian with a FWHM value representative of the resolution of the spectrometer. Any values below 0.01% of the maximum were removed to reduce computational demands while maintaining the shape of the spectrum. The gA values of each transition for each ion stage were then normalised to the maximum gA value.
4. Results and discussion
A simple CR plasma model [26] shows that the bulk of the incident laser radiation is absorbed close to the critical density of the plasma, which is approximated as 1021/λ (μm) cm−3. The 2nd harmonic of the Nd:YAG laser has a wavelength of 532 nm, leading to a critical plasma density of 4 × 1021 cm−3. The shorter wavelength also leads to cooler plasmas than those formed with 1064 nm fundamental Nd:YAG pulses, the electron temperature having a dependence on λ1.2. The increased density of plasmas formed with 532 nm radiation enhances the influence of weaker transitions on the spectrum and can lead to absorption effects playing a larger role in the observed spectrum.
Spectra of cerium LPPs at three representative power densities (2.1 × 10¹⁰ W cm−2, 2.0 × 10¹¹ W cm−2 and 1 × 10¹³ W cm−2) are shown in figure 1 in the range 1.8 to 12 nm. These correspond to electron temperatures (Te) of 9 eV, 33 eV, and 347 eV respectively calculated according to [26] with average ionisation states of 5+, 8+ and 18+ respectively. However, there are limitations to this calculation. Firstly, the calculated Te only applies to a relatively small region of the plasma, in general the rest of the plasma is at a lower temperature. Also to be noted is that the spectra here are time integrated over the lifetime of the plasma and hence also record photons emitted from the plasma as it formed, and also as it expands and cools. This results in a significant radiation emission from ions lower than the electron temperature would suggest. Hot spots in the beam can lead to higher power densities than estimated from simple calculations based on pulse energy and duration alone. In addition, multiphoton ionisation processes can also occur within LPPs and result in the production of higher ionisation stages than would be expected by electron temperature alone. For example, optimal emission from the UTA at 13.5 nm (92 eV) in tin LPPs occurs for Te ≈ 30–50 eV [30, 31]. A power balance model [32] predicts a lower electron temperature than the simple CR model, for example, at a power density of 1 × 10¹³ W cm−2 it predicts an electron temperature of slightly above 100 eV for a plasma formed with 532 nm radiation. Moreover, from figure 3, emission from ions at least up to Ce21+ are seen to contribute to the overall emission.
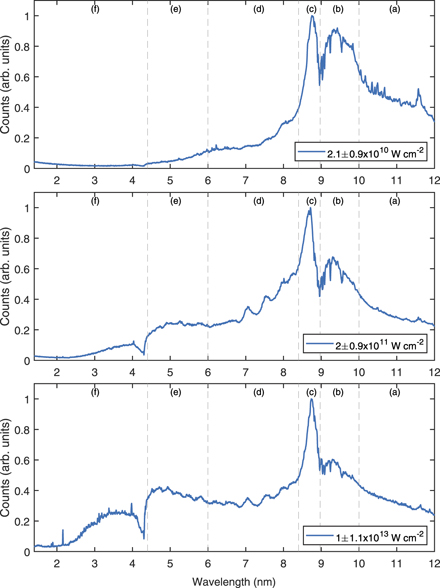
Figure 1. Normalised spectra of cerium laser-produced plasmas between 1.5 and 12 nm, formed using a Nd:YAG laser operating at 532 nm, at three representative power densities (2.1 × 10¹⁰ W cm−2, 2.0 × 10¹¹ W cm−2 and 1.0 × 10¹³ W cm−2). Absorption due to a thin layer of carbon deposited on the grating of spectrometer is evident at 4.2 nm, corresponding to the carbon K-edge.
Download figure:
Standard image High-resolution image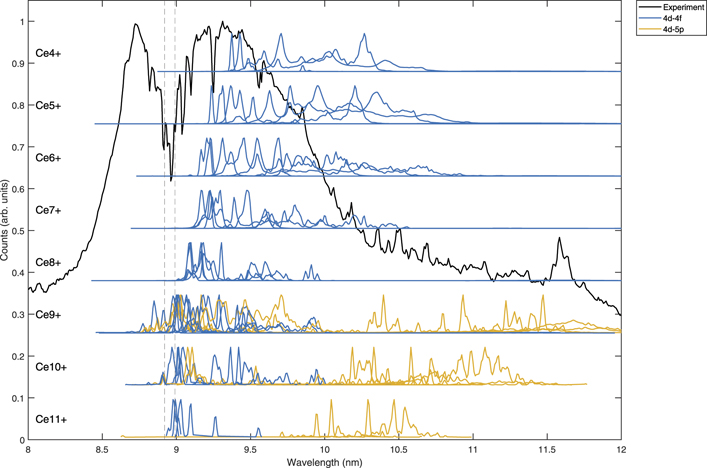
Figure 2. Normalised experimental spectrum recorded at a power density of 1.9 × 10¹⁰ W cm−2 superimposed with calculated 4d–4f and 4d–5p spectra of open 4f subshell ions ranging from Ce4+ to Ce11+. The vertical dashed lines mark the identified transitions at 8.92 nm and 8.99 nm, referred to in the text.
Download figure:
Standard image High-resolution image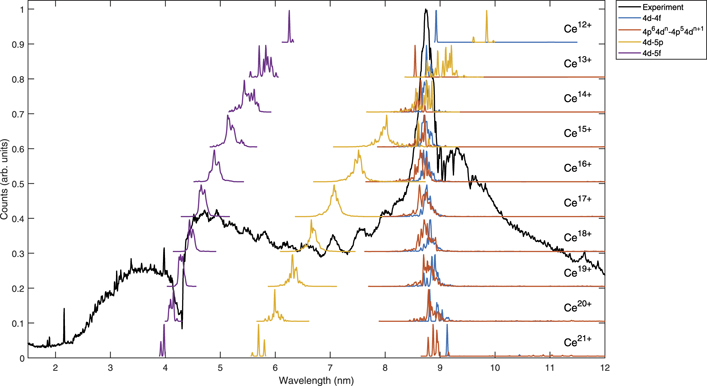
Figure 3. Normalised experimental spectrum recorded at a power density of 1.0 × 10¹³ W cm−2 superimposed with calculated spectra of ions ranging from Ce12+ to Ce21+ involving configurations of the type 4p64dk , 4p64dk−1nf1 (n = 4, 5), 4p54dk+1, and 4p64dk−15p1 were included for k = 1–10, except 4p54dk+1 where k ranged from 1 to 9.
Download figure:
Standard image High-resolution imageStriking differences in the spectra are evident. As a general trend emission at shorter wavelengths is associated with higher ion stages. Lines from the spectra of O6+ (1.86 nm and 2.16 nm) and O7+ at 1.89 nm [33] appear at the higher power densities. These lines provide both wavelength calibration and an indication of plasma electron temperature, as the ionisation potentials of O3+, O5+ and O6+ are 77 eV, 138 eV and 739 eV respectively. Absorption due to a thin layer of carbon deposited on the grating of spectrometer is evident at 4.2 nm, corresponding to the carbon K-edge (figure 4).
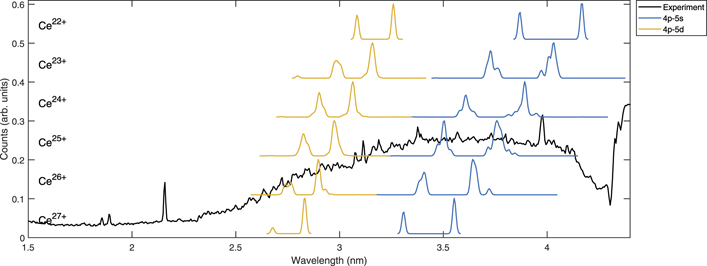
Figure 4. Normalised experimental spectrum recorded at a power density of 1.0 × 10¹³ W cm−2 superimposed with calculated 4p–5s and 4p–5d spectra for ions ranging from Ce22+ to Ce27+.
Download figure:
Standard image High-resolution image
Kawasaki et al [32] discuss the effect of 532 nm compared to 1064 nm irradiation on the power loss processes within heavy element LPPs. While they concentrated on bismuth (Z = 83) LPPs, it would be expected to be applicable for other heavy element LPPs. Assuming equal pulse durations, the most notable difference is that at the lower power densities kinetic energy loss dominates for plasmas formed from 532 nm while radiation losses dominates for the higher power density plasmas. For 1064 nm radiation loss dominates for all but the lowest power density plasmas. A lower electron temperature is expected for an LPP formed using a wavelength of 532 nm compared to a wavelength of 1064 nm.
Before discussing the spectra, it is important to recall that the spectra of the lanthanides are, in general, complicated by the effects of 4f contraction with increasing ionisation that leads to 4f and 5p and subsequently 4f and 5s electron binding energy crossings. This leads to irregularities in the composition of the ground state configuration and strong configuration interaction between configurations containing different numbers of 5p and 4f electrons typically near the 6th ion stage and 4f and 5s electrons near the 15th [34]. Calculations with configuration interaction show that the configuration average energies of all but two configurations of the type (5s5p4f)q , where q ranges from 8 in Ce4+ down to 1 in Ce11+, are within 100 eV of the ground state of the ions Ce4+ to Ce10+, as shown in table 1. In a photoabsorption experiment on Ce4+ ions [35] strong absorption due to the 4d10–4d94f 1S-1P transition was not observed. In its place structure due to overlapping 4d–4f transitions from a large number of 5pn 4fm states was seen, which varied with pulse energy due to the differences in excited state populations produced at different electron temperatures. As shown in table 1, the ground configuration in each ion stage is seen to contain only 5p or 5s electrons. However, transitions involving low-lying configurations containing 4f electrons are expected to be observed due to their proximity to the ground state and the fact that a Boltzmann distribution leads to a sizeable population of ions, in these metastable states especially, in light of their high multiplicity arising from the presence of 4f electrons.
The spectra are discussed in six separate sections, labelled (a) through (f), to highlight the families of transitions that occur in plasmas formed at varying power densities.
4.1. Region A: 10.0–12.0 nm
Strong 2p–4d emission from O VI is seen at 12.99 nm, which becomes weaker at higher power densities, decreasing by over 40% at the highest power density. O VI has a relatively low ionisation potential of 138 eV [33] and so as power density increases this is easily further ionised and hence does not appear in spectra at the higher power densities. Spectra in this region, recorded at power densities in the region of 1011 W cm−2, show 4d–5p emission in Ag-like Ce11+ and Pd-like Ce12+ close to 10 nm, and 4f–5g and 5s–6p transitions in Ce11+ between 13.3 and 13.6 nm [28]. Three lines from the 4d105s–4d95s5p transition array in Ce11+ have previously been identified in spark discharge plasmas [36]. Two further 4d105s–4d95s5p lines are tentatively identified as 2S1/2–(3D)2P1/2 at 9.85 nm, which is blended with the 4d–5p line in Ce XIII, and 2S1/2–(3D)4P3/2 at 10.44 nm.
4.2. Region B: 9.1–10.0 nm
Region B shows a broad UTA feature arising from 4d–4f transitions in ions with open 4f, 5s or 5p subshells, involving configurations listed in table 1 above. The intensity of this feature decreases relative to that of the narrow UTA in region C as the power density increases, due to the reduced relative populations of ions below Ce12+ in the plasmas with higher electron temperatures. The 4d (1S0)–5p (1P1) line [25] at 9.85 nm in Ce12+ appears clearly in the spectra at power densities up to 1 × 10¹¹ W cm−2. UTA mean energies (μ) and root mean square (rms) deviations (σ) [37], for the components of the UTA involving transitions to the lowest-lying configurations listed in table 1, are given in table 2. Contributions to the UTA involving emission to other low-lying configurations tend to lie in the same spectral region, with weak emission extending to longer wavelengths.
Table 2. UTA statistics for selected 4d–4f transitions from Ce4+ to Ce11+.
| Ion stage | Transition | λ (nm) | μ (eV) | σ (eV) | N |
|---|---|---|---|---|---|
| Ce4+ | 5s25p64f0–4d95s25p64f1 | 9.38 | 132.21 | 1.28 | 3 |
| Ce5+ | 5s25p54f0–4d95s25p54f1 | 9.31 | 133.20 | 1.32 | 83 |
| Ce6+ | 5s25p44f0–4d95s25p44f1 | 9.24 | 134.24 | 1.94 | 458 |
| Ce7+ | 5s25p34f0–4d95s25p34f1 | 9.23 | 134.30 | 1.46 | 782 |
| Ce8+ | 5s25p24f0–4d95s25p24f1 | 9.10 | 136.33 | 1.41 | 458 |
| Ce9+ | 5s25p14f0–4d95s25p14f1 | 9.02 | 137.41 | 3.09 | 83 |
| Ce10+ | 5s25p04f0–4d95s24f1 | 9.01 | 137.55 | 0.99 | 3 |
| Ce11+ | 5s15p04f0–4d95s14f1 | 9.00 | 137.81 | 1.05 | 11 |
4.3. Region C: 8.5–9.1 nm
Region C is dominated by a narrow UTA comprising 4d–4f and 4p–4d transitions in the open-4d subshell ions, Ce12+ to Ce21+ together with some overlapping 4d–5p transitions from Ce12+ to Ce21+. The intensity of this UTA grows relative to that in region B as the power density increases, which is consistent with the increase in average ionisation that accompanies increased power densities on-target. Statistical data from the UTA model are given in tables 3 and 4. The narrowness of the UTA in rare-earth spectra is attributed to the role of configuration interaction negating the n-dependence of the mean energy of the UTA [38]. The form of the UTA varies with increasing power density, in that it shifts to shorter wavelength at intermediate power densities and then to slightly longer wavelength at the highest power density. This is consistent with the CI calculations for 4d–4f transitions in open 4d ions, as evidenced in table 3 and previous calculations [34]. It is noteworthy that the clear separation of open-4d and open-4f regions of the UTA, evident in figure 1, is not replicated in spectra of heavier rare-earth elements, samarium for example [16]. The consistent low level of emission between the two regions of the UTA across the range of power densities observed here leads to the conclusion that plasma absorption does not occur strongly in this region.
Table 3. UTA statistics for 4dn –4dn−14f1 transitions from Ce12+ to Ce21+.
| 4dn –4dn−14f1 | ||||
|---|---|---|---|---|
| Ion stage | λ (nm) | μ (eV) | σ (eV) | N |
| Ce12+ | 8.93 | 138.83 | 1.02 | 3 |
| Ce13+ | 8.79 | 141.04 | 1.50 | 81 |
| Ce14+ | 8.76 | 141.51 | 1.97 | 721 |
| Ce15+ | 8.74 | 141.80 | 2.53 | 2825 |
| Ce17+ | 8.80 | 140.95 | 3.50 | 5470 |
| Ce16+ | 8.77 | 141.42 | 2.96 | 5470 |
| Ce18+ | 8.85 | 140.04 | 3.83 | 2825 |
| Ce19+ | 8.92 | 139.02 | 4.03 | 721 |
| Ce20+ | 8.97 | 138.26 | 3.25 | 81 |
| Ce21+ | 9.18 | 135.10 | 3.41 | 3 |
Table 4. UTA statistics for 4p64dn –4p54dn+1 transitions from Ce12+ to Ce21+.
| 4p64dn –4p54dn+1 | ||||
|---|---|---|---|---|
| Ion stage | λ (nm) | μ (eV) | σ (eV) | N |
| Ce13+ | 8.57 | 144.63 | 4.47 | 3 |
| Ce14+ | 8.62 | 143.9 | 4.96 | 60 |
| Ce15+ | 8.68 | 142.88 | 5.63 | 466 |
| Ce16+ | 8.69 | 142.75 | 5.76 | 1717 |
| Ce17+ | 8.75 | 141.71 | 6.06 | 3236 |
| Ce18+ | 8.80 | 140.84 | 6.44 | 3231 |
| Ce19+ | 8.88 | 139.67 | 6.84 | 1712 |
| Ce20+ | 8.98 | 138.13 | 7.73 | 465 |
| Ce21+ | 9.03 | 137.29 | 7.21 | 60 |
Some line emission is also evident superimposed on the UTA. The 4d (1S0)–4f (1P1) line at approximately 8.92 nm [25] from Ce12+ (Pd-like) appears in the spectra recorded here at all power densities. In a similar fashion, a line at 8.99 nm appears in the majority of spectra and this is tentatively identified here as Ag-like 4d105s(2S1/2)–4d95s4f (2P1/2,3/2). The other members of this transition array are not observed as the structure is dominated by the exchange interaction of the 4d94f electron–hole pair [28].
Calculations were undertaken for 4dn−k 4fk –4dn−(k+1) 4fk+1 transitions (n limited to 1, 2, 8, 9, 10 & k = 1, 2), similar to those reported [10] for tin LPP spectra. The scale of the calculations for n = 3 through 7 was prohibitive. These transitions are calculated to lie to the long wavelength side of the UTA arising from transitions with k = 0. The displacement of these transitions towards longer wavelengths, responsible for broadening the UTA in tin, is not evident here. This makes it difficult to clarify the level of the contribution made by the excited to excited transitions in the LPP spectrum of cerium in the same way as for tin LPPs.
4.4. Region D: 6.0–8.5 nm
The emission in the 6–8 nm range can mostly be attributed to 4dn –4dn−15p transitions from ions with open 4d shells, that is Ce12+ to Ce21+. The wavelength of the emission from each ion stage decreases with increasing charge, a behaviour commonly observed in Δn = 1 transitions. At the lowest power density there is not a high level of emission in this region, only at 8 nm is emission due to 4dn –4dn−15p transitions in Ce15+ identifiable as a shoulder on the short wavelength side of the strong 4d–4f UTA. At the intermediate power density 4d–5p emission in Ce16+ and Ce17+ is also clear. At the highest power density 4d–5p transitions up to Ce19+ are seen. Details of the spectral features, including peak wavelength, the mean energy and σ derived from the UTA formalism are presented in table 5. 4dn –4dn−15p transitions extend above 8 nm and below 6 nm. However their contribution is generally less than the transitions outlined in sections 4.2 and 4.3. It is noteworthy that the 4d–5p transitions in ions Ce16+ to Ce18+ are clearest in figure 3 as they have the highest summed gA values and are not overlapping with other transition arrays.
Table 5. UTA statistics for 4dn –4dn−15p1 transitions from Ce12+ to Ce21+.
| 4dn –4dn−15p1 | ||||
|---|---|---|---|---|
| Ion stage | λ (nm) | μ (eV) | σ (eV) | N |
| Ce12+ | 9.82 | 126.26 | 1.18 | 3 |
| Ce13+ | 9.06 | 136.84 | 2.49 | 60 |
| Ce14+ | 8.67 | 143.02 | 2.70 | 466 |
| Ce15+ | 8.10 | 153.15 | 5.29 | 1718 |
| Ce16+ | 7.50 | 165.36 | 3.11 | 3245 |
| Ce17+ | 7.07 | 175.46 | 3.07 | 3245 |
| Ce18+ | 6.68 | 185.61 | 3.04 | 1718 |
| Ce19+ | 6.33 | 195.89 | 2.93 | 466 |
| Ce20+ | 6.01 | 206.25 | 2.71 | 60 |
| Ce21+ | 5.72 | 216.74 | 2.34 | 3 |
4.5. Region E: 4.4–6.0 nm
4d–5f and 4d–6p transitions are primarily responsible for the radiation in the 4.4–6 nm region. Details of the 4d–5f transition arrays are given in table 6. At the lowest power density, the emission is essentially plasma continuum radiation. Several small fluctuations in the emission can be seen at the intermediate power density, which become more defined at the highest power density. Here, 4d–5f and 4d–6p transitions, along with 4p–5s transitions in Ce13+–Ce18+, merge into a series of small peaks. In addition, 4d–5p transitions in Ce21+ (Sr-like) and Ce20+ (Rb-like) are evident between 5.5 and 6 nm. Below 4.4 nm the spectrum is influenced by absorption due to carbon contamination on the grating.
Table 6. UTA statistics for 4dn –4dn−15f1 transitions from Ce12+ to Ce21+.
| 4dn –4dn−15f1 | ||||
|---|---|---|---|---|
| Ion stage | λ (nm) | μ (eV) | σ (eV) | N |
| Ce12+ | 6.26 | 198.10 | 0.56 | 3 |
| Ce13+ | 5.82 | 212.96 | 3.58 | 81 |
| Ce14+ | 5.50 | 225.39 | 4.52 | 721 |
| Ce15+ | 5.19 | 238.71 | 4.70 | 2825 |
| Ce16+ | 4.91 | 252.30 | 4.43 | 5470 |
| Ce17+ | 4.69 | 264.58 | 3.92 | 5470 |
| Ce18+ | 4.48 | 276.82 | 3.4 | 2825 |
| Ce19+ | 4.29 | 289.00 | 2.88 | 721 |
| Ce20+ | 4.12 | 301.19 | 2.63 | 81 |
| Ce21+ | 3.96 | 313.23 | 2.11 | 3 |
4.6. Region F: 1.5–4.4 nm
As is the case for region E, the spectra from plasmas formed at the lower two power densities show very little emission between 1.5 and 4.4 nm. At the highest power density line emission from O VII and O VIII is clearly visible at 2.15 nm and below, indicating a plasma electron temperature sufficient to open the 4p subshell in Ce21+ and above. 4p–5s, 4p–5d, 4p–6s, 4p–6d, 4d–6p & 4d–6f transitions all occur in this region, but cannot be unambiguously assigned in this spectrum. As mentioned above, transitions from n = 6 and n = 7 levels do not appear in the spectra here. Due to the high density of the plasma the ions are likely to decay from the n = 6 and n = 7 levels collisionally before they decay radiatively.
5. Conclusion
In summary, XUV emission spectra of Ce laser-produced plasmas were recorded using a 5.5 ns, Nd:YAG laser operating at the second harmonic wavelength of 532 nm. Power densities on-target ranged from 8.6 × 10⁹–2.1 × 10¹³ W cm−2, generating a variety of spectra containing emission from ions between Ce5+ and Ce25+. The spectra reflect a general trend of increasing ionisation with increasing power density on target. 4d–4f transitions dominate the spectra in the 8–12 nm region while Δn = 1 transitions from 4p and 4d configurations are evident at shorter wavelengths. The spectra show a high degree of similarity with laser plasma spectra of other rare-earth elements, however, the denser plasmas formed with the 532 nm laser pulses reveal higher intensity to the long-wavelength side of the 4d–4f UTA.
Acknowledgments
EW was supported by the Irish Research Council (EPSPG/2016/89).
Data Availability Statement
The data that support the findings of this study are available upon reasonable request from the authors.