
Abstract
The physiological importance of respiratory sinus arrhythmia (RSA) and cardioventilatory coupling (CVC) has not yet been fully elucidated, but these phenomena might contribute to improve ventilation/perfusion matching, with beneficial effects on gas exchange. Furthermore, decreased RSA amplitude has been suggested as an indicator of impaired autonomic control and poor clinical outcome, also during positive-pressure mechanical ventilation (MV). However, it is currently unknown how different modes of MV, including variable tidal volumes (VT), affect RSA and CVC during anesthesia. We compared the effects of pressure controlled (PCV) versus pressure assisted (PSV) ventilation, and of random variable versus constant VT, on RSA and CVC in eight anesthetized pigs. At comparable depth of anesthesia, global hemodynamics, and ventilation, RSA amplitude increased from 20 ms in PCV to 50 ms in PSV (p < 0.05). CVC was detected (using proportional Shannon entropy of the interval between each inspiration onset and the previous R-peak in ECG) in two animals in PCV and seven animals in PSV. Variable VT did not significantly influence these phenomena. Furthermore, heart period and systolic arterial pressure oscillations were in phase during PCV but in counter-phase during PSV. At the same depth of anesthesia in pigs, PSV increases RSA amplitude and CVC compared to PCV. Our data suggest that the central respiratory drive, but not the baroreflex or the mechano-electric feedback in the heart, is the main mechanism behind the RSA increase. Hence, differences in RSA and CVC between mechanically ventilated patients might reflect the difference in ventilation mode rather than autonomic impairment. Also, since gas exchange did not increase from PCV to PSV, it is questionable whether RSA has any significance in improving ventilation/perfusion matching during MV.
Export citation and abstract BibTeX RIS
Abbreviations
| CVC | cardioventilatory coupling |
| MV | mechanical ventilation |
| PAW, PE | airway and esophageal pressure |
| PCV, PSV, PCVnoisy, PSVnoisy | pressure controlled and supported mechanical ventilation, non-variable and variable |
| SAP, DAP, MAP, PP | systolic, diastolic, mean, and pulse arterial pressure |
| RSA | respiratory sinus arrhythmia |
| VT | tidal volume |
1. Introduction
Healthy spontaneously breathing subjects show a cyclic inspiratory increase and expiratory decrease of heart rate (respiratory sinus arrhythmia-–RSA) (Berntson et al 1993), and 'phase coupling' between heart beats and respiration (causing heart beats to occur at constant phases of the respiratory cycle), commonly known as cardioventilatory coupling (CVC) (Galletly and Larsen 1997). These phenomena originate from a complex interplay of several mechanisms including central drive, feedback from arterial baroreceptors, feedback from thoracic and lung stretch receptors, and non-neural mechanisms intrinsic to the heart, which are not fully understood (Berntson et al 1993, Eckberg and Karemaker 2009, Tzeng et al 2007). Although the physiological importance of RSA and CVC has not been elucidated, several authors suggested that they might improve ventilation/perfusion matching through a redistribution of heart beats (and consequently of perfusion) within the respiratory cycle, with beneficial effects on gas exchange (Giardino et al 2003, Hayano et al 1996). Furthermore, decreased RSA amplitude has been used as an indicator of impaired autonomic control and of poor clinical outcome, also during mechanical ventilation (MV) (Korach et al 2001, Schmidt et al 2005).
It has been shown that during controlled MV the RSA amplitude is considerably reduced and the CVC generally abolished (Galletly and Larsen 2001), even if it must be acknowledged that one study reported that few patients presented a stable CVC with a reversed (attenuated) RSA pattern (i.e. inspiratory bradycardia and expiratory tachycardia) ((Van de Louw et al 2008) 560/id). Theoretically, MV modes that assist the respiratory pump upon triggering by the patient, such as pressure support ventilation (PSV), which has been increasingly used during general anesthesia, might maintain higher RSA levels through centrally-originated phasic vagal modulation compared to controlled MV. In addition, MV with breath-by-breath variable tidal volumes (VT), so-called 'variable ventilation', could better preserve RSA and CVC, and this might play a role in the improved arterial oxygenation we and others found in different models of acute lung injury (Mutch et al 2005, Spieth et al 2009b) when comparing variable and conventional MV. However, the differences in the behavior of RSA and CVC for those MV strategies have not been fully investigated.
In this study, we aimed at assessing the differences in RSA and CVC between PSV and pressure controlled ventilation (PCV), as well as between variable and conventional MV, at comparable depth of anesthesia, global hemodynamics, and minute ventilation in healthy pigs. We hypothesized that: (1) PSV increases the RSA amplitude and increases CVC compared to PCV, (2) variable ventilation enhances such effects, and (3) central drive is the main mechanism behind the differences in RSA that may result from these ventilation strategies. If our hypotheses are confirmed, this would provide deeper insight into the mechanisms of RSA generation, confirming the key role of central mechanisms. It would also be possible to speculate that differences in RSA between mechanically ventilated patients might reflect the difference in MV mode they are submitted to, rather than differences in autonomic impairment, providing a strong argument against the use of RSA to assess autonomic function during MV. Finally, this study will help elucidating whether increased RSA plays a key role in improving gas exchange during MV. In fact, if the increase we hypothesize in RSA during assisted MV is paralleled by an increase in blood oxygenation, it would be possible to suggest that assisted MV modes might to some extent affect ventilation/perfusion matching through RSA modulation.
2. Materials and methods
2.1. Experimental protocol
After approval by the local Animal Care Committee, eight female juvenile pigs (32–42 kg) were anesthetized intravenously (propofol 2–7 mg kg−1 h−1, sufentanil 0.3–1.5 µg kg−1 h−1, and, for the controlled MV modes only, atracurium bromide 1 mg kg−1), and tracheally intubated with a cuffed tube (8.0 mm inner diameter). An indwelling catheter was inserted in the right femoral artery and a pulmonary artery catheter (Swan-Ganz catheter, Edwards Lifesciences, Irvine, CA, USA) advanced through an introducer sheath placed in the left external iliacal vein. An esophageal balloon catheter (Cardinal Health, USA) was introduced in the esophagus, in order to measure the esophageal pressure, a surrogate of intra-pleural pressure. After intubation, the animals were mechanically ventilated using an EVITA XL ventilator (Dräger, Germany) with PSV mode until a stable respiratory pattern was reached (approximately 30 min).
Then, as illustrated in figure 1, the animals underwent 30 min of two controlled and two assisted MV modes in randomized order according to a Latin square design: PCV, random variable PCV (PCVnoisy), PSV, and random variable PSV (PSVnoisy). During PSV and PSVnoisy each inspiration was triggered when the initial spontaneous inspiratory airflow of the animal exceeded a predefined threshold (5–7 L min−1, the minimum value that avoided non-respiratory-related triggering was selected for each animal), whereas during PCV and PCVnoisy it was initiated artificially by the ventilator at a fixed rate (set as the average respiratory rate found for the last preceding period of PSV or PSVnoisy). At the onset of inspiration the ventilator started to apply a given positive driving pressure to the subject airways, and continued until a condition for the termination of inspiration occurred. For assisted MV such a condition was the airflow falling below a certain level of the peak inspiratory airflow (15–25%), whereas for controlled MV was reaching a preset duration of inspiration. These conditions were adjusted to achieve in all MV modes an inspiration/expiration ratio of 0.3, compatible with the values found for PSV in the clinical setting (Tokioka et al 1989), since differences in such a ratio could affect RSA (Strauss-Blasche et al 2000). Finally, the inspiration was followed by passive expiration. The inspiratory driving pressure was tuned cycle-by-cycle by an automatic control system (Beda et al 2010) to achieve a target mean tidal volume (VT) of 12 mL kg−1 in all modes, a random (white noise-–no correlation with preceding cycles) breath-by-breath VT variability of 30% for PCVnoisy and PSVnoisy (Spieth et al 2009a), and no variability for PCV and PSV. The value of mean VT was chosen to allow lower respiratory frequency, which is expected to increase RSA. Furthermore, such mean VT is commonly used during general anesthesia in non-injured lungs. Throughout the experimental protocol, anesthetic agents were administered at constant infusion rates, the inspired fraction of O2 was 0.4, and the positive end-expiratory pressure was 5 cmH2O. Details of the MV and anesthesia are summarized in table 1.

Figure 1. Timeline of experiment. MV: mechanical ventilation; PCV, PSV, PCVnoisy, PSVnoisy: pressure controlled and supported MV, non-variable and variable.
Download figure:
Standard imageTable 1. MV setting and anesthesia.
| PCV and PCVnoisy | PSV and PSVnoisy | |
|---|---|---|
| Trigger of inspiration | Fixed respiratory period | Inspiratory flow |
| > 5–7 L s−1 (minimum value that avoids non-respiratory-related triggering) | ||
| Inspiration cycle-off condition | Fixed inspiration duration | Airflow <X% of peak inspiratory valueb |
| Expiration | Passive | |
| Respiratory rate | Same as the average for the last preceding period of PSV or PSVnoisy | Determined by subject |
| PEEP | 5 cmH2O | |
| Inspiration/expiration time ratio | 0.3 (compatible with the values found for PSV in the clinical setting (Tokioka et al 1989)) | |
| Target VT | Mean = 12 mL kg−1 a, variability = 0% for PSV and PCV, | |
| 30% for PCVnoisy and PSVnoisy (white noise, as in Spieth et al (2009a)), achieved by tuning cycle-by-cycle the driving/support pressure through an automatic control system (Beda et al 2010) | ||
| Fraction of O2 in inspired gas | 0.4 | |
| Anesthetic agents | Propofol 2–7 mg kg−1 h−1, sufentanil 0.3–1.5 µg kg−1 h−1, administered intravenously at constant infusion | |
| Muscle relaxants | Atracurium bromide 1 mg kg−1 | None |
aValue chosen to allow lower respiratory frequency, which is expected to increase RSA. Furthermore, such mean VT is commonly used during general anesthesia in non-injured lungs. bThe value of X was adjusted at the beginning of each task involving PSV or PSVnoisy, in the range 15% < X < 25%, until the desired inspiration/expiration ratio was achieved, and left unchanged afterward.
2.2. Data acquisition and analysis
The following signals were acquired synchronously during the last 20 min of each MV mode with sampling frequency of 2000 Hz, using a data acquisition card (NI USB-6210, National Instruments, USA) connected to a PC: airway pressure (PAW) and esophageal pressure (PE), using pressure transducers (163PC01D48-PCB, Sensortechnics GmbH, Germany); one non-standard derivation of ECG using a biosignal amplifier (LP511, Grass Technologies, USA); and femoral arterial blood pressure measured invasively using disposable transducers (DTXPlus, Becton Dickinson, USA). Airflow was acquired continuously from the ventilator to the PC through serial interface (sampling frequency of 180 Hz), and synchronized off-line with the other signals (through automatic time alignment, using maximal covariance, between the airway pressure signal acquired using the data acquisition system and the airway pressure signal that could also be retrieved from the ventilator). At the end of each period of MV, arterial and mixed-venous blood gases, cardiac output, and blood temperature were measured (the last two using an M1097 monitor, Agilent, Germany).
The onset of inspiration and expiration were automatically detected in the airflow signal, and then manually edited. For PSV and PSVnoisy, the data regarding the 5% longest respiratory cycles of each task were excluded from further analysis, to avoid the confounding effect of episodic prolonged expiratory pauses. For the remaining respiratory cycles, VT, respiratory period, and inspiration/expiration ratio were calculated, and the peak and mean values of airway and transpulmonary pressure (where the latter is the difference between airway and esophageal pressure) computed.
2.3. Indexes of respiratory-related cardiovascular oscillations
The time series of the intervals between consecutive R-peaks in the ECG, and of systolic, diastolic, and mean arterial pressure (SAP, DAP, and MAP respectively), and pulse pressure (PP = SAP – DAP), were automatically estimated from the ECG and arterial pressure signals and manually edited to avoid artifacts, as described elsewhere (Beda et al 2007). For each respiratory cycle, the difference between the longest and the shortest R–R interval was taken as an estimate of RSA amplitude, while the differences between the largest and the smallest value of SAP, MAP, DAP, and PP were taken as estimates of the amplitude of their respiratory-related oscillations. Also, for each respiratory cycle, the inspiratory (expiratory) gradient of RSA was estimated as the slope of the line interpolated from the subset of the time series of R–R intervals starting and/or ending within the inspiration (expiration), as described elsewhere (Carvalho et al 2009). The average gradients were then calculated considering all the cycles belonging to each task. The same processing was applied to compute the inspiratory/expiratory gradients of SAP, DAP, and PP.
2.4. Respiratory and baroreflex RSA modulation at respiratory frequencies
We estimated the transfer function and the coherence (after spline interpolation and resampling with a sampling frequency of 4 Hz) using the Welch modified periodogram method (with windows of 1024 samples, overlapping 50%) for the following time series: airway pressure → R–R interval, and SAP → R–R interval. The first transfer function provides information about the direct influence of respiration during MV on R–R interval duration, while the second was used to assess the characteristics (or the absence) of baroreflex modulation of RSA. For this purpose the average phase shift (in radians) and the average gain of the transfer functions in the respiratory frequency range (high-frequency (HF): 0.15–0.5 Hz) were computed, considering only those frequencies for which the estimated coherence was above a threshold value. The latter was estimated using the surrogate data approach detailed by Porta et al (2002), an improvement compared to the common practice of choosing an arbitrary value (typically 0.5). For the transfer function X → Y, a positive (negative) phase shift indicates that X oscillations precede (follow) those of Y. The average phase shifts in the HF band were calculated also as delays (in seconds) after applying the transformation delay(f) = phase(f)/(2 ⋅ π ⋅ f) for each frequency f.
2.5. Assessment of CVC
To assess quantitatively the presence of significant CVC, for all subjects and tasks the time series of the interval between the last R-peak in each respiratory cycle and the start of the next inspiration was computed, and the median proportional Shannon entropy (SHα) of the last 200 samples was computed using the same method reported by Tzeng et al (2003). Then, a significance threshold was computed using the Monte Carlo approach: the values of SHα of 1000 series of 200 random samples with a uniform distribution were computed, and the value T of the 5% percentile of the resulting distribution of SHα was estimated. For each animal in each task, if SHα < T the CVC was considered statistically significant and analyzed qualitatively by observation of the synchrograms (i.e. plotting one dot for each R-peak, with the respiratory cycle number the R-peak belongs to as abscissa, and the corresponding interval between the R-peak and the previous onset of inspiration as ordinate-–for an example, see figure 5), such that CVC can be observed as the presence of horizontal 'bands' of dots, as described elsewhere (Tzeng et al 2003).
2.6. Statistical analysis
Values are reported as mean ± SD. The differences between the MV modes in the mean value of the cardiovascular and respiratory parameters were assessed using two-way repeated measures ANOVA (factor 1: controlled/assisted MV; factor 2: non-variable/variable MV) and post-hoc paired t-tests. Results were considered statistically significant when p < 0.05.
3. Results
Figure 2 illustrates the hemodynamic and ventilatory patterns for a representative subject during all MV modes investigated. During the PSV and PSVnoisy, esophageal pressure drops just before and at the beginning of inspiration, indicating the presence of inspiratory effort, which is absent during PCV and PCVnoisy. Also, the pattern of PAW differs somewhat between controlled and assisted MV due to the simultaneous presence of inspiratory effort in the latter, although PAW peak inspiratory values are comparable. The respiration-related oscillations of the R–R interval time series, i.e. RSA, have markedly larger amplitude during assisted compared to controlled MV. Such an effect is also evident for DAP, but not for SAP. During PCVnoisy and PSVnoisy, the pattern of ventilation shows higher variability in amplitude compared to PCV and PSV, respectively.
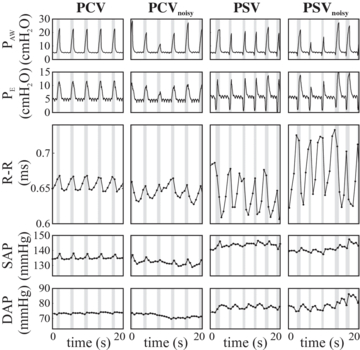
Figure 2. Pattern of respiration and cardiovascular oscillations for a representative subject. PAW, PE: airway and esophageal pressure; R–R: interval between two consecutive R-peaks in the ECG; SAP, DAP: systolic and diastolic arterial pressure. PCV, PSV, PCVnoisy, PSVnoisy: pressure controlled and supported MV, non-variable and variable.
Download figure:
Standard image3.1. Hemodynamics and ventilation
Table 2 reports the hemodynamic and ventilatory variables. R–R interval, SAP, DAP, MAP, cardiac output, minute ventilation, respiratory rate, and inspiration/expiration ratio did not differ significantly between assisted and controlled MV, or between variable and non-variable ventilation. SAP was slightly higher during PCV than PCVnoisy (mean difference = 4.9 mmHg), and blood temperature was slightly higher during assisted compared to controlled MV (mean increase = 0.4 °C). Arterial and venous levels of CO2 and O2 were similar for all MV modes, with the exception of a higher partial pressure of O2 in arterial blood for variable MV (mean difference of approximately 11 mmHg), and a partial pressure of CO2 in venous blood for assisted compared to controlled MV (mean difference of approximately 8 mmHg). The VT variability was higher during variable versus non-variable and assisted versus controlled MV, while mean VT differences were <5% on average. Mean and peak values of PAW, but not transpulmonary pressure, decreased significantly during assisted compared to controlled MV.
Table 2. Mean (± SD) hemodynamic and respiratory variables.
| PCV | PCVnoisy | PSV | PSVnoisy | S | N | M | |
|---|---|---|---|---|---|---|---|
| Heart period | 146 ± 97 | 306 ± 331 | 1220 ± 947*† | 1152 ± 1095*† | § | ||
| variability (ms2) | |||||||
| Heart period (ms) | 658 ± 43 | 649 ± 42 | 664 ± 77 | 688 ± 93 | |||
| SAP (mmHg) | 122 ± 14 | 117 ± 11* | 119 ± 16 | 121 ± 14 | § | ||
| DAP (mmHg) | 73 ± 15 | 68 ± 13 | 72 ± 10 | 72 ± 8 | |||
| MAP (mmHg) | 92 ± 15 | 88 ± 13 | 91 ± 8 | 91 ± 8 | |||
| Cardiac output | 5.9 ± 1.0 | 5.4 ± 0.7 | 5.5 ± 1.3 | 5.3 ± 0.8* | |||
| (L min−1) | |||||||
| Blood | 39.3 ± 0.5 | 39.4 ± 0.4 | 39.8 ± 0.5** | 39.8 ± 0.6** | § | ||
| temperature (°C) | |||||||
| PaO2 (mmHg) | 132 ± 33 | 144 ± 28** | 138 ± 23 | 149 ± 28* | §§ | ||
| PaCO2 (mmHg) | 51 ± 3 | 53 ± 3 | 56 ± 6 | 56 ± 6 | |||
| PvO2 (mmHg) | 48 ± 5 | 48 ± 3 | 48 ± 6 | 49 ± 4 | |||
| PvCO2 (mmHg) | 58 ± 3 | 60 ± 2 | 67 ± 6**†† | 68 ± 4***†† | §§ | ||
| Arterial blood pH | 7.44 ± 0.04 | 7.43 ± 0.04 | 7.41 ± 0.05 | 7.41 ± 0.05 | |||
| Minute ventilation | 5.7 ± 0.7 | 5.5 ± 0.6 | 5.7 ± 0.8 | 5.7 ± 0.9 | |||
| (L min−1) | |||||||
| Respiratory rate | 12.9 ± 1.2 | 12.9 ± 1.3 | 13.3 ± 1.7 | 13.7 ± 1.9 | |||
| (breaths min−1) | |||||||
| Inspiration/expiration | 0.3 ± 0.0 | 0.3 ± 0.0 | 0.3 ± 0.1 | 0.3 ± 0.1 | |||
| ratio | |||||||
| VT (mL) | 440 ± 38 | 427 ± 37* | 433 ± 41* | 417 ± 41***†‡‡ | §§ | §§ | |
| VT coefficient | 1 ± 1 | 32 ± 3*** | 13 ± 4***††† | 28 ± 7***‡‡ | §§ | §§§ | §§ |
| of variation (%) | |||||||
| PL,m (cmH2O) | 1.5 ± 0.9 | 1.1 ± 0.7* | 1.8 ± 1.0† | 1.6 ± 1.1 | § | ||
| PL,p (cmH2O) | 12 ± 3 | 10 ± 2* | 12 ± 4 | 12 ± 4 | |||
| PAW,m (cmH2O) | 7.9 ± 0.9 | 7.8 ± 0.6 | 7.0 ± 1.0* | 6.6 ± 0.8**†† | §§ | ||
| PAW,p (cmH2O) | 22 ± 3 | 21 ± 2** | 20 ± 3* | 18 ± 3**†† | § | §§ |
SAP, DAP, MAP: systolic, diastolic, and mean arterial pressure; PaO2, PvO2, PaCO2, PvCO2: arterial and venous partial pressure of O2 and CO2; VT: tidal volume; PAW,m, PAW,p, PL,m, PL,p,: mean and peak value of airway and transpulmonary pressure within the respiratory cycle; PCV, PSV, PCVnoisy, PSVnoisy: pressure controlled and assisted MV, non-variable and variable. Two-way ANOVA effect of spontaneous breathing (S, versus controlled), of variable ventilation (N, versus non-variable), and mixed effect (M): § p < 0.05; §§ p < 0.01; §§§ p < 0.001. Analogous notation for the paired t-tests: * versus PCV, † versus PCVnoisy, ‡ versus PSV.
3.2. Respiratory-related cardiovascular oscillations
The amplitude of RSA more than doubled from controlled to assisted MV modes (figure 3(a)). A similar effect was found also for the amplitude of the respiratory-related DAP oscillations, while that of SAP, MAP, and PP did not change significantly among MV modes (figures 3(b) and (c)). Also, during assisted MV, the gradient of R–R interval duration was negative during inspiration and positive during expiration, while during controlled MV a coherent pattern among the subjects could not be identified (figure 3(d)). Conversely, the gradient of SAP was positive during inspiration and negative during expiration in all MV modes (figure 3(e)). No coherent pattern of PP or MAP along the respiratory cycle was found among the animals in any of the MV modes.

Figure 3. Average amplitude of respiratory-related oscillation of R–R interval, and systolic and diastolic arterial pressure (R–R, SAPRESP, DAPRESP), and their average gradients during inspiration (insp) and expiration (exp). RSA: respiratory sinus arrhythmia; PCV, PSV, PCVnoisy, PSVnoisy: pressure controlled and supported MV, non-variable and variable. Effect S and effect N: p-value of the effect of spontaneous breathing (versus controlled) and of variable ventilation (versus non-variable) respectively, estimated with a repeated measures two-way ANOVA. One-sample t-tests to verify if the slope is significantly different from zero: *p < 0.05; **p < 0.01; ***p < 0.001. Similar notation for the post-hoc paired t-tests versus PCV (†) and versus PCVnoisy (§).
Download figure:
Standard image3.3. Respiratory and baroreflex RSA modulation at respiratory frequencies
Figure 4 illustrates the average gain, phase shift, and coherence of the transfer functions between PAW and R–R interval, and between SAP and R–R interval, during PCV and PSV (the results are very similar to those of PCVnoisy and PSVnoisy, respectively, and hence are not reported). Figure 4 also reports the corresponding average values of gain and phase shift in the HF band for all MV modes (figures 4(g)–(j)). The gain and phase shift of both transfer functions changed considerably between assisted and controlled MV. Specifically, at respiratory frequencies (i.e. HF) R–R interval and SAP oscillations were in phase during controlled MV, while during assisted MV R–R interval oscillations preceded those in SAP of more than 1 s (p < 0.001, figure 4(j)), resulting in the two being almost in counter-phase (i.e. delay larger than –π/2, p < 0.048). Similarly, HF oscillations of R–R interval and PAW are in phase during controlled but not assisted MV (p = 0.007, figure 4(i)), when PAW significantly leads R–R interval. The estimated gain in the HF band between PAW or SAP and R–R interval increased from controlled to assisted MV (p < 0.026, figures 4(g) and (h)).
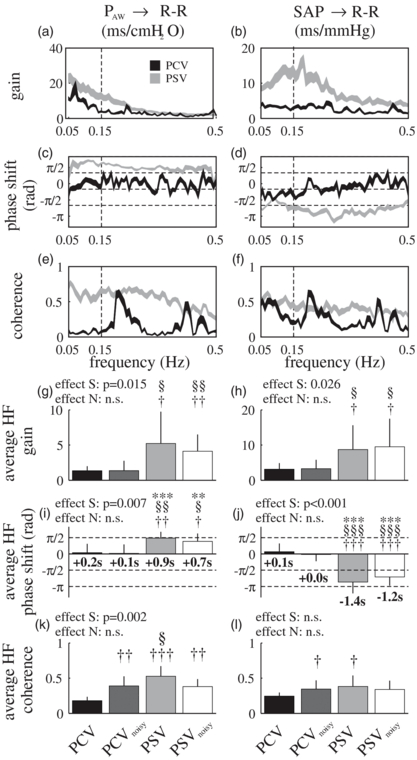
Figure 4. Transfer function between airway pressure and R–R interval (PAW → R–R) and between systolic arterial pressure and R–R interval (SAP → R–R): (a)–(f) mean ± st. err range of gain, phase shift, and coherence during pressure controlled and supported ventilation (PCV and PSV), (g)–(l): average gain, phase shift, and coherence in the HF band (0.15–0.5 Hz) for all ventilation modes. In panels (i) and (j) the average phase shifts in the HF band are also reported as delays (in seconds), calculated after applying the transformation delay(f) = phase(f)/(2 · π · f) for each frequency f. Effect S and effect N: p-value of the effect of spontaneous breathing (versus controlled) and of variable ventilation (versus non-variable) respectively, estimated with a repeated measures two-way ANOVA. One-sample t-tests verify if the phase delay is significantly different from zero: *p < 0.05; **p < 0.01; ***p < 0.001. Similar notation for the paired t-tests versus PCV (†) and versus PCVnoisy (§).
Download figure:
Standard image3.4. Cardioventilatory coupling
Figure 5 illustrates the effect of different MV modes on CVC in a representative animal. The synchrograms (figure 5(a)) show that during controlled MV CVC is absent or very limited (as R-peaks are not organized in horizontal bands), while it is clearly present during assisted MV, resulting in separate horizontal bands of dots. Accordingly, privileged locations for beat occurrence within the respiratory cycle could be observed during assisted compared to controlled MV (figure 5(b)). Similar patterns were observed in six out of eight animals investigated. The value of SHα decreased significantly from controlled to assisted MV (p = 0.035) implicating a more 'organized' synchrogram. SHα was lower than the significance threshold (i.e. presence of statistically significant CVC) in two cases for PCV, three cases for PCVnoisy, and seven cases for PSV and PSVnoisy.

Figure 5. Representative example of CVC during the MV modes considered: (a) synchrogram (i.e. plotting one dot for each R-peak, with the respiratory cycle number the R-peak belongs to as abscissa, and the corresponding interval between the R-peak and the previous onset of inspiration as ordinate), in which CVC is present when dots are organized in horizontal 'bands', as in PSV and PSVnoisy, and not drifting, as in PCV and PCVnoisy; (b) variation in time of the probability of beat occurrence in 0.3 s consecutive intervals within the respiratory cycle, calculated using a moving window of 30 respiratory cycles. PCV, PSV, PCVnoisy, PSVnoisy: pressure controlled and supported MV, non-variable and variable.
Download figure:
Standard image4. Discussion
In this work, healthy pigs were submitted sequentially to different MV modes but with comparable conditions of anesthesia, global hemodynamics, ventilation, and mean VT. The main findings are that: (a) the amplitude of the RSA doubled from controlled to assisted MV; (b) CVC was more pronounced during assisted than controlled MV; (c) respiratory-related R–R interval and SAP oscillations were close to counter-phase during assisted MV and roughly in phase during controlled MV; (d) variable VT did not significantly augment RSA amplitude or CVC. To our knowledge, this is the first work comparing the effects of conventional controlled MV and assisted and variable MV on RSA, CVC, and arterial blood pressure oscillations.
The relatively low RSA amplitude during controlled MV in our animals is compatible with previous findings in humans (Carvalho et al 2009, Mutch et al 2005). However, we showed for the first time that RSA amplitude significantly increases by switching from controlled to assisted MV during general anesthesia.
Differences in overall hemodynamics, ventilation, and blood oxygenation, which are known to affect RSA (Berntson et al 1993, Sasano et al 2002, Taha et al 1995), can probably be excluded as causes of such an increase. In fact, mean R–R interval, MAP, SAP, DAP, cardiac output, arterial partial pressure of CO2, arterial pH, respiratory frequency, minute ventilation, and transpulmonary pressure were comparable during controlled and assisted MV. Furthermore, it is unlikely that the small differences found in VT, and body temperature, could explain the changes in RSA.
It is also improbable that changes in baroreflex modulation of R–R interval caused the increase of RSA. If this was the case, a reversed RSA (inspiratory bradycardia and expiratory tachycardia) would have been expected during assisted MV (Van de Louw et al 2010b), since SAP increases during inspiration and decreases during expiration due to MV (Michard 2005). However, the opposite was observed (inspiratory R–R interval reduction and expiratory increase), as expected during spontaneous breathing. This effect is further highlighted by the transfer function analysis, which shows that R–R interval oscillations precede SAP ones with a delay of approximately 1 s, which is incompatible with a causal baroreflex modulation of RSA during assisted MV, reflecting either the effect of changing heart rate on arterial pressure or the direct modulation of ventilation on both R–R interval and SAP. Our results support the hypothesis that mechano-electric feedback in the heart (i.e. Bainbridge effect) is the predominant source of RSA during controlled MV (Freyschuss and Melcher 1976a, 1976b). In fact, the delay seen in the transfer function between PAW and R–R interval and between SAP and R–R interval in the HF band did not differ significantly from zero for PCV and PCVnoisy, which is more compatible with a fast-acting mechano-electric feedback in the heart and feed-forward modulation of R–R interval on SAP rather than arterial baroreflex. However, the same hypothesis does not hold for assisted MV, during which the transfer function analysis showed a considerable delay between PAW and R–R (comparable to the average length of inspiration, ∼1 s). Hemodynamics and ventilation, which modulate mechano-electric feedback (Kohl et al 1999), were comparable between controlled and assisted MV, so it seems unlikely that this effect changed between ventilatory modes. In particular, increased respiratory variability of stroke volume associated with spontaneous breathing seems to be excluded by the lack of significant differences between the MV modes in the amplitude of the respiratory oscillations in pulse pressure (a surrogate of stroke volume (Michard 2005)). Hence, another more powerful mechanism of RSA generation appears to override mechano-electric feedback in the heart during assisted MV.
Thus, it is likely that the major sources of RSA during positive-pressure MV under general anesthesia are the central respiratory generators. This hypothesis is in line with the findings by Cooper et al (2004), who showed an increased RSA in awake healthy subjects from controlled to assisted MV. Most probably, in our animals the central drive was functional during assisted MV and absent, or at least largely depressed, during controlled MV. Direct measurement of vagal activity to test this hypothesis was not carried out in this study, but there is previous evidence to support this assumption. Firstly, the administration of atropine, which is expected to abolish phasic vagal modulation of RSA, does not influence RSA amplitude during controlled MV under general anesthesia (Kawamoto et al 2002, Yli-Hankala et al 1993). Secondly, strong and sustained inhibition of the drive to breathe (i.e. phrenic nerve activity) is exerted by nonchemical (i.e. not related to CO2 levels) influences during controlled MV, under conditions such as a sufficient inspiratory flow and respiratory rate (Rice et al 2003, Ward et al 1988). This is in agreement with our observation during preliminary tests performed in five animals, that when switching from assisted to controlled MV without muscle relaxants, respiratory effort disappeared rapidly (as noted from an absent inspiratory drop in esophageal pressure), except for a handful of episodes during the 30 min of MV. A consequent suppression of centrally-driven phasic vagal modulation of heart rhythm during controlled MV thus provides a plausible explanation for the reduced RSA. Finally, our results showed that assisted MV resulted in a pattern of RSA that is closer to that observed during spontaneous breathing (Carvalho et al 2009, Van de Louw et al 2010b), compared to controlled MV. This is incompatible with baroreflex modulation of RSA during MV (with reversed intra-thoracic pressure oscillations), but entirely compatible with a persistent central drive.
4.1. Effect of variable ventilation on RSA
Our results indicate that during controlled MV a variable pattern of VT does not increase RSA amplitude. This observation differs from what reported by Mutch et al (2005), which might be related to differences between the experimental protocols. First, Mutch et al (2005) applied simultaneous changes of respiratory period and VT (to maintain minute ventilation constant breath-by-breath). Second, they employed considerably higher respiratory rates (approximately 20 min–1), which can influence RSA per se (Berntson et al 1993). Third, the use of different anesthetic agents with distinct cardiovascular and autonomic effects (Barash et al 2005) may have also influenced the results.
An additional new finding is that variable VT also does not influence RSA amplitude during assisted MV.
4.2. Cardioventilatory coupling
CVC was practically absent during controlled MV in our animals, in agreement with a previous report in humans (Larsen et al 1999). However, we showed for the first time that assisted MV restores a certain level of CVC. Hence, the overall effect of assisted MV goes beyond the simple increase of RSA, by reintroducing some level of synchronization between the cardiovascular and the respiratory system (see discussion above). It is interesting to note in this context that a loss of coupling between communicating organs has been suggested as a mediator of multiple organ dysfunction syndrome, and re-coupling may be a necessary step for recovery (Buchman 2002). Furthermore, variable ventilation did not improve CVC, in contrast to the speculations of Mutch et al (2005).
4.3. Possible clinical and methodological implications
During MV, the level of RSA clearly depends greatly on the mode (controlled or assisted) employed. Our results suggest that RSA during controlled MV could be significantly modulated by mechano-electric feedback in the heart, while central drive is suppressed. Hence, the commonly used interpretation that RSA reflects parasympathetic activity, based primarily on investigations of spontaneously breathing subjects, is probably not applicable in this condition. Consequently, previous speculations that changes in the parasympathetic modulation are responsible for the variation in RSA during controlled MV between different levels of sedation (Unoki et al 2009), settings of MV (Van de Louw et al 2010a), and managements of anesthesia (Galletly et al 1994, Latson et al 1992), might be reconsidered taking into account the possible direct effects of MV on cardiovascular oscillations, such as the mechano-electric feedback in the heart due to variations in hemodynamic and intra-thoracic pressure (Beda et al 2011).
Furthermore, care should be taken when using indexes based on RSA as outcome predictors in mixed populations of patients including mechanically ventilated and spontaneously breathing subjects, as in the work by Schmidt et al (2005). When taking the results of the present and previous works (Freyschuss and Melcher 1975, Koh et al 1998, Van de Louw et al 2008) together, it seems that the transition from spontaneous to assisted to controlled ventilation is associated with a progressive decrease in RSA. If the plausible assumption is made that the severity of the clinical condition and the level of sedation influence the choice of the ventilation strategy (i.e. sicker and deeply sedated patients are more likely to receive controlled MV), a significant correlation between outcome and RSA could reflect the use of different ventilation strategies and anesthesia management, rather than pathological alterations in autonomic function.
It is questionable if the increased heart-rate variability and RSA amplitude found during assisted compared to controlled MV should be interpreted as a beneficial effect of the former. The discussion above suggests that they may simply reflect the activity of distinct physiological mechanisms depending on the MV mode considered. This adds a further argument to the increasing criticism of the use of the amplitude of heart-rate variability to assess the 'health' of autonomic regulation (Parati et al 2006).
The importance of RSA/CVC for improving gas exchange through better ventilation/perfusion matching proposed by Hayano et al (1996) and supported by other investigations (Giardino et al 2003) was questioned in recent studies, based on experimental evidence that there is no change in the ventilatory equivalents of CO2 (ratio between CO2 production and minute ventilation) and O2 (ratio between O2 consumption and minute ventilation) between conditions with significantly different levels of RSA/CVC (Hayano et al 1996, Tzeng et al 2009). However, these indexes are imperfect measures of pulmonary gas exchange efficiency (Tharion and Subramani 2011). Nevertheless, our results are in line with the conclusions in the former works: the two-fold increase in RSA and the significant CVC during assisted compared to controlled MV was not paralleled by a significant improvement in oxygenation. It is worth noting that our study is the first to provide evidence of this kind using the more appropriate direct measurement of blood oxygenation.
4.4. Limitations
Several limitations in our study should be acknowledged. First, while the MV settings were kept as close as possible to those generally adopted in clinical routine (e.g. elective surgery), inspiration/expiration ratio during controlled MV was kept relatively low compared to common practice, in order to guarantee comparability with assisted MV. The resulting short inspiratory times (of the order of 1 s) might have favored the faster mechano-electric feedback in the heart in modulating RSA, while penalizing the slower baroreflex response.
Second, respiratory rates were kept relatively low in order to investigate RSA, resulting in levels of arterial CO2 higher than the physiological range. However, since we used a crossover design this limitation is not likely to play an important role. Furthermore, Sasano et al reported no significant differences in RSA between end-tidal partial pressure of CO2 of 40 mmHg (i.e. 'physiological condition') and 50 mmHg (compatible with the values found in our study, since partial pressure of CO2 in arterial blood is expected to be 1–5 mmHg higher) (Sasano et al 2002). This, together with the depressed responsiveness to CO2 associated with the sedation regime (Barash et al 2005, Poyhonen et al 2004) and the level of pH within the physiological range (see table 2), suggests that lower values of arterial CO2 would not have influenced the results obtained.
Third, a muscle paralyzing agent was administered during controlled ventilation to avoid spontaneous breathing activity. However, previous findings suggest that the dosages of atracurium used in this study have no effect on the autonomic nervous system (Hughes and Chapple 1981).
Fourth, the interpretation of phase shift computed from transfer function estimation is ambiguous by definition, since a positive shift of α rad (0 ≤ α ≤ 2π, input leading output) can always be interpreted as a negative shift of α – 2π rad (output leading input). Applying this concept to time delays, the negative average delay between SAP and R–R during assisted ventilation, which we estimated to be more than 1 s, could as well be 'recalculated' as SAP leading R–R with a delay of >5.2 s. However, such positive delay seems physiologically unlikely, because it is significantly larger than the average respiratory period during assisted MV (<4.5 s), which would imply a baroreflex modulation in the HF acting only on the next respiratory cycle. Nevertheless, due to the limited literature available regarding the baroreflex delay in pigs, we cannot completely exclude this hypothesis.
5. Conclusions
We conclude that in anesthetized pigs, PSV increases the RSA amplitude and CVC compared to PCV, while variable ventilation does not affect these phenomena. Our data suggest that the central respiratory drive, but not the baroreflex or the mechano-electric feedback in the heart, is likely the main mechanism behind such an increase. Hence, differences in RSA between mechanically ventilated patients might reflect the difference in ventilation mode rather than autonomic impairment. Also, considering the lack of significant differences in gas exchange between the groups, the results suggest that RSA is unlikely to play a physiologically significant role in improving ventilation/perfusion matching in the MV conditions considered.
Acknowledgment
This project was financed by the MedDrive program 2009/10 of the Medical Faculty Carl Gustav Carus, Dresden University of Technology, Dresden, Germany.