
Abstract
Noise is a proven cause of wakefulness and qualitative sleep disturbance in critically ill patients. A sound pressure level reduction can improve sleep quality, but there are no studies showing the feasibility of such a noise reduction in the intensive care unit (ICU) setting. Considering all available evidence, we redesigned two ICU rooms with the aim of investigating the physiological and clinical impact of a healing environment, including a noise reduction and day-night variations of sound level. Within an experimental design, we recorded 96 h of sound-pressure levels in standard ICU rooms and the modified ICU rooms. In addition, we performed a sound source observation by human observers. Our results show that we reduced A-weighted equivalent sound pressure levels and maximum sound pressure levels with our architectural interventions. During night-time, the modification led to a significant decrease in 50 dB threshold overruns from 65.5% to 39.9% (door side) and from 50% to 10.5% (window side). Sound peaks of more than 60 decibels were significantly reduced from 62.0% to 26.7% (door side) and 59.3% to 30.3% (window side). Time-series analysis of linear trends revealed a significantly more distinct day-night pattern in the modified rooms with lower sound levels during night-times. Observed sound sources during night revealed four times as many talking events in the standard room compared to the modified room. In summary, we show that it is feasible to reduce sound pressure levels using architectural modifications.
Export citation and abstract BibTeX RIS

Original content from this work may be used under the terms of the Creative Commons Attribution 3.0 licence. Any further distribution of this work must maintain attribution to the author(s) and the title of the work, journal citation and DOI.
1. Introduction
In the next decade, the demand for intensive care unit (ICU) capacity is projected to grow rapidly because of an ageing population in many countries (HRSA 2006). Therefore, an ICU design that supports patient recovery becomes increasingly important, as it might reduce the ICU length of stay, allowing a higher patient turnover and ultimately a reduction of health care costs (Halpern 2014a, 2014b, 2014c). We facilitated this approach of a 'healing ICU-environment' by redesigning two pilot ICU rooms. One key objective of the architectural modifications was noise reduction. Sleep quality in critically ill patients is known to be poor (Aaron et al 1996, Thornley et al 2000, Friese et al 2007, Pisani et al 2014), and noise related wakefulness has been described as a major subjective stressor in patient surveys (Novaes et al 1997, Little et al 2012). Sleep-promoting environmental changes are recommended by international guidelines (Barr et al 2013) and should be considered when designing ICUs (Thompson et al 2012).
In 1999, the World Health Organisation (WHO) has published a guideline for community noise, which includes recommendations of sound pressure level (SPL) thresholds for hospitals. The WHO suggests that the A-weighted energy equivalent SPL (LAeq) in rooms in which patients are being treated or observed should not exceed 35 decibels (dB) during the day and the A-weighted maximum SPL with fast time constant (LAFmax) should not exceed 40 dB during the night (Berglund et al 1999).
SPLs in hospitals and particularly on the ICU exceed WHO recommendations during all day- and night-times (Falk and Woods 1973, Soutar and Wilson 1986, Kahn et al 1998, Salandin et al 2011, Darbyshire and Young 2013). Previous studies examined the effect of pharmacological and non-pharmacological interventions on sleep in ICU patients. Whereas there is evidence that nocturnal sedation worsens the already bad sleep quality in terms of reducing rapid eye movement (REM) sleep and slow wave sleep (SWS) (Kondili et al 2012, Seymour et al 2012), there is a proven effect of non-pharmacological interventions. Earplugs, for example, showed to be an effective device to improve patients' perception of sleep quality (Van Rompaey et al 2012). Although a possible sensory deprivation makes them unsuitable for patients who are unable to decide whether to wear them. So far, there is no study investigating the potential of an architectural approach to reduce noise in ICU patient rooms. We hypothesised that modifications of the room led to a significant decrease of SPLs with fewer threshold overruns and a more pronounced day-night rhythm of SPLs.
2. Methods
We conducted an observational study at a tertiary hospital in Germany between June 2014 and August 2014.
Before the observational period (between April 2013 and October 2013), two of seven two-bed rooms received acoustic modifications. The rationale for these modifications was the review of architecture and installations in our standard ICU rooms by a multidisciplinary team. The review process was complemented by a literature search to consider typical noise sources, which have previously been reported in studies on the ICU (Tegnestedt et al 2013, Park et al 2014, Simons et al 2014). This process revealed three major sound categories: (1) sound related to humans; (2) sound emitted by medical or technical equipment; (3) sound entering the room from outside (figure 1). Additionally, we found sound-amplifying factors such as sound-reflecting surfaces and the acoustical features of doors that ease noise transmission. These categories show that SPLs on the ICU are rather a result from a combination of architecture, material characteristics, workflow and equipment performance than being caused by only one factor. We conducted multiple interventions aiming at all given points (figure 1(B)).

Figure 1. Architectural sketch of standard (A) and modified (B) room. In colour highlighted are three noise categories: in red highlighted are potential noise sources of technical equipment; in green-yellow highlighted are potential noise sources related to humans/working noise; in light-blue highlighted is noise that has its source outside the room and enters the room via open doors. Noise sources have been specified with capital letters: W = main workplaces for nurses and physicians, V = ventilator (only ventilation module without panel), P = panel (with alarms), M = hemodynamic monitor, S = syringe and infusion pumps. The main access to both rooms is indicated by the word traffic.
Download figure:
Standard image High-resolution imageIn detail, these interventions comprised the development of a technical corridor to place medical equipment (e.g. breath delivery unit of the ventilator, the connections for compressed air, oxygen, and vacuum as well as the syringe infusion pumps) in a position behind the patients' head with a sound protective, wooden wall between the bed and the noise-emitting units (figures 2(A) and (B)). As all rooms on our ICU are two-bed rooms, we decided to place a noise-shielding sideboard between both patients (figure 2(B)).

Figure 2. Pictures of the modified rooms ((A) and (B)) and the observation room (C). The intervention comprised the development of a technical corridor to place medical equipment like the breath delivery unit of the ventilator (A) and the syringe/infusion pumps (B) in a position behind the patient's head with a sound-protective, wooden wall between the bed and the noise-emitting units. In order to reduce human and working related noise, as well as alarms, we created an observation room in between both modified patient rooms (C).
Download figure:
Standard image High-resolution imageTo reduce human and working related noise, as well as alarms at the bedside, we created a closed working space between the modified rooms (PR) (figure 2(C)). This working room (WR) allows observation of the patients through a window, provides computer working-spaces, patient monitors, and a double-catering-door system to supply the patient area from the WR with mobile units. In addition, the WR consists of a syringe infusion pump alarm-system to avoid alarms at the bedside. Ultimately, the WR provides the main entrance to the PR. As the WR has a double door system, it shields the room from corridor noise (figure 1(B)). The WR is equipped with a ceiling providing a weighted sound absorption coefficient (SAC) of  (according to the EuroNorm International Organisation for Standardisation (EN ISO) 11654) and a weighted sound reduction index
  of 36 dB. The PR's main door is equipped with an automatic closing mechanism and provides a Rw of 42 dB. This door should only be used for traffic of beds, large equipment and emergencies (figure 1(B) and 2(A)).
Besides the interventions aimed at noise shielding and the change of workflow, we conducted modifications to improve the acoustic features of the room itself: one integral part of the new room concept is a screen that extends from the head above the patient down to the patient's feet (figure 2(A)). It covers an area of 25 m2 per room and consists of a light-emitting diode (LED) grid placed on an acoustic foam with a weighted SAC of  , covered by a polyvinyl chloride sheet with a weighted SAC of
  (DIN EN 11654). The noise-shielding furniture has been constructed by use of dense wooden material of 19 mm thickness with a density of 700 kg m−3 (EN 323). It features an intensity sound reduction index (Ri) of 28 dB and a weighted SAC of
  in frequency range of 250 Hz to 500 Hz and
  in frequency range of 1000 Hz to 2000 Hz (EN 13986).
The modified and the standard rooms were staffed with the same nurses, therapists, and physicians. A 'door closed' and 'silence at night' training program was delivered to the entire before the rebuilding of the two rooms. The standard and the modified rooms are equally staffed and located on the same ICU. The study has been approved and registered under the local ethical number EA1/019/14 and is part of the VITALITY study, which has been registered under NCT02143661. The local ethics committee waived noise measurements without informed consent.
2.1. Study design and sound pressure level assessment
We recorded SPLs in 24 h periods in the standard and the modified rooms. We did a retrospective matching of measurements (M2–M4) regarding occupancy and running equipment in the rooms. Matching criteria were the following:
- (i)Both rooms had the same medical equipment running for
 20 h (e.g. mechanical ventilation, continuous renal replacement therapy (CRRT), extracorporeal membrane oxygenation (ECMO), etc).
 - (ii)Both rooms were fully occupied (two patients in each room) for20 h.
- (iii)There were no admissions or discharges in both rooms during SPL measurement.


The same matching criteria accounted for the first measurement (M1), but, in contrast, we prospectively matched patients, because we performed an additional sound source observation during M1. As human observers were only available within a limited time window, we needed to go for this bi-parted approach. Observers (trained study staff) were placed in both rooms and documented all sounds they perceived in an electronic case report form.
We defined the core night-time between midnight and 5 am, as there was neither a medical or nursing handover. N1, N2, N3 and N4 refer to SPLs obtained during the core night-time of M1, M2, M3 and M4.
Recorders were placed approximately 40 cm from the patient's head with no sound barriers between the ear of the patient and the sound recorder. During M1, we placed sound recorders at the door and window side of the modified and the standard room. To reveal as many comparable measurements as possible, we distributed the recorders for the other measurements among the rooms (M2–M4). There were four recorders available, so we placed them alternately at the door and the window side.
We recorded environmental noise continuously using the XL2 sound level meter & acoustic analyzer with a M2233 microphone. The sound meters were calibrated prior to the study with a Precision Calibrator 94/114 dB. The devices were programmed to record LAeq and LAFmax every minute.
Clinical routine data from all observed patients were extracted from the electronic patient data management systems. We used Acute Physiology and Chronic Health Evaluation II (APACHE II) score to quantify the severity of illness and Therapeutic Intervention Scoring System (TISS) 28 for the level of nursing care.
2.2. Post-processing of time-series for data visualisation
We used symmetric moving average filters with uniform weights to reduce noise from the graphs illustrating the SPLs (time-series data). For the 24 h data (figure 3), we applied a span of 81, which means, we averaged the first 40 lagged values, the current value, and the first 40 forward terms of the series, with each term in the average receiving a weight of 1 ( ). Figure 5 shows the post-processed LAFmax values of M1 to M4. For this, we averaged the first 120 lagged values, the current value, and the first 120 forward terms of the series, with each term in the average receiving a weight of 1 (
 ). To show whether or not there is a variation of the SPLs that depends on day and night activities, we calculated linear trends for LAeq. This method accounts for time dependence and allows a comparison of rather the course of the measured SPLs than mean values.

Figure 3. LAeq's of measurement 1 (M1). Shown is moving average (40; 1; 40) of LAeq during measurement 1 for door site (A) and window site (B). The corresponding trend lines have been inserted. Tests of linear trends between standard and modified design: (A) slope not significantly different, intercept significantly different; (B) slope and intercept significantly different. dB, decibel; LAeq, A-weighted energy-equivalent sound pressure level.
Download figure:
Standard image High-resolution image2.3. Statistical analysis
First, we compared SPLs between standard and modified rooms without adjustment for time dependency. Welch's t-test statistics were applied to prove for differences between groups (standard versus modified rooms) regarding LAeq and LAFmax. To evaluate the distribution of LAFmax values in the rooms, we calculated areas under the curves (AUC) and determined the ratio of the AUC above a certain threshold and the whole AUC. The frequencies of threshold overruns for LAeq (>50 dB) and LAFmax (>60 dB) in the standard and modified rooms were compared using Fisher's exact test. Secondly, SPLs were evaluated by applying methods for time-series analysis. We used Bartlett's test to check for the null hypothesis that the data come from a white-noise process of uncorrelated random variables having a constant mean and a constant variance. Linear trends of LAeq values measured during M1 were compared for differences between the standard and modified rooms with respect to slope and intercept using standard statistical methods (Sachs 2003). All tests were conducted in the area of exploratory data analysis. Therefore, no adjustments for multiple testing have been made. A p-value of <0.05 was considered significant. All numerical calculations were performed using STATA, Version 13 and the R Project for Statistical Computing, Version 3.0.2.
3. Results
During M1, both rooms were equally staffed, and two ventilated patients were assigned to each room. The mean APACHE II score during M1 was 19 and 19.5, respectively. The TISS-28 showed an equal level of nursing care in both rooms (35 points each). One patient in the standard room was in theatre for 3 h because of an unplanned surgery.
The matching process revealed comparable measurements only between the standard room with the recorder at the window side and the modified room with the recorder at the door side. During M2, M3, and M4 the observed rooms had an occupancy of two patients each. There were no discharges and no admittances. All patients that were treated in the rooms during M2 to M4 have been mechanically ventilated. In each room, one patient needed a CRRT. During M2, the APACHE II was higher in the modified room (32 versus 24.5) and during M3, the APACHE II was higher in the standard room (22 versus 26). APACHE II values for M1 and M4 showed differences  1 point between the two designs. The TISS-28, which is a measure of nursing activities at the patient's bedside, revealed a difference of 17.5 points during M2 and 14.5 points during M3 with higher scores in the standard room (table 1).
Table 1. Summary of patient characteristics during noise recordings in the standard (a) and the modified (b) rooms.
| (a) Standard room | ||||
|---|---|---|---|---|
| M1 | M2 | M3 | M4 | |
| Full occupancy (h) | 21 | 22 | 22 | 24 |
| APACHE II | 19 | 24.5 | 26 | 20 |
| TISS-28 | 35 | 47.5 | 43 | 33.5 |
| Patients ventilated (n) | 2 | 2 | 2 | 2 |
| Patients with CRRT (n) | 0 | 1 | 1 | 1 |
| (b) Modified room | ||||
|---|---|---|---|---|
| M1 | M2 | M3 | M4 | |
| Full occupancy (h) | 24 | 23 | 24 | 24 |
| APACHE II | 19.5 | 32 | 22.5 | 21 |
| TISS-28 | 35 | 30 | 28.5 | 33 |
| Patients ventilated (n) | 2 | 2 | 2 | 2 |
| Patients with CRRT (n) | 0 | 1 | 1 | 1 |
Note: each measurement (M1–M4) represents a 24 h period. APACHE II, Acute Physiology and Chronic Health Evaluation II; TISS-28, Therapeutic Intervention Scoring System; CRRT, Continuous Renal Replacement Therapy.
Barlett's periodogram-based test confirmed that time series including all SPLs of M1–M4 where significantly different from white noise.
3.1. Measurement (M1)
LAeqs were significantly lower in the modified rooms than in the standard rooms. Although the LAeq was significantly lower at the window site of both rooms, the reduction of LAeq in the modified room was more pronounced at the window side (window: −2.53 dB versus door: −2.25 dB). The course of the obtained LAFmax values was in line with the LAeq-findings, but resulted in a larger decrease at the door side (door: −2.97 dB versus window: −2.13 dB). Within the rooms, there was no significant difference of LAFmax between door and window side (p = 0.1048, standard room and p = 0.2557, modified room) (table 2).
Table 2. Sound levels during 24 h.
| LAeq (dB) | LAFmax (dB) | |||
|---|---|---|---|---|
| Standard room | Modified room | Standard room | Modified room | |
| M1-D |  |
 |
 |
 |
| M1-W |  |
 |
 |
 |
| M2 |  |
 |
 |
 |
| M3 |  |
 |
 |
 |
| M4 |  |
 |
 |
 |
Note: each measurement (M1–M4) represents a 24 h recording of LAeq and LAFmax at one-minute intervals. Values are presented as means ± standard deviation. M1 included a door (M1-D) and a window (M1-W) measurement in the standard and the modified room, whereas during M2 to M4 the sound recorders were placed at the door in the modified room and at the window in the standard room. There were no admissions or discharges at measuring sites. Inter-group analysis between standard and modified rooms using Welchs t-test revealed a p < 0.0001 for all measurements. dB, decibel; LAeq, A-weighted energy-equivalent sound pressure level; LAFmax, A-weighted energy-equivalent sound pressure level, fast-time weighted.
3.2. Following measurements (M2–M4)
The second (M2) and fourth measurement (M4) showed a significantly lower LAeq (M2: −0.99 dB; M4: −0.77 dB) in favour for the modified room. The LAeq during M3 was significantly higher in the modified room compared to the standard room (+1.72 dB). We searched for structural differences and could identify a water-chamber sealed chest drain in the modified room. However, LAFmax remained significantly lower in the modified room compared to the standard room during all measurements (M2 −5.22 dB; M3 −0.83 dB; M4 −2.7 dB) (table 2).
3.3. Measurements during core night-time
During the first night (N1), SPLs were significantly lower in the modified room than in the standard room (table 3). More precisely, an almost flat shape characterizes the curves obtained in the modified room whereas the standard room's curve shows several sound-peaks (figure 4). Taking into consideration the room's door side during N1, with a 50 dB threshold for LAeq, we found 191 min (65.5%) of exceedance in the standard room compared to 119 min (39.9%) in the modified room. At the window side, the frequency of threshold overruns regarding LAeq during N1 was even more reduced (142 min (50.0%) versus 30 min (10.5%)) (table 4(a)).

Figure 4. LAeq values of measurement 1 (M1) during core night-time. Shown is door (N1-D, upper graphs A+B) and window side (N1-W, lower graphs C+D) in the modified design (right: B+D) and the standard design (left: A+C). dB, decibel; LAeq, A-weighted energy-equivalent sound pressure level.
Download figure:
Standard image High-resolution imageTable 3. Sound levels during nights.
| LAeq (dB) | LAFmax (dB) | |||||
|---|---|---|---|---|---|---|
| Standard room | Modified room | p | Standard room | Modified room | p | |
| N1-D |  |
 |
<0.001 |  |
 |
<0.001 |
| N1-W |  |
 |
<0.001 |  |
 |
<0.001 |
| N2 |  |
 |
0.5460 |  |
 |
<0.001 |
| N3 |  |
 |
<0.001 |  |
 |
0.2817 |
| N4 |  |
 |
<0.001 |  |
 |
<0.001 |
Note: each measurement (N1–N4) represents a 5 h recording of LAeq and LAFmax at one-minute intervals in the core night-time from midnight to 5 am. Values are presented as means ± standard deviation. N1 included a door (N1-D) and a window (N1-W) measurement in the standard and the modified room, whereas during N2–N4 the sound recorders were placed at the door in the modified room and at the window in the standard room. Inter-group analysis between standard and modified rooms was performed with Welch's t-test. A  indicates significant differences. dB, decibel; LAeq, A-weighted energy-equivalent sound pressure level; LAFmax, A-weighted energy-equivalent sound pressure level, fast-time weighted.
Table 4. Area under the curve of LAeq > 50 dB (a) and LAFmax > 60 dB (b) during night.
| (a) LAeq > 50 dB | ||||
|---|---|---|---|---|
| Standard room | Modified room | |||
| Door | Window | Door | Window | |
 |
65.5 | 50.0 | 39.9 | 10.5 |
| AUC | 10397 | 7791 | 6037 | 1546 |
| n | 191 | 142 | 119 | 30 |
| (b) LAFmax > 60 dB | ||||
|---|---|---|---|---|
| Standard room | Modified room | |||
| Door | Window | Door | Window | |
 |
62.0 | 59.3 | 26.7 | 30.3 |
| AUC | 11623 | 11049 | 4510 | 5105 |
| n | 170 | 162 | 67 | 76 |
Note: area under the curve (AUC) of LAeq values (at 1 min intervals), AUC above cut-off 50 dB (a) and 60 dB (b) in % (% of total AUC) and exceedance above 50 dB (a) and 60 dB (b) in numbers (n) are shown. Core night-time was defined between midnight and 5 am as there is no medical or nursing handover (301 time points). The shown data derive from the first measurement. Comparisons for exceedance between standard and modified room either at the door or the window side revealed significance with p < 0.0001 (Fisher's exact test). dB, decibel; LAeq, A-weighted energy-equivalent sound pressure level.
The proportion of values above the LAFmax 60 dB threshold accounted for most of all records in the standard rooms (door: 62.0% window: 59.3%), whereas for the minority of the modified rooms (door: 26.7%, window: 30.3%) (table 4(b)). Frequencies of threshold overruns between standard and modified rooms differed significantly (p <0.0001).
Results of SPL recordings during the fourth night (N4) were in line with results from N1. The second night (N2) showed no significant difference in LAeq but a significantly lower LAFmax in the modified room. During the third night (N3) LAeq in the modified room exceeded the standard room's values significantly (table 3).
3.4. Day/night patterns
During M1, LAeq-comparisons between day and night values emerged in significantly higher LAeqs during the day, independent of the location of the sound recorder or the room design. The lowest day-night difference was observed at the standard room's door-bed ( dB) and the highest difference emerged at the modified room's window bed (
 dB). Although both rooms revealed this significant reduction of noise levels from day to night, the analysis of linear trends showed a significantly more distinct day-night variation at the modified room's window bed compared to the standard room's window bed. This significant trend difference could not be shown between the door-site of the rooms (figure 3). The same accounted for the analysis of LAFmax trend lines during measurement M1: they showed a trend towards an increased sound level at daytimes compared to nighttimes at the window side but not at the door side of the room.
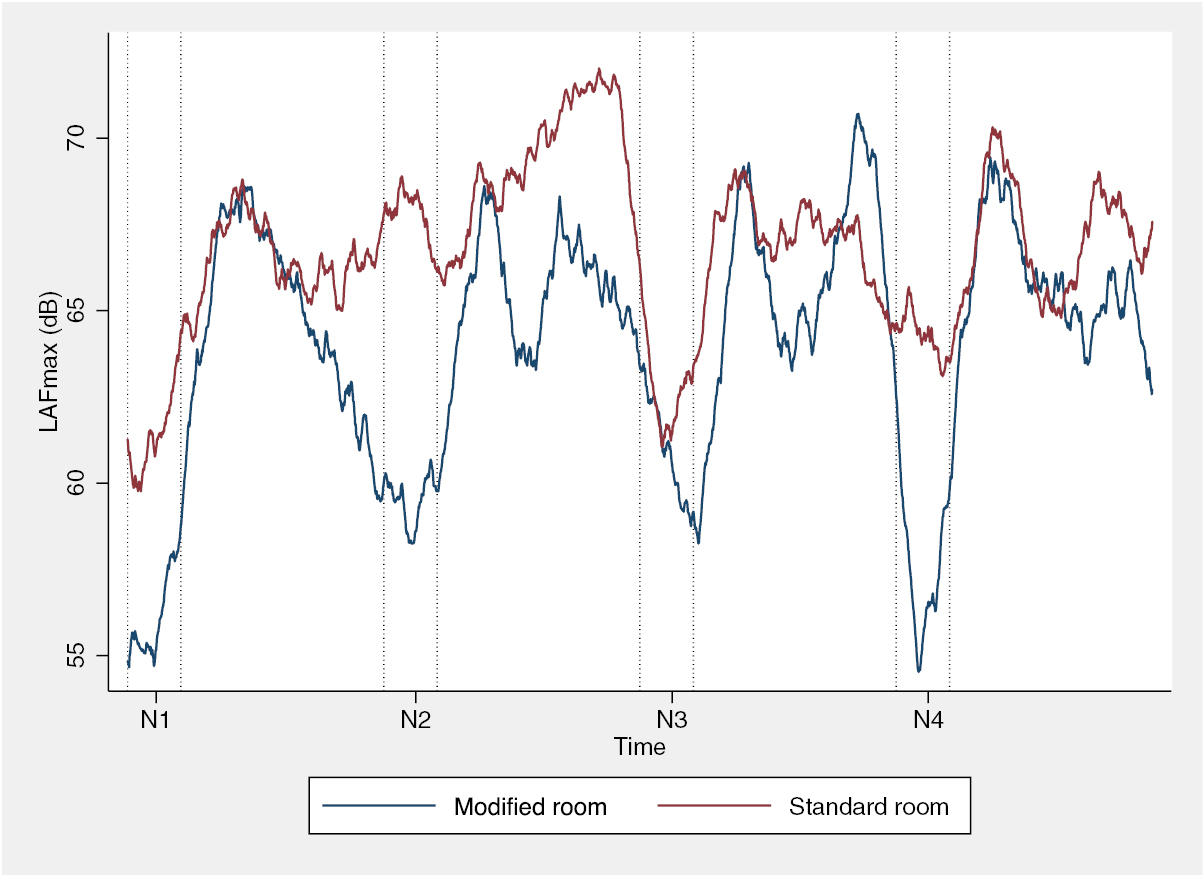
Looking at all four 24 h measurements (M1–M4), the moving average of LAFmax values in the modified rooms showed a distinct day-night pattern, characterised by a significant decrease of SPLs during core night-time. In contrast, day-night variations of LAFmax in the standard rooms were less pronounced and less stable. During M2 and M4 average values decreased only slightly during core night-time (figure 5).

Figure 5. LAFmax values during the 96 h period. LAFmax measurements for 96 h period (measurement 1-4) in standard (red) and modified (blue) design connected in series. Shown is moving average (120; 1; 120). Night-time from midnight to 5 am has been highlighted for each of the measurements and labelled N1 to N4. dB, decibel; LAeq, A-weighted energy-equivalent sound pressure level; LAFmax, A-weighted energy-equivalent sound pressure level, fast-time weighted.
Download figure:
Standard image High-resolution image3.5. Sound-source observation
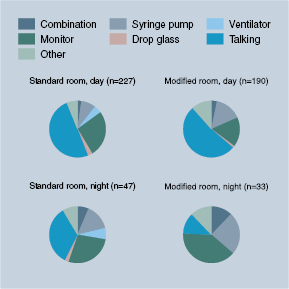
During M1, the observers documented 497 sounds or sound-combinations. Two-hundred seventy-four events were registered in the standard design compared to 223 in the modified design. The distribution of sound sources differed between the rooms: in the standard room, 54% of the events were located on the door side whereas in the modified room only 37% of the noises were located on the door side. During the observation, the main entrance door of the standard room was partly open at all times. The main door of the modified room was open at 5.41% during the 24 h period. The documentation revealed a total of 232 single events related to conversation between ICU staff members (standard room: 128; modified room: 104). During night-time, we observed as fourth as many talking events in the standard room (n = 16) compared to the modified room (n = 4) (figure 6).
Figure 6. Subjective observation of sound-sources in standard and modified rooms. Upper pie-charts represent the event distribution during day and the lower pie-charts represent the distribution during night. Data were acquired during the first measurement (M1) in the 24 h period. Human observers were placed in the room and electronically recorded all observed sound-events.
Download figure:
Standard image High-resolution image
4. Discussion
Our experimental study is the first which compares SPLs measured in two different ICU room designs. The results revealed that a bundle of architectural modifications, targeting at a redirection of staff and visitor traffic, a relocation of working places, and a shielding against noise from the corridor, is effective for reducing noise in the patient room.
We were able to demonstrate that mean LAeq levels were significantly lower in the modified rooms when compared to the standard rooms with a reduction of up to 3 dB. Interestingly, the decrease in mean LAFmax values, which might be even more important due to sound peak related arousals, was more pronounced at the door side compared to the window side of the modified room (reduction of up to 10 dB). To better estimate the impact of differences in SPLs, it is important to know that dB is a logarithmic unit. In general, every 3 dB increase corresponds to a doubling of acoustical energy. However, the perceived loudness, which is a subjective phenomenon, doubles with an increase of 10 dB. It is likely that these values are not applicable to critically ill patients. Sedatives and other commonly used drugs for ICU treatment, as well as the severity of illness, might raise the sensitivity to noise in those patients.
Previous investigations on SPLs revealed that the WHO-recommendations (<35 dB during night-times and <40 dB during day-times) could not be achieved in an intensive care setting (Salandin et al 2011, Darbyshire and Young 2013, Park et al 2014). Our data are in line with results of these previous investigations. The 35 dB threshold overruns are attributable to the baseline SPLs caused by constant noise-emitting sources, such as air-conditioning or operating noise of the ventilator. Darbyshire and Young reported that they could only achieve WHO-recommendations in a side room with all equipment being turned off (Darbyshire and Young 2013). However, it remains hypothetical which absolute sound-level reductions are necessary to improve sleep quality in critically ill patients. Experimental studies in healthy volunteers show that, given the base sound level is constant, not the extend of the sound-peak but rather the exposure to the peak itself leads to arousals and sleep fragmentation. Persson Waye and colleagues could show that healthy volunteers, even when exposed to an ICU environment with attenuated peak levels, had significantly more arousals and a worse sleep quality compared to participants sleeping in a reference, non-ICU environment (Persson Waye et al 2013). Therefore, it seems important to apply thresholds, which allow distinguishing between peak levels and baseline noise. We chose a 50 dB threshold for LAeq and a 60 dB threshold for LAFmax. Lower thresholds (e.g. 40 dB for LAeq) would have led to a constant overrun, whereas higher thresholds (e.g. 60 dB for LAeq) would have led to an underdetection of peak levels. Nevertheless, this approach was rather practical than evidence-based. Further studies are needed to establish distinct, relevant thresholds for noise peaks. We obtained significantly less overruns in the modified room, indicating that the SPL is more stable in the modified rooms which possibly leads to less sleep-fragmentation.
While acknowledging recent guideline recommendations, the ideal ICU environment should support activity during daytime, as well as sleep and rest during night-time (Barr et al 2013, DAS-Taskforce et al 2015). As sedatives do not promote the amount of REM sleep (Kondili et al 2012) or SWS (Gehlbach et al 2012), the promotion of a sleep-friendly environment might be an alternative to support physiological sleep patterns (Meyer et al 1994, Walder et al 2000, Gardner et al 2009). Our investigation of ICU SPLs revealed more distinct day-night patterns in the modified rooms when compared to the standard rooms. More precisely, we found that LAFmax values in the modified rooms were considerably lower during core night-time of all included 24 h measurements. In contrast, the decrease of LAFmax in the standard rooms was marginal or not exsistent (M2). We have been able to quantify day-night variations statistically by using time-series analysis. It revealed that the decrease of LAeq values from day to night at the window sides were significantly more pronounced in the modified room compared to the standard room.
We used multiple modifications that contributed to the observed reduction in SPLs. Although we did not perform a sound mapping, the sound-source observations revealed that talking-events during night-time could be significantly reduced. The WR, which offers the possibility for staff to relocate activities during the night, is presumably one of the most effective measures to reduce noise. In addition, the automatic closing mechanism of the main entrance door might have reduced the noise from the corridor. This hypothesis would also explain why the noise reduction at the door side was more pronounced compared to the window side.
There was no distinct trend towards a higher severity of illness for patients treated in the standard or modified rooms. However, TISS-28 scores, which indicate the amount of nursing care workload, were lower in the modified rooms compared to the standard rooms. This difference might be partially explained by the remodeling of the rooms which was aimed not only at noise shielding, but also at optimisation of workflow. Nevertheless, this is still a hypothesis that will be subject to future studies. Furthermore, patients in the standard rooms tended to receive more interventions inside and outside of the ICU, which calculates for extra TISS-28 points.
Our study has several strengths: firstly, we had the unique opportunity to measure standard and modified rooms in parallel, which makes a bias due to changed behaviour or different settings unlikely. Both rooms were staffed equally and there were no special instructions. Our management of analgesia, sedation, and delirium is in-line with current guideline recommendations, and the observed ICU has a long-standing sleep-friendly policy that acknowledges core night-time regardless of the room. As we used predefined criteria to match recordings in the standard rooms with recordings in the modified rooms, we also minimised the risk of bias related to differences in running equipment, and patient occupancy. A systematically increased SPL during M3 due to a water-sealed chest drain confirmed our concerns.
Nevertheless, there are also limitations: while we investigated a theoretically more sleep-friendly sound environment, the clinical impact of these results remain hypothetical, given that we conducted experimental sound measurements without patient data regarding sleep (e.g. polysomnography). Even if we added those clinical data, we could not be sure that they are related to the noise-reduction, as the remodeliing was also aimed at other features. Besides, we controlled only M1 in respect to prospectively allocating patients to rooms and ensure a uniform setting. Even during this allocation, one patient in the standard design left the room for 3 h due to surgery. We retained this measurement, because it promoted the standard room. This is nevertheless an important limitation, as SPLs tend to decrease if fewer patients are treated in the room.
Another methodological concern is the limited amount of comparable 24 h sound recordings. This might be due to the fact that our mixed ICU setting has a very heterogeneous patient population. We extended the observation period to 3 months and were able to include four pairs of noise measurements. A subsequent, prospective matching of patients during clinical routine was not possible, as we usually have a full occupancy, and cannot allocate patients to specific rooms, but must use the next available bed.
In summary, we could show that our architectural modifications were effective in reducing noise levels, promoting a day-night pattern, as well a reducing peaks that are the main cause for arousals in healthy subjects. Our approach lies between an experimental, controlled measurement on the one hand, and a clinical routine setting on the other hand. Further studies are necessary to evaluate the effect on sleep and clinical outcome parameters.
Acknowledgments
The authors would like to thank all nurses and physicians on the ICU for their unlimited support of the study. A very special honor and thank you goes to Maria Deja, Steffen Weber-Carstens, and Andreas Sund who had major impact in rebuilding the rooms. Susanne Zimmermann and Claudia Denke helped us to identify possible targets for the redesign. We would also like to thank our project partners Dennis Hegic, Susanne Kronfeld, Benjamin Albrecht, Ute Winninghoff, Ingrid Masswig, Jing He, Norman Wassmuth, Kai Dolata, Joachim Quantz, and Joachim Sauter. We thank Rudolf Moergeli for his thorough corrections of the final manuscript.
The research project was funded by the German Federation of Industrial Research Associations on behalf of the Federal Ministry of Economic Affairs and Energy (KF2882602KJ2).
AL is participant in the Charité Clinical Scientist Program funded by the Charité-Universitaetsmedizin Berlin and the Berlin Institute of Health.
TP was supported by the project no. LQ1605 from the National Program of Sustainability II and FNUSA-ICRC (No. CZ.1.05/1.1.00/02.0123).