

Abstract
Infant multiple breath washout (MBW) testing serves as a primary outcome in clinical studies. However, it is still unknown whether current software algorithms allow between-centre comparisons. In this study of healthy infants, we quantified MBW measurement errors and tried to improve data quality by simply changing software settings. We analyzed best quality MBW measurements performed with an ultrasonic flowmeter in 24 infants from two centres in Switzerland with the current software settings. To challenge the robustness of these settings, we also used alternative analysis approaches. Using the current analysis software, the coefficient of variation (CV) for functional residual capacity (FRC) differed significantly between centres (mean ± SD (%): 9.8 ± 5.6 and 5.8 ± 2.9, respectively, p = 0.039). In addition, FRC values calculated during the washout differed between −25 and +30% from those of the washin of the same tracing. Results were mainly influenced by analysis settings and temperature recordings. Changing few algorithms resulted in significantly more robust analysis. Non-systematic inter-centre differences can be reduced by using correctly recorded environmental data and simple changes in the software algorithms. We provide implications that greatly improve infant MBW outcomes' quality and can be applied when multicentre trials are conducted.
Export citation and abstract BibTeX RIS
1. Introduction
Infant lung function (ILF) testing is increasingly used nowadays (Davis et al 2010, Rosenfeld et al 2013, Peterson-Carmichael et al 2014) even as an outcome measure in interventional trials (Ramsey et al 2012, Stocks et al 2012, Subbarao et al 2013), thanks to the evolution of the techniques and to commercially available devices.
One commonly used ILF technique is the multiple breath washout (MBW) test that evaluates ventilation distribution in small airways (Robinson et al 2013, Vogt et al 2014, Subbarao et al 2015). It has been already established as a primary endpoint in single-centre clinical studies for infants with cystic fibrosis (CF) (Subbarao et al 2013) (Hall et al 2011, Kieninger et al 2011, Belessis et al 2012, Stahl et al 2014) and it is now included in multicentre clinical trials (Stick et al 2013) (https://clinicaltrials.gov/ identifier: NCT02270476 and NCT01619657). This raises the necessity to obtain comparable outcomes between centres.
To our knowledge, the only multicentre study measuring infant MBW with the ultrasonic flowmeter (Exhalyzer D, Eco Medics AG, Duernten, Switzerland) using sulphur hexafluoride (SF6) as tracer gas and the WBreath analysis software (ndd Medizintechnik AG, Zürich, Switzerland) was published by Hulskamp et al (2009). This is the only commercially available equipment for this kind of measurements, and, thus, the most commonly used (Latzin et al 2007, Fuchs et al 2011, Hall et al 2011, Belessis et al 2012, Stahl et al 2014, Gray et al 2015a). The authors reported large inter-centre differences in the functional residual capacity (FRC) of healthy infants between centres. This observation was unexpected, as the same equipment, software and protocol were used in all centres. The findings were attributed to undetectable between-centre hardware/software differences. If unknown and, more importantly, undetectable factors influence MBW outcomes, it is questionable whether multicentre trials can be performed using this software.
The first aim of this study was to quantify the magnitude of MBW measurement errors using the above-mentioned hardware and software. To address this, we used MBW measurements of healthy infants from two centres recorded from identical devices and following the same protocol. The second aim was to strengthen the quality of MBW outcomes by changing software settings.
2. Materials and methods
2.1. Study design and subjects
This is a retrospective software validation study using data from MBW measurements of healthy term-born infants from the BILD cohort study measured at two centres in Switzerland (Basel and Bern) (Fuchs et al 2012) between 1 January 2012 and 31 December 2013. The Ethics Committees of Basel and Bern approved the study and parents gave written consent.
2.2. MBW measurements
MBW measurements were performed in infants according to current ERS/ATS standards (Robinson et al 2013), as previously reported (Latzin et al 2007). In brief, unsedated infants were measured while breathing through an infant facemask (Homedica AG, Baar, Switzerland), during natural sleep, in a supine position with the head midline through an ultrasonic flowmeter (Exhalyzer D, Eco Medics AG, Duernten, Switzerland) using 4% SF6, as previously described (Wauer et al 2003, Latzin et al 2007). Both centres used identical devices, the same patient interface and followed exactly the same protocol for the calibration and the performance of the measurements. The only part of the equipment that differed slightly between the centres was the deadspace reducer, which is mentioned below in details.
We used three best quality measurements per child during one non-REM sleeping period that is, without awakening between trials. Two investigators (BE and PA) performed the quality control and all analyses, independent of the centre. All analysis steps were double-checked by the other investigator to avoid observer-dependent bias.
2.3. Quantitative parameters for quality control of the analysis
The main MBW outcomes, FRC at mid-sensor point and lung clearance index (LCI) (Robinson et al 2013) calculated from the washout, are reported in this study. To evaluate the quality of the analysis, we used the difference in FRC and LCI between washout and washin (Diff-FRC(wo-wi) and Diff-LCI(wo-wi), respectively) for each trial, and the coefficient of variation of washout results (CV of FRC and CV of LCI) for the three trials per subject. As all measurements were performed within one sleeping period, the lower those values were, the more accurate the analysis.
2.4. Analysis
2.4.1. Standard analysis.
The analysis of the measurements was performed using the software provided by the manufacturer (WBreath Version 3.28.0.0, ndd Medizintechnik AG), if nothing else is reported. More details about the signal processing and other analysis parameters used are reported in the supplementary data. The initial standard analysis was based upon the following settings, as recommended by the manufacturer: use of the original temperature in files, deactivation of the expiratory molar mass (MM) fit option (figure S1(a)) (stacks.iop.org/PM/37/L1/mmedia), and use of 65–95% end expiration (EE) start and stop percentile (figure S1(b)) (stacks.iop.org/PM/37/L1/mmedia) (Latzin et al 2007). The deadspace subtraction was performed in the same way at both centres, as previously reported (Latzin et al 2007).
2.4.2. Alternative analysis settings
2.4.2.1. Analysis by changing the 'FRC-analysis' parameters.
To evaluate the impact of the commonly used analysis settings on MBW outcomes, we repeated the analysis using each time one of the following changes, while the rest of the analysis was performed as before: without temperature simulation; without MM step response correction, with MMFit, EE start and stop percentile set at 60–90%, 55–85%, and 50–80%, respectively (for details see supplementary data and figure S1) (stacks.iop.org/PM/37/L1/mmedia).
2.4.2.2. 'Room-' and 'case-temperature' refinement.
'Room-' and 'case-temperature' values are measured in different compartments of the device (see supplementary data and figure S2(a)) (stacks.iop.org/PM/37/L1/mmedia). They are recorded in the software during the measurement, are included in the algorithms of the temperature model (figure S2(a)) (stacks.iop.org/PM/37/L1/mmedia) and are user-changeable (figure S2(b)) (stacks.iop.org/PM/37/L1/mmedia). This model aims to correct the MM signal for the influence of temperature and humidity (Latzin et al 2007). During the calibration process before and after each measurement, we recorded the temperature of the air from the wall measured in the opening of the ultrasonic flowmeter (HygroPalm 1, Rotronic, Bassersdorf, Switzerland), and the mean of these values was calculated for each measurement. This measured temperature is much closer to the realistic temperature conditions inside the flowmeter, therefore both 'room-' and 'case-temperature' values recorded in the software were then substituted with mean calibration values.
2.4.2.3. Analysis with alternative MM step response corrections.
MM step response depends on MMDifuTau and SPLCham, physical constants included in the temperature model (Schmalisch et al 2015), described in detail in supplementary data. Due to minor differences in the deadspace reducer, these two values differed slightly between the centres (MMDifuTau: 4500 ms, SPLCham: 16.2 mm for Basel, MMDifuTau: 7500 ms, SPLCham: 19.2 mm for Bern) and were integrated appropriately in each centre's temperature model. To our knowledge, it is not possible to determine these values accurately; instead, they are set by the manufacturer during the installation process by eyeball approximation. The normalized MM curve was an indirect indication that these values were close to reality.
As both parameters are user-changeable, alternative values were entered into the model in the range of 4500–9000 ms for MMDifuTau and 16.2–20.7 mm for SPLCham. The rest of the analysis was performed as previously reported, using the refined 'room-' and 'case-temperature' values.
2.4.2.4. Analysis using different software versions
2.4.2.4.1. Analysis with a different software version of the same software package.
The measurements were additionally analyzed with a newer version of the software package (WBreath Version 3.39.4, ndd Medizintechnik AG, Zuerich, Switzerland). More details about this version are included in the supplementary data.
2.4.2.4.2. Analysis with a new software package.
In order to exclude other unknown factors that possibly influence the analysis in WBreath software, we used an alternative custom-made software for the analysis (LungSim 2.1.0, NM GmbH; Thalwil, Switzerland, running on Matlab, The Mathworks Inc., Natick, MA, USA). Prior to analysis, all appropriate corrections were applied to the original tracings in WBreath software. The refined 'room-' and 'case-temperature' values were used, as described above. The main differences of the new software compared to WBreath are shown in figure 1. More information is provided in the supplementary data.

Figure 1. Differences in end-inspiratory molar mass (EIMM) calculations between WBreath and LungSim. Original molar mass (MM) tracing of a SF6-MBW measurement from a healthy infant. The dashed line indicates the washout breath where the 2.5% end tracer gas concentration is reached. The enlarged part shows the MM signal during a single breath at the end of washin. The main differences between the software are the following: (i) for the EIMM calculation in both washin and washout LungSim uses the 45–75% part of inspiration which is more stable than the 65–95% used by WBreath. (ii) To determine the mean EIMM of the washout, and thus the EIMM-step, LungSim uses the last three inspirations before the end of washout while WBreath uses all washout inspirations. In case of inaccurate step-response correction, this leads to completely different EIMM-step values.
Download figure:
Standard image High-resolution image2.5. Statistics
Statistical analysis of the data was performed using GraphPad Prism version 5.00 for Windows (GraphPad Software, San Diego California, USA). We used Student's paired and unpaired t-test, and one-way ANOVA test, and p < 0.05 was considered significant.
3. Results
Our study included three measurements per subject from 12 infants (six females, median age 5.2 weeks) from Basel University Children's hospital, and 12 infants (six females, median age 4.9 weeks) from Bern University Children's hospital, thus 72 paired washin and washout traces (see table S1 (stacks.iop.org/PM/37/L1/mmedia) for detailed demographic characteristics).
3.1. Intra-subject, intra-centre and inter-centre variability using the standard analysis
We detected an unexpected high intra-subject and intra-centre variability based on the following results: (i). high non-systematic Diff-FRC(wo-wi) in single measurements ranging from −25 to +30% in both centres, as shown in figure 2(a), despite the good quality of the recordings. This difference varied substantially within almost all subjects (SD range from 2.8 to 16.1%, figure 2(a)). Similarly, the Diff-LCI(wo−wi) was often higher than 20% (figure 2(b)). (ii). The CV of FRC per child exceeded 10% for several subjects in both centres (figure 2(c)).
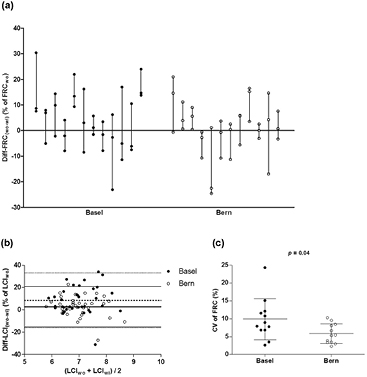
Figure 2. Intra-subject, intra-centre and inter-centre differences in MBW outcomes using the standard analysis. (a) Diff-FRC(wo−wi)(% of FRCwo) from Basel (closed circles, n = 36) and Bern (open circles, n = 36) measurements. Subjects are ordered by measurement date on x axis. (b) Modified Bland–Altman for Diff-LCI(wo−wi)(% of LCIwo) from Basel (closed circles, n = 35, one with LCI = 0 in washout excluded) and Bern (open circles, n = 36) measurements. Dotted lines (Basel) and solid lines (Bern) indicate mean ± 1.96 SD limits. (c) CV of FRC (%) in Basel and Bern (N = 12 infants per centre). Horizontal lines indicate mean and SD values; p value refers to t-test for the inter-centre comparison.
Download figure:
Standard image High-resolution imageFurther, we detected inter-centre differences based on the following results: (i). FRC values were significantly higher in Basel, compared to Bern, whether expressed as absolute values (table S1 (stacks.iop.org/PM/37/L1/mmedia), t-test, p = 0.0097), or adjusted for body weight (FRC/body weight in table S1 (stacks.iop.org/PM/37/L1/mmedia), t-test, p < 0.0001) and length (FRC/length in table S1 (stacks.iop.org/PM/37/L1/mmedia), t-test, p = 0.0019). (ii). The CV for FRC in Basel was almost twice as high as in Bern (mean ± SD (%): 9.8 ± 5.6 and 5.8 ± 2.9, respectively, figure 2(c)).
This non-physiological variation within subjects, between subjects of each centre and between centres raises questions about the robustness of the analysis method, based on our own defined quality control, and suggests that several factors of the analysis algorithms influence the results in a non-systematic way. These factors were further challenged in the following parts.
3.2. Alternative analysis settings
3.2.1. Analysis by changing the 'FRC-analysis' parameters.
Each individual change in 'FRC-analysis' parameters resulted in significant changes in FRC and LCI leading to unrealistically high or low values, as shown in detail in the supplementary data and in table S2 (stacks.iop.org/PM/37/L1/mmedia).
3.2.2. 'Room-' and 'case-temperature' refinement.
After the appropriate corrections we still observed several MBW recordings with atypical MM signals (figure 3(a)), and suspected incorrect temperature settings as the underlying reason. Mean 'room-temperature' recorded in the software was 27.0 °C, significantly higher compared to the temperature obtained during calibration for each measurement (mean 24.8 °C, figure 3(c), n = 36 measurements per centre, t-test, p < 0.0001). This difference was more profound in Basel than in Bern (t-test, p < 0.0001). In addition, 'room-temperature' in the software settings was usually equal or higher than the 'case-temperature' (figure 3(d)), which can be attributed to the non-realistic heating of the equipment.
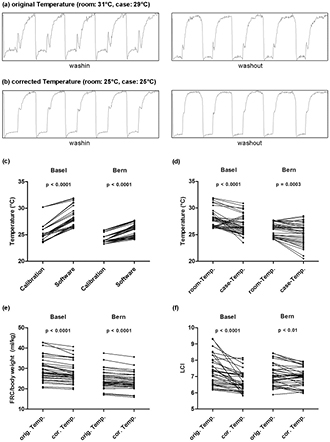
Figure 3. (a-b) Molar mass (MM) signal improves after temperature refinement. MM signal in the last five breaths of the washin and the washout phase respectively in original 'room-' and 'case-temperature' (a) and after temperature refinement (b). (c) 'Room-temperature' (°C) differed between calibration files and software recordings in Basel and Bern (t-test, n = 36 measurements per centre). (d) 'Room-temperature' was often found higher than 'case-temperature' as recorded in the software. 'Room-temperature' and 'case-temperature' (°C) in software recordings in Basel and Bern (t-test, n = 36 measurements per centre). (e-f) Effects of corrected 'room-' and 'case-temperature' on FRC and LCI values. Comparison of (e) FRC/body weight in ml kg−1 and (f) LCI values analysed with original temperature (orig. Temp.) and corrected temperature (cor. Temp.) in Basel (t-test, n = 35, one with LCI = 0 excluded) and Bern (t-test, n = 36) measurements.
Download figure:
Standard image High-resolution imageTo correct this, we substituted 'room-' and 'case-temperature' in the software with the rounded mean value from the calibration files (25 °C), as was also done by others (Vukcevic et al 2015). This temperature refinement normalized the MM curve (figure 3(b)). It resulted further in a rather systematic decrease in FRC/body weight (figure 3(e)), and a more heterogeneous change in LCI values (figure 3(f), t-test, p < 0.0001 explained in detail in the supplementary data).
3.2.3. Analysis with alternative MM step response corrections.
We observed in several measurements that the MM signal after the step response correction was either inadequately corrected (figure 4(a)), or overcorrected (figure 4(b)). These measurements were not proceeded for further analysis and for this reason were not included in this study. In order to explore the impact of an inaccurate step response correction on the MBW outcomes, we analyzed the measurements from our study using different MMDifuTau and SPLCham values in the temperature model (see figure S2(a)) (stacks.iop.org/PM/37/L1/mmedia). This changed significantly FRC and LCI values (more detail in the supplementary data and table S3) (stacks.iop.org/PM/37/L1/mmedia).
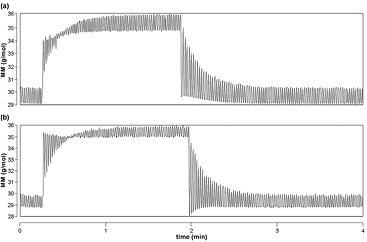
Figure 4. Effect of inappropriate step response correction on molar mass (MM) signal, seen mainly in the beginning of the washout. Original MM tracing curves of MBW measurements from healthy infants with (a) inadequate step response correction and (b) step response overcorrection.
Download figure:
Standard image High-resolution image3.2.4. Analysis using different software versions
3.2.4.1. Analysis with a different software version of the same software package.
The analysis with the more recent WBreath software version (3.39.4) resulted in significant changes in FRC and LCI values compared with the older version (3.28.0.0), but the variability remained high (more detail in the supplementary data, table S4 and figure S4) (stacks.iop.org/PM/37/L1/mmedia).
3.2.4.2. Analysis with a new software package.
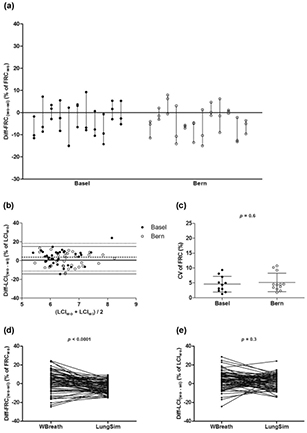
The new analysis software resulted in an impressive decrease in Diff-FRC(wo−wi) in single measurements (figures 5(a), (d), table S5 (stacks.iop.org/PM/37/L1/mmedia), t-test, p < 0.0001), as well as in the variability of these values within the subjects (SD range from 0.7 to 11.8%, figure 5(a)). The same trend can be assumed for Diff-LCI(wo−wi) (figures 5(b), (e), table S5) (stacks.iop.org/PM/37/L1/mmedia), however we cannot draw any conclusions due to the big heterogeneity in these data. In addition, the intra-subject variability in FRC (CV of FRC) was much lower, with highest value of 10.6% (figure 5(c), table S5) (stacks.iop.org/PM/37/L1/mmedia), compared to 24% with WBreath software (figure 2(c), t-test, p = 0.03). Also, the inter-centre difference for CV of FRC disappeared (figure 5(c), table S5 (stacks.iop.org/PM/37/L1/mmedia), t-test, p = 0.6) (see also the supplementary data and figures S5, S6) (stacks.iop.org/PM/37/L1/mmedia).
Figure 5. Intra-subject, intra-centre and inter-centre differences in MBW outcomes using the custom-made analysis software, LungSim. (a) Diff-FRC(wo−wi)(% of FRCwo) from Basel (closed circles, n = 35, one with LCI = 0 excluded) and Bern (open circles, n = 36) measurements. Subjects are ordered by measurement date on the x-axis. (b) Modified Bland–Altman plot for Diff-LCI(wo−wi)(% of LCIwo) from Basel (closed circles, n = 35, one with LCI = 0 excluded) and Bern (open circles, n = 36) measurements. Dotted lines (Basel) and solid lines (Bern) indicate mean ± 1.96 SD limits. (c) CV of FRC (%) in Basel (t-test, N = 11, one with LCI = 0 excluded) and Bern (N = 12) infants. Horizontal lines indicate mean and SD values. (d–e) Comparison between WBreath (version 3.28.0.0) and LungSim of (d) Diff-FRC(wo−wi)(% of FRCwo) and (e) Diff-LCI(wo−wi)(% of LCIwo) (t-test, n = 71 measurements, one with LCI = 0 excluded).
Download figure:
Standard image High-resolution image
4. Discussion
4.1. Summary
This study illustrates the difficulties of SF6-MBW measurements in infants with the only commercially available equipment. More specifically, it reveals several weaknesses of the current software used for the analysis of the measurements. Moreover, it shows the impact of different environmental and software-related parameters on MBW outcomes and provides recommendations that improve the quality of the analysis.
4.2. Interpretation
We found unrealistic high intra-subject and inter-subject variability using original settings, which differed further between centers. The differences in FRC and LCI values between washin and washout of −25% to +30% during quiet sleep without waking up cannot be explained physiologically. In addition, we found differences in FRC values between the two centres that are in accordance with the findings from Hulskamp et al (2009). These observations cast doubt on the quality of the current analysis method and raise questions about the strength of the obtained results. With results as variable as those, it is questionable whether clinical studies using MBW outcomes can be performed, especially in multicentre settings.
Previous single-centre studies have reported a much narrower range in intrasubject variability of FRC values (Fuchs et al 2011, Gray et al 2015a, 2015b,) from infants measured at a similar age with the same device. We attribute this difference to the new analysis approach we used, using the EIMM-step recently shown to be more sensitive in detecting the completion of the measurements, thus providing more accurate results (Anagnostopoulou et al 2015).
4.3. Technical issues
A more systematic analysis approach revealed several factors that substantially influence results. Although certain 'FRC-analysis' settings are recommended by the manufacturer, our study shows for the first time the direct impact of these settings on MBW outcomes and underlines the necessity to stick to these recommendations.
Looking more into the details of these settings, we found that minimal changes in physical constants of the currently used temperature model (Latzin et al 2007), such as MMDifuTau and SPLCham, influence MBW outcomes significantly. Thus, the corrected MM signal should be critically evaluated before proceeding to the analysis, and possible atypical signals should be questioned and/or reported. Any change in the settings should be taken seriously into consideration. If needed, the temperature model should be then modified appropriately, under the manufacturer's guidance. Researchers should take special care when analyzing measurements from other centres, and a detailed description of the settings should always accompany the recordings. This is even more important as the temperature model in the particular device is validated only for early infancy (body weight up to 12 kg) (Latzin et al 2007, Thamrin et al 2015), and it is formally not recommended for older subjects, as the set-up and the settings are slightly different. Further studies are required to implement a temperature model appropriate for older age groups.
According to our findings, invalid 'room-' and 'case-temperature' recordings in the software cause substantial non-systematic changes on the results. We show that 'room-temperature' is affected by temperature changes within the device, which is inevitably heated during the measurement (Latzin et al 2007). Temperature sensors are also prone to external temperature conditions, e.g. if the device is located close to a heating system, or in a room with high temperature changes. Therefore, users should be cautious about the temperature recorded in the software. We recommend documenting the 'room-temperature' value during the calibration of the device by all means, and to use this value for both 'room-' and 'case-temperature' (Vukcevic et al 2015) instead of the unrealistic temperature recordings in the software for the measurement analysis.
4.4. Clinical relevance
Our study reveals a discrepancy in FRC and LCI values obtained with two different versions of WBreath software. We attribute these differences mainly to the different ways of calculating EIMM and EEMM signals. However, as the exact algorithms used by the software are unknown, we cannot estimate other factors that could play a role. Thus, we conclude that it is not possible to compare results analyzed with different software versions, as reported before in abstract form (Ebdon et al 2013). This raises specific concerns about the handling of data from different centres that use different software versions (Hulskamp et al 2009, Fuchs et al 2011, Hall et al 2011, Kieninger et al 2011, Belessis et al 2012, Stahl et al 2014, Gray et al 2015b). With the manufacturers' support, we should identify changed parameters in different software versions that could influence the results. In addition, it would be extremely useful if each centre could create its own reference data-set by performing MBW tests in healthy infants as previously recommended (Hulskamp et al 2009, Lum et al 2010, Stocks et al 2010, Peterson-Carmichael et al 2014, Gray et al 2015a). A combination of normal values from different centres would diminish the risk of systematic bias (Stanojevic et al 2008). At present, this is especially important as with the use of the EIMM-step (Anagnostopoulou et al 2015), previously published reference values may no longer be entirely valid (Fuchs et al 2011).
It is important to mention that these observations account only for the above-mentioned device and analysis software. The reported recommendations do not apply to other devices used for MBW measurements, such as the mass spectrometers (Hoo et al 2012, Gustafsson et al 2003, Subbarao et al 2013) and the Innocor photoacoustic analyzer (Horsley et al 2008, Gonem et al 2014), as these are independent of the MM signal. However, environmental settings and their influence on lung function measurements is a well-known issue (Frey et al 2000) that should always be taken into account.
4.5. Future advances in infant MBW
A new custom-made software, even after the signal corrections were applied in WBreath software, resulted in more robust FRC results, lower intra-subject variability and a lower difference in FRC values between washin and washout, compared to both WBreath software versions. In this proof-of-principle approach, we did not consider the new software package as a new standard analysis software. By applying this new software, our aim was only to show that a few improvements in the software algorithms can substantially increase the robustness of the results. Thus, it seems easily possible for the manufacturer to improve the sensitivity of temperature recordings in the software, to provide more accurate correction steps as well as to implement the analysis algorithms in order to ensure the validity of the obtained MBW outcomes. Nevertheless, the use of new algorithms points towards alternative analysis approaches for future applications.
In order to include infant MBW measurements in multicentre studies, we have to ensure the reliability and the comparability of the results. Experts in the field should work in close cooperation with the manufacturers to diminish technical and methodological difficulties (Thamrin et al 2015). Moreover, as the most recent MBW guidelines (Robinson et al 2013) (Beydon et al 2007) are not applicable for infant measurements, due to test specificities in the early age (Stocks and Lum 2012), it is necessary to implement a universal standard operating procedure for infant MBW testing to address all the above issues (Peterson-Carmichael et al 2014, Subbarao et al 2015).
4.6. Strengths and limitations of the study
The present study has several strengths. It is a software validation study based on real high quality measurements selected from a large cohort of subjects at the same age. Including only healthy infants, any controversial results cannot be attributed to lung pathology, but to environmental factors and/or factors related to the software or the hardware of the device. As mentioned above, the device and the protocol used were identical in the two centres. Moreover, well-trained and experienced staff performed the measurements, and most of them were supervised by the same person in both centres. Although we acknowledge the low number of subjects in this study as a limitation, this is due to strict selection criteria based on the good quality of the tracings and the prerequisite that all three tests were performed in one sleeping period, in order to ensure to a great extent the stability of environmental conditions.
5. Conclusion
In conclusion, non-systematic inter-centre differences in MBW outcomes in infants can be greatly reduced by including correctly recorded environmental conditions in the software analysis algorithms as well as by minimal alterations in these algorithms. We provide several simple recommendations for the user in this direction, such as to stick to the recommended 'FRC-analysis' settings, to examine the recorded temperature in the software and correct it, if needed, and to evaluate the validity of the temperature model based on the degree of normalization of the MM curve. We also present specific software characteristics that can be implemented by the manufacturer. The increasing need to include ILF tests in multicentre longitudinal clinical studies for patients with CF (Matecki et al 2015) leads to the necessity of obtaining better quality measurements, and both clinical scientists and manufacturing companies should focus on that. Only by improving the reliability of ILF, will we manage to use ILF tests to identify and monitor lung disease from infancy onwards.
Acknowledgments
The authors appreciate the contribution of M Graf, L Beul, L Hornwall (Division of Respiratory Medicine, Department of Pediatrics, Inselspital and University of Bern, Bern, Switzerland) and M Weber (University Children's Hospital Basel, UKBB, Basel) to data collection, and Dr S Nyilas to useful comments on the manuscript.
Funding
This work was funded by the Fondation Botnar, the Swiss National Foundation (grant 324730_144280/1), and the Swiss Cystic Fibrosis Society (CHCF). The funders had no role in the study design, data collection and analysis, decision to publish, or preparation of the manuscript.
Conflict of interest
The authors declare no conflict of interest.