
Abstract
We propose a new biomedical sensing technique based on highly nonlinear solitary waves to assess orthopaedic implant stability in a nondestructive and efficient manner. We assemble a granular crystal actuator consisting of a one-dimensional tightly packed array of spherical particles, to generate acoustic solitary waves. Via direct contact with the specimen, we inject acoustic solitary waves into a biomedical prosthesis, and we nondestructively evaluate the mechanical integrity of the bone–prosthesis interface, studying the properties of the waves reflected from the contact zone between the granular crystal and the implant. The granular crystal contains a piezoelectric sensor to measure the travelling solitary waves, which allows it to function also as a sensor. We perform a feasibility study using total hip arthroplasty (THA) samples made of metallic stems implanted in artificial composite femurs using polymethylmethacrylate for fixation. We first evaluate the sensitivity of the proposed granular crystal sensor to various levels of prosthesis insertion into the composite femur. Then, we impose a sequence of harsh mechanical loading on the THA samples to degrade the mechanical integrity at the stem–cement interfaces, using a femoral load simulator that simulates aggressive, accelerated physiological loading. We investigate the implant stability via the granular crystal sensor–actuator during testing. Preliminary results suggest that the reflected waves respond sensitively to the degree of implant fixation. In particular, the granular crystal sensor–actuator successfully detects implant loosening at the stem–cement interface following violent cyclic loading. This study suggests that the granular crystal sensor and actuator has the potential to detect metal–cement defects in a nondestructive manner for orthopaedic applications.
Export citation and abstract BibTeX RIS
1. Introduction
Joint replacement surgeries are becoming widespread due to the ageing of the population and the advancement of medical technology [1, 2]. Among different types of joint replacement surgeries, including shoulder, wrist, knee, and ankle replacements, total hip arthroplasty (THA) is one of the most common, with over 500 000 operations performed annually worldwide [3]. The THA operation involves the implantation of an artificial metal stem into the femoral canal, and the resurfacing of the acetabular (pelvis) side with a metallic, ceramic, or polyethylene cup. The fixation of the stem within the femoral canal typically relies on one of three methods of fixation: porous ingrowth, press-fit, or cemented fixation. Porous ingrowth fixation involves highly textured implant surfaces, designed to enhance osseointegration, or bone ingrowth. Press-fit fixation utilizes a dual-tapered stem geometry and routine axial loading, applied with every step the patient takes, to wedge the stem into a stable position. For cemented fixation, polymethylmethacrylate (PMMA, i.e., bone cement) is injected into the hollow femoral canal and, prior to curing, the metal stem is inserted. The cement acts more as a grouting agent than a glue, as it is intended to fill the canal and not necessarily to chemically bond the stem. All three methods of fixation are commonly used, and the success of all three may be compromised if premature loosening occurs [4].
In this study, we introduce and evaluate a novel method for the nondestructive evaluation of representative orthopaedic implant interfaces in THA using highly nonlinear solitary waves (HNSWs). HNSWs are compactly supported lumps of energy, which are formed by a balance between nonlinear and dispersive effects in intrinsically nonlinear media, such as granular materials [5]. They are characterized by unique physical properties, such as high acoustic energy and remarkable robustness, which make them extremely useful as information carriers in nondestructive evaluation (NDE) applications [6, 7]. To generate and propagate HNSWs, we assemble a granular crystal to function as a combined sensor and actuator, which is composed of a chain of spherical particles in contact with each other with a piezoelectric gauge embedded in selected locations [8]. Using the granular crystal, we excite the surface of an orthopaedic implant with a single HNSW, and we record the signals reflected from the interface between the granular crystal and the implant specimen under inspection. Previous studies have shown that the reflection patterns of HNSWs are significantly affected by the mechanical properties, geometry, and boundary conditions of an adjacent medium—which in this study is a femoral stem from a THA [9, 10]. Thus, we investigate the characteristics of HNSWs reflected from the sensor/implant interface to assess implant stability.
The proposed sensing scheme can provide unique advantages over conventional biomedical techniques. For example, the proposed device can inspect the mechanical integrity of a biomedical implant in a nondestructive and efficient manner, without invasive testing or permanent mounting of sensing devices, when the bone is already exposed due to surgery. Such direct and fast assessment of implant stability can be very useful in a clinical setting, compared to the conventional x-ray-based diagnostic method. In addition, HNSWs can achieve higher intensity than ultrasonic waves excited by conventional piezo-actuators, because they rely on mechanical impacts for excitation rather than piezo-mechanic conversion efficiencies [6]. This leads to improved signal-to-noise ratios and reliability. Finally, the proposed instrument is compact and does not rely on external power amplifiers. This can significantly enhance the portability and accessibility of the instrument in the desired mode of operation.
We study the efficacy of the proposed sensor–actuator in detecting the mechanical integrity of bio-interfaces using three THA samples made of metallic stems implanted in artificial composite femurs using PMMA for fixation. In one of the samples, we pull out the metallic stem from the composite femur and evaluate the responsiveness of HNSWs to various degrees of stem fixation in the process of implant repositioning via pressure-fitting. The other two THA samples are kept pristine to exhibit the perfect bonding condition at the cemented interface. Then, we apply cyclic fatigue loading to all three THA samples using a biaxial load frame equipped with a custom-designed femoral load simulator [11]. To monitor in situ the structural degradation of the stem–cement interface, we evaluate the THA samples using a granular crystal sensor–actuator during testing. As a result, we find that HNSWs are sensitive to the level of stem fixation within the femoral canal. We also verify that the proposed sensing scheme successfully detects gross failure of the stem–cement interface. This preliminary study suggests that a granular crystal sensor–actuator might be used as a novel biomedical device to evaluate the integrity of typical orthopaedic implant interfaces.
2. Materials and methods
2.1. Specimen preparation
We prepare three THA specimens for biomechanical testing that combine cemented femoral stems and composite femurs (table 1). We use three different types of metallic femoral stems, all in clinical use. The synthetic composite femurs, commonly used for orthopaedic biomechanical testing, are designed to exhibit bone-like mechanical characteristics (Pacific Research Laboratories, Vashon Island, WA). They provide reproducible bone geometry as well as cortical and cancellous bone thickness, featuring an E-glass filled epoxy to mimic cortical bone and rigid polyurethane foam for cancellous regions. We use PMMA for fixing the implant in the canal of the composite femurs (Howmedica, Rutherford, NJ). In this study, the metallic stems are implanted by an experienced orthopaedic surgeon, using the instrumentation and techniques specified by the manufacturer (Zimmer Orthopedics, Austin, TX).
Table 1. Specifications of artificial femoral implant specimens.
| No | Stem material | Stem geometry | Cortical bone material | Cancellous bone material | Cement material |
|---|---|---|---|---|---|
| 1 | CoCrMo | Collared | E-glass filled epoxy | Rigid polyurethane foam | Polymethylmethacrylate |
| 2 | Stainless steel | Dual tapered | E-glass filled epoxy | Rigid polyurethane foam | Polymethylmethacrylate |
| 3 | CoCrMo | Non-collared | E-glass filled epoxy | Rigid polyurethane foam | Polymethylmethacrylate |
After the cemented stem fixation, the stem in sample 3 is pulled out of the cement mantle with a slap hammer. This is to simulate the complete loosening of the metallic stem. Then we implant the stem back into the composite femur using a hammer impact, monitoring the responses of HNSWs in various levels of stem fixation. Note that this pressure-fitting process is to create different statuses of cemented implant loosening for experimental purpose, and it should not be confused with the press-fit method for uncemented stem implantation. After the repositioning of the stem in sample 3, we apply an aggressive, accelerated physiological loading to all three samples using a femoral load simulator. During the fatigue loading, we investigate the implant stability using the granular crystal sensor–actuator. The following two sections will explain the diagnostic measurement process and the fatigue tests performed with a femoral load simulator.
2.2. Granular crystal sensor–actuator
We assemble a granular crystal to excite HNSWs and detect signals reflected from the femoral implant specimens. Figure 1(a) shows the overall experimental setup, composed of a one-dimensional granular crystal and a femoral implant specimen. In this study, the granular crystal consists of a chain of 20 stainless steel beads (type 440C with a 9.53 mm radius, McMaster-Carr), which are vertically aligned and supported by four stainless steel rods. We position the granular crystal on the flat surface of the exposed metallic stem (see the schematic diagram in figure 1(a)). In this setup, the distal portion of the implant specimen is firmly mounted using custom-designed clamps and fastening screws.

Figure 1. Experimental setup. (a) Granular crystal sensor–actuator positioned on top of a femoral implant specimen. The schematic diagram shows the setup and the data acquisition system. (b) Femoral load simulator to apply axial force and angular torque simultaneously, simulating aggressive, accelerated physiological loading.
Download figure:
Standard imageWe generate single HNSWs in the granular crystal by releasing a striker bead (identical to the bead composing the chain) from a 5 mm drop height using an electrical solenoid [10]. The HNSW formed in the chain is transmitted into the implant sample via direct contact, and the reflected waves from the interface between the granular crystal and the implant propagate back to the chain, conveying diagnostic information about the integrity of the stem–cement interface. We record both incident and reflected waves using an instrumented bead positioned in the seventh particle site from the top of the chain [5, 10]. The instrumented bead contains a piezoelectric element to convert compressive waves into voltage signals. The details of the sensor manufacturing and calibration are reported in [12]. We acquire the signals using a data acquisition board (National Instruments PCI-6115) connected to a computer. We convert the measured voltage signals back to force profiles of the propagating waves using a calibration factor determined by conservation of momentum in the calibration process [12]. For each test, we perform five measurements of HNSWs to ensure the repeatability of the diagnostic signals, and we analyse the data using MATLAB.
2.3. Femoral load simulator
To simulate physiological loading in an accelerated manner, we apply combined axial and torsional load to the femoral head (ball joint) using a custom-designed femoral load simulator [11, 13, 14]. The specimen is mounted in an inverted position, and the distal shaft of the composite femur is firmly attached via several adaptors and shaft braces to a biaxial servo-hydraulic actuator (figure 1(b)). The actuator applies axial force and angular torque simultaneously in the vertical direction in accordance with the input load profiles. The dynamic load profile used is based on in vivo measurements reported in the literature [15].
We repeat up to six sets of harsh mechanical loading intervals for each specimen, varying force and torque magnitudes to accelerate the mechanical degradation of the implant–cement interface (table 2). Between loading intervals, we perform diagnostic evaluation of the implant stability using a granular crystal sensor–actuator. We focus on observing the responsiveness of HNSWs to the occurrence of structural failures of implants, such as peri-prosthetic fractures and implant loosening. In each set, the loading intensity is increased cyclically over the span of the testing. The maximum axial load applied is 3000 N, while the maximum angular torque is 25 N m. This is considered to be an aggressive representation of the physiological loading conditions, as most simulators apply loads more typical of light weight patients, or slow walking, with peak loads no higher than 2000 N. Applied loading and displacement profiles are monitored by the load cells mounted to the femoral load simulator throughout testing at a sampling frequency of 20 Hz.
Table 2. Experimental specifications of loading profiles for the servo-hydraulic femoral load simulator.
| Axial loading (N) | Angular loading (0 to peak) (N m) | ||||||
|---|---|---|---|---|---|---|---|
| Set no. | Duration (s) | Start | Increment | Final | Start | Increment | Final |
| 1 | 497 | 300 | 50 | 1000 | 1.0 | 1.0 | 5.0 |
| 2 | 497 | 300 | 50 | 1000 | 1.0 | 1.0 | 15.0 |
| 3 | 1100 | 300 | 100 | 3000 | 1.0 | 1.0 | 25.0 |
| 4 | 1100 | 300 | 100 | 3000 | 1.0 | 1.0 | 25.0 |
| 5 | 954 | 300 | 0 | 300 | 1.0 | 1.0 | 23.0 |
| 6 | 953 | 300 | 0 | 300 | 1.0 | 1.0 | 23.0 |
3. Results and discussion
3.1. HNSW-based diagnostics during implant fixation
We first describe the response of the system in various conditions of stem fixation. We quantify the stem fixation levels by measuring the subsidence δ, the slip of the implant into the femoral canal, during the pressure-fitting process of sample 3. Figure 2 shows the force profiles measured by the instrumented bead in the granular chain for five different levels of stem fixation (δ = 0, 0.54, 1.11, 1.57, 2.05 mm). The bottom signal represents the loosened status of the implant, where the metal implant is fitted in the femoral canal by hand. We define the stem displacement δ to be zero in this state. The top signal denotes the firmly fixed status, where the implant is inserted 2.05 mm into the composite bone until it does not slide further into the canal by repeated hammer impact.
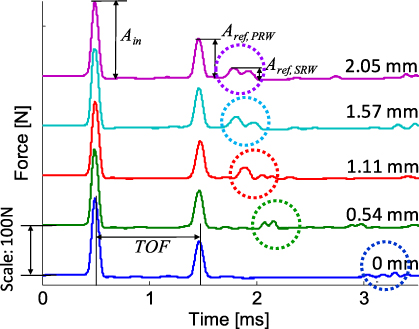
Figure 2. HNSW profiles in five different levels of stem fixation (δ = 0, 0.54, 1.11, 1.57, 2.05 mm). The first (t = ∼0.5 ms) and second (t = ∼1.5 ms) impulses represent the incident and the primary reflected solitary waves (PRW), respectively. Dotted circles denote the secondary reflected waves (SRW), whose propagation speeds are dependent on the stem fixation level. Time of flight (TOF) is obtained by measuring the time elapsed between the incident and the reflected solitary waves. The magnitudes of the incident and reflected solitary waves are Ain and Aref, respectively.
Download figure:
Standard imageWe excite identical solitary waves in the granular crystal, as evident from the first impulses detected by the sensor particle at time t = 0.25 ms in Figure 2, demonstrating that the granular crystal can generate very reproducible signals. The subsequent impulses in the figure denote the waves reflected from the sensor/implant interface. We refer to the first reflected solitary waves arriving at the sensor around t = 1.5 ms as the 'primary reflected waves' (PRWs), whereas we call the following solitary waves 'secondary reflected waves' (SRWs) (see waves encircled by the dotted line in figure 2). We find that the PRWs are almost identical for all tests, regardless of the stem fixation levels. However, the SRWs respond sensitively to the states of stem fixation, showing distinctive times of arrival in the instrumented particle. We calculate the time of flight (TOF) of HNSWs by measuring the transit time between the incident and reflected waves. For example, the TOF of the primary solitary wave for δ = 0 is depicted in figure 2. The strength of the reflected HNSW is quantified by the amplitude ratios of the reflected waves to the incident waves (Aref/Ain).
We extract the TOF and amplitude ratios of PRW and SRW from the raw force profiles, and the results are reported in figure 3 as a function of δ. The error bars represent the standard deviations of five repeated measurements per test. As the displacement of the stem increases (i.e., the stem fixation level is enhanced), the TOFs of the secondary reflected waves are drastically reduced, while those of the PRW remain almost constant. We observe that the decrease of the SRW's time of flight is as high as 53.1%, from 2.77 to 1.30 ms, comparing the loosened and the firmly fixed states. The reflection ratios of the PRW and SRW show noticeable increment over the insertion of the implant. These experimental results demonstrate that the SRWs respond sensitively to different levels of stem fixation, particularly showing considerable variations of time of flight.

Figure 3. Properties of the waves reflected from the interface between the granular crystal and the implant, as a function of the stem subsidence δ. (a) Time of flight of PRW and SRW. (b) Reflection ratios of PRW and SRW. All the data are based on five measurements of signals, and the error bars represent their standard deviations.
Download figure:
Standard imageThe reflected impulses observed in this study are formed by the mechanical interaction of the granular crystal and the metal implant at the contact point. Previous studies have shown that the primary reflected waves are the outcome of immediate rebound motion of the last particle in the chain against the contact medium—which in this study is a metallic stem from a THA [10]. Thus, the formation of the PRW is strongly governed by the inertia effect (i.e., mass) of the bounding medium. More specifically, the heavier the contact medium is, the stronger the primary solitary wave reflection is. Given the relatively large mass of the metal implant compared to that of spheres in the chain (implant mass, 137.0 g; bead mass, 3.5 g), we obtain the PRWs with large amplitudes and fast propagating speed. Considering identical mass of the metal implant throughout testing, we find that the TOF and amplitude ratio for the PRWs are approximately constant, irrespective of the stem fixation levels.
The secondary reflected waves are formed by the opening and closing of gaps between the granular particles and the implant, after the initial repulsion of the particles. This mechanism is strongly influenced by the structural stiffness of the base (i.e., the fixation level of the stem in this study) according to the particle dynamics and the contact mechanics [10]. As a result, we obtain a smaller SRW for a softer base, and a larger SRW for a harder base. In this study, this translates into the different responses of SRWs in various fixation levels. As shown in figure 2, we obtain a weak formation of SRW with a slow propagation speed (i.e., large TOF) in a loosened implant (bottom blue line), while a strong SRW with a fast speed (i.e., small TOF) is generated for the well fixed implant (top purple line). This is in agreement with the findings in previous studies, implying that the SRW can be used as an information carrier to assess the stem fixation level in the course of positioning the implant into the femoral canal [9, 10].
3.2. Mechanical loading by femoral load simulator
In this section, we present the experimental data acquired from the femoral load simulator. Figure 4 shows the axial and angular loading profiles applied to sample 1 during the cycle of loading 3 (see the table 2 for the specifications of loading 3). As shown in the insets of figures 4(a) and (c), the force and torque profiles exhibit a sinusoidal waveform with a 1 s period. The maximum compressive force in the axial loading direction is cyclically increased from 300 to 3000 N during a 1100 s testing period (figure 4(a)). The axial displacement profile also shows an increase of the displacement in the axial direction up to approximately 2 mm in the peak loading condition (figure 4(b)). When the axial loading returns to zero at the end of the test, we observe that the displacement of the implant is recovered to its initial position without noticeable residual displacement (see the averaged displacement curve, denoted by the bold red line in figure 4(b)). The torsional loading is simultaneously applied to the composite femur samples with a peak amplitude of 25 N m (i.e. 50 N m torque in a peak-to-peak range) (figure 4(c)). The angular displacement follows the cyclically increasing trend of the torque profile as shown in figure 4(d). At the maximum torque, the peak-to-peak angular displacement is as high as 2.5°.

Figure 4. Temporal profiles of mechanical loading (loading 3) generated by the femoral load simulator and the corresponding behaviour of a THA specimen (sample 1) measured from the load cells on the actuator. (a) Axial force profile. The blue line denotes a force history of axial compression, while the red line is its average profile. The inset shows a magnified view of the sinusoidal force profile. (b) Axial displacement in the direction of compression. (c) Angular torque profile with a sinusoidal waveform (inset). (d) Rotational displacement.
Download figure:
Standard imageBased on the temporal measurement data, we plot the force–displacement and the torque–rotation curves (figure 5) to compare the dynamic responses between the three implant samples under loading 3. Note that each data point in figure 5(a) denotes the mean values of displacement and force per cycle. We approximate the mean displacement during a 1 s period by calculating  , where
  and
and  represent the maximum and minimum displacements of the implant within the nth cycle. Likewise, we obtain the mean compressive force by
  , where
  and
and  are the force amplitudes at the positive and negative peaks. As a result, we find that the implant samples exhibit approximately linear force–displacement patterns throughout loading 3, except the irregularities observed at the end of the loading for sample 3. We shall explain this spike in the later part of this section. Comparing the responses of the three samples, we observe that sample 3 presents a higher slope in the force–displacement curve than samples 1 and 2. This implies a higher compliance (i.e. a lower stiffness) of the stem fixation for the press-fit sample 3, compared to the two other cemented implant samples.

Figure 5. Axial and angular responses of three THA samples as a function of applied loading (loading 3). (a) Axial force–displacement profiles. Sample 3 exhibits a sudden increase of axial displacement under large axial forces (>1500 N) as marked by the dotted red circle. (b) Angular torque–rotation profiles. Similarly, sample 3 undergoes abrupt changes in rotation given the large amount of applied torque.
Download figure:
Standard imageUnlike the axial loading profiles, angular rotation and torque profiles exhibit symmetric trends with respect to the undisturbed, neutral position (see figures 4(c) and (d)). Therefore, averaging measured rotation and torque within a cycle will result in trivial values. Instead, we calculate the dynamic ranges of torque and rotation and plot them in figure 5(b), where the horizontal and vertical axes represent the peak-to-peak dynamic torque ( ) and rotation (
 ) during the nth cycle. Here,
  and
and  are the peak torque values in the clockwise and anticlockwise directions, and
  and
and  are the corresponding peak angular rotations in the nth cycle of the fatigue loading. As a result, we observe a larger rotation in sample 3 compared to samples 1 and 2, given the same amount of applied torque. It is notable that the rotation of the implant with respect to the fixed composite femur is as high as ∼6° for sample 3 under the high range of torques (T > 40 N m). Such high angular displacements are probably due to the weakened mechanical integrity at the stem–cement interface, caused by the repositioning of the stem after complete pull-out.
In this study, we define the axial and angular compliances of the stem fixation for every cycle to keep track of the gradual degradation of the cement integrity under the cyclic loading. The axial compliance  at the nth cycle is expressed as
which represents the averaged displacement per cycle given the mean axial force applied by the femoral load simulator. We can also define an angular compliance  based on the peak-to-peak amplitudes of the torque and rotation:
Note that the numerator and denominator in equations (1) and (2) are the vertical and horizontal axis values in figure 5, respectively. Hence, the compliance denotes the ratio of these two measurement values in each data point, quantifying the level of structural degradation in the cementitious interface between the stem and bone under axial and torsional loading.
The profiles of axial and angular compliances are illustrated in figures 6(a) and (b), respectively, for the three THA samples. We focus on the span of the accumulated loading cycles between 1250 and 2750, which corresponds to loadings 3 and 4 (table 2). According to the calculated compliance profiles, it is evident that both axial and angular compliances of sample 3 are significantly higher than those of samples 1 and 2. We also observe that both axial and angular compliances of samples 1 and 2 do not vary significantly, without developing significant degradation of implant stability even after all the repeated sets of harsh fatigue loading. The discontinuities observed in the curves for samples 1 and 2 are due to the repositioning of the mounted specimens in the femoral load simulator in every loading set. The high durability of composite femurs in samples 1 and 2 is noteworthy. In fact, both synthetic bone and human femurs are susceptible to the degradation of the stem–cement interfacial integrity under repeated hard loading; however, in contrast to live human bones, composite bones cannot remodel or, rather, resorb bone that is unnecessary due to stress shielding provided by the metal stem [16].

Figure 6. Axial and angular compliance profiles over the accumulated loading cycles. (a) Axial compliance history as a function of cycle number. Sample 3 shows a sharp increase of axial compliance around the 2000-cycle point (dotted red circle) caused by the cement fracture, while samples 1 and 2 present relatively consistent axial compliance values. (b) Angular compliance. Compared to samples 1 and 2, sample 3 exhibits an unstable profile of angular compliance, and it ultimately develops a sudden decrease of angular compliances at the end of the cycles (dotted red circle).
Download figure:
Standard imageUnlike the strong fixation observed in samples 1 and 2, sample 3 shows a sudden change in its axial and angular compliances during the accelerated fatigue testing, as circled in figures 6(a) and (b). We find that the axial compliance value increases by 127%, from 2.12 × 10⁻⁶ to 4.81 × 10⁻⁶ m N−1, around the 2000-cycle point (corresponding to loading 3). We also observe that the angular compliance value drops from 2.27 × 10⁻³ to 1.60 × 10⁻³ N−1 m−1. This abrupt change of axial and angular compliances in sample 3 is well observed in figures 5(a) and (b), which describe the force–displacement and torque–rotation relationships under loading 3. In particular, we find that the stem of sample 3 slips instantly into the femoral canal, with its axial displacement jumping from 2.87 to 6.76 mm, as measured by the load cell (see the dotted red circle in figure 5(a)). After loading 3, we perform visual inspection of the specimens and find that this abrupt change of displacements and, consequently, compliance values is caused by the cement fracture in sample 3. As shown in figure 7, we observe multiple cracks in the PMMA layer between the stem and the composite femur, all positioned around the corner of the metallic stem.
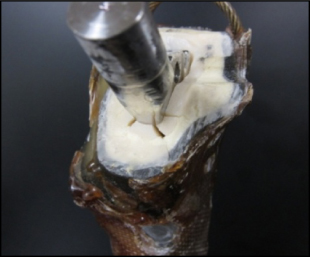
Figure 7. Photo of sample 3 showing the development of a cement fracture during loading 3. Multiple cracks are observed around the corners of the metallic stem.
Download figure:
Standard imageThe development of cracks around the corner of the prosthesis is very common in clinical situations due to many factors, including hoop stresses and fatigue failure of the cement. This can ultimately lead to the loosening of the implant, often necessitating revision surgery [17]. In section 3.3, we analyse the diagnostic signals from the granular crystal sensor–actuator to verify the sensitivity of the proposed sensing scheme to the cement fracture observed in sample 3.
3.3. HNSW-based diagnostics during loading
After each interval of cyclic loading, we nondestructively assess the implant stability of the specimens using the granular crystal apparatus. The results for the three specimens are reported in figure 8(a) for sample 1, in figure 8(b) for sample 2, and in figure 8(c) for sample 3. In figures 8(a) and (b), we observe that the temporal profiles of the reflected waves remained almost constant for all signals acquired from the baseline data (bottom blue line), after loading 2 (middle green line), loading 4 (middle red line), and loading 6 (top cyan line). Here the baseline data represent the HNSW signals obtained before a series of fatigue loading. The consistency of the measured force profiles implies that samples 1 and 2 exhibit no significant degradation of their mechanical integrity after the repeated sets of fatigue testing. In contrast, we find that the diagnostic results of sample 3 show noticeable changes between the signals acquired after different stages of loading (figure 8(c)). In particular, we find that the arrival of the SRW is significantly delayed after loading 3, in comparison to the signals from the baseline data and loading 2 (compare the positions of the dotted circles in figure 8(c)). Note that the diagnostic HNSWs of sample 3 have not been taken after loading 3 due to the cement fracture as mentioned in section 3.2.
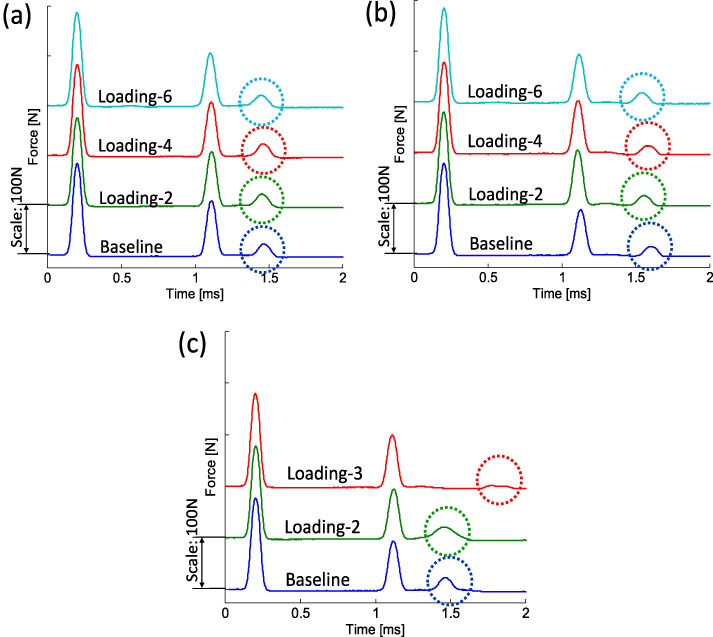
Figure 8. Wave profiles acquired in the interim of fatigue load testing. The signals are measured from the instrumented sensor in the granular chain and are shifted vertically to ease visualization. (a) Wave profiles from sample 1 from baseline data and after loadings 2, 4, and 6. (b) Wave profiles from sample 2. (c) Wave profiles from sample 3 acquired from baseline data and loadings 2 and 3. The secondary reflected waves are marked with dotted circles. HNSWs of sample 3 are limited up to loading 3 due to an early cement failure.
Download figure:
Standard imageFigures 9(a) and (b) show the responses of the diagnostic tests in terms of TOF and amplitude ratio, respectively, at different stages of the fatigue loading. We find that the TOF and amplitude ratio remain almost identical for the primary reflected waves at all loading cycles. However, the secondary reflected waves for sample 3 show an increase of TOF after loading 3 (see the dotted red circle in figure 9(a)). We also observe a reduction of the SRW amplitude to almost zero around the 2000 accumulated cycles (see the dotted red circle in figure 9(b)). The offset between the secondary solitary waves' TOF values in samples 1 and 2 is probably due to the difference of initial stem stability after the cement curing.
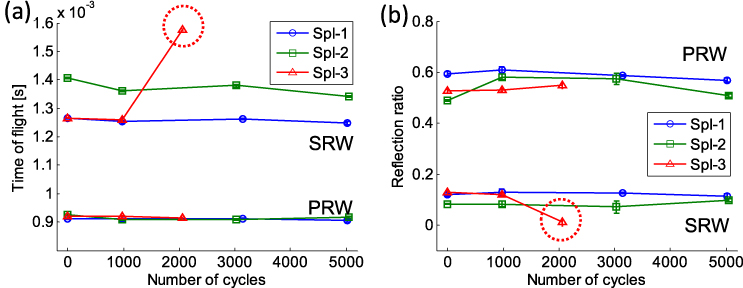
Figure 9. Extracted features from the measured impulses as a function of cycle number. (a) Time of flight for the primary and secondary reflected waves. (b) Reflection ratios of PRW and SRW. Error bars denote the standard deviation of the extracted features based on five measurements of diagnostic signals.
Download figure:
Standard imageThe dramatic change of wave propagation observed in sample 3 after ∼2000 accumulated cycles of fatigue testing (i.e. during loading 3) is related to the development of a critical fracture at the stem–cement interface (see section 3.2). The diagnostic results are in agreement with the experimental results from the femoral load simulator and visual inspection. This means that our proposed diagnostic method successfully detects the degradation of implant stability. The attenuation and delay patterns of SRWs observed in the accelerated fatigue testing are consistent with the preliminary testing results obtained in various levels of stem fixation during the pressure-fitting process (section 3.1).
4. Conclusions
This study describes the use of granular crystals as actuators and sensors to excite highly nonlinear solitary waves in femoral implants and to investigate their stability under the simulated physiological loading. Using the proposed technique, we inspect total hip replacement (THA) specimens composed of metallic stems and artificial composite femurs, and characterize the interface of the artificial bone with the orthopaedic implant in a nondestructive and efficient manner. To assess the efficacy of the proposed granular crystal sensor–actuator, we investigate the responsiveness of nonlinear solitary waves to different fixation levels of a metal implant. As a result, we find that the properties of the solitary waves reflected from the contact zone between the granular crystal and the implant are extremely sensitive to the level of stem fixation within the femoral canal. In addition, to monitor in situ the structural degradation of the stem–cement interface, we test the composite femur samples in a custom servo-hydraulic femoral load simulator. The experimental results show that the proposed method is capable of detecting structural failure of the implants, such as cement fracture.
Due to the compactness and sensitivity of the granular crystals, the proposed sensing scheme can be potentially used in different biomedical applications, to inspect the mechanical integrity of implant structures in hard biological systems. The diagnostic scheme using nonlinear solitary waves propagated in granular crystals can be also applied to various engineering fields, such as aerospace, civil, and mechanical applications, to inspect the mechanical properties of different materials and structures. In this study, we limit our investigation to an experimental portion, but further studies are planned to simulate numerically the HNSWs' interaction with the implant structures.
Acknowledgments
We acknowledge support from the National Science Foundation, grants CMMI-825345 and CMMI-844540 (CAREER), and the e-Grubstake Program at Caltech.