

Abstract
A lot of work has gone into the study of valveless micropumps for various applications. However, the complex fluid-structure interactional physics and associated phenomena such as cavitation affects the characterization of valveless micropumps, for applying them reliably in any real-time applications. This paper presents a method of characterization of valveless micropump performance through dynamic measurement of chamber pressure. Experimental investigation has been carried out to study the micropump behavior through pressure measurement under both cavitation and non-cavitation conditions, and the results show that this technique is useful for the characterization of micropump.
Export citation and abstract BibTeX RIS
1. Introduction
Micropump applications are found in a large number of technologies and science domains such as biology, medicine, electronics and space air crafting. In the field of chemical and biotechnology, micropump systems are used in lab-on-a-chip systems for portable testing devices and portable medication delivery appliances such as insulin dispensing.
Recently, a lot of attention has been focused on the development of valveless micropump systems [1–8] which offer several advantages over conventional micropumps, such as elimination of the need for actuation of valves, reduction of mechanical failure, ease of fabrication and implementation, among others. The valveless micropump basically works through the flow rectification produced due to the differential pressure drop across a nozzle and a diffuser in conjunction with the pumping stroke, as schematically shown in figure 1.
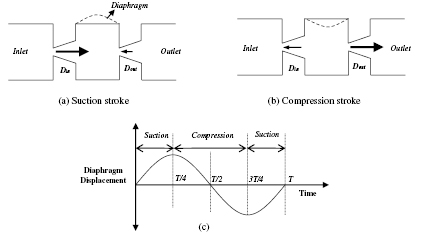
Figure 1. Schematic of flow rectification due to diffuser/nozzle configuration under (a) suction stroke (b) pump stroke. The arrow indicates the direction of fluid flow through the diffusers during each pump stroke and the size of the arrow indicates the relative magnitude (not to scale) of the volume of fluid. (c) Variation of pump stroke with sinusoidal diaphragm deflection in one oscillation cycle of time period T.
Download figure:
Standard image High-resolution imageSince valveless micropumps are designed and microfabricated to meet a set of requirements that vary with their application, these micropumps are required to pump different types of fluid with high controllability, while also taking into account some other important issues such as reduced size, low power consumption and biocompatibility [9]. Therefore, it is very common to find significant differences in the performance from one micropump to another, depending upon each application.
The performance of any micropump is characterized in terms of the flow rate, i.e. the net flow output that the pump can produce with respect to several operating parameters. Numerous scientific and engineering researches have been conducted in the past decade to optimize the working parameters of a valveless micropump for maximizing the flow output. The effect of geometry and working conditions on flow rectification achieved in valveless micropumps has been investigated by several researchers [1, 4, 10–19]. However, the micropump system analysis is a sophisticated multi-disciplinary problem with various field couplings [20]. Though several studies have been carried out, the working of a micropump is still not clearly understood, as it involves significant fluid-structure interaction. It is thus important that, for all real world applications, the accurate performance of a micropump is studied experimentally under suitable working conditions.
One of the important parameters of operation for a valveless micropumping system is the driving frequency, i.e. the frequency of the actuator at which the flow rate is maximum. Most of the research carried out thus far focuses on the measurement of flow rate directly at the micropump outlet against back pressure [21, 22] for different actuation frequencies. Though the micropump output varies from pump to pump depending upon the design and material variations, for a given configuration under similar working conditions, the net flow of the micropump at the driving frequency is expected to be consistent. However, the influence of actuation frequency on the net flow relationship of the micropump is affected in a complex manner due to several other physical phenomena such as cavitation and surface wettability. The inception of cavitation in a micropump system, which occurs for operating frequencies generally higher than the micropumping frequency range, is accompanied by the growth of bubbles affecting the flow pattern of the micropump tremendously [23]. Thus, the micropump performance cannot be completely defined under all working conditions, namely cavitating and non-cavitating conditions, through flow rate measurements alone. None of the available techniques for micropump characterization are fool proof to establish the behavior of a micropump under cavitation, because the formation of vapor bubbles during cavitation alters the behavior of a micropump tremendously. Therefore, it is possible to fully characterize the micropump behavior only through chamber pressure measurements, because the dynamics of the micropump during the pumping stage and the cavitation stage is entirely dependent on the distribution of pressure within the system.
The performance of a micropump is gauged in terms two intrinsic parameters, namely, net positive suction head available (NPSHa) and the net positive suction head required (NPSHr), as schematically shown in figure 2 [23]. The available net positive suction head of the micropump (NPSHa) is defined as the total pressure head available, above the vapor pressure head, for the micropump on the suction side. This depends on the net pressure head developed because of the liquid columns at the inlet and the outlet, and the head loss due to friction and diffuser pressure drop. The net positive suction head required (NPSHr) is defined as the dynamic pressure head required for the fluid to flow under the oscillating diaphragm of the micropump, which is mainly the kinetic head of the liquid entering the micropump chamber and the head needed to overcome the losses encountered inside the micropump chamber. This depends on the dynamic characteristics of the micropump, such as the operating frequency and the membrane deflection. The pressure heads are schematically shown in figure 2, wherein,

Figure 2. Schematic of the energy level diagram in a valveless micropump [23]. (a) Pump working under positive suction head. (b) Pump working under negative suction head.
Download figure:
Standard image High-resolution image —atmospheric pressure head
Hs—static suction head available at the entrance of the micro pump
 —vapor pressure head of liquid at a particular operating temperature
Hd—dynamic pressure loss in the suction line, which includes the pressure drop across the diffuser/nozzle
Hb—static head in the delivery side
 —total head available at the entrance of the pump.
The acceleration of the liquid due to the continuous oscillation of the diaphragm converts the pressure energy to kinetic energy. The behavior of a micropump can therefore be described completely using the parameters NPSHa and NPSHr. Hence, one must necessarily understand NPSHa and NPSHr in order to provide accurate specifications of a micropump. Cavitation occurs when NPSHa is less than NPSHr [23]. While NPSHa can be calculated more directly, it is necessary to know the pressure generated in the micropump chamber and the dynamic pressure variations for calculating the NPSHr. Till date, there is no direct method to study the pressure characteristics of a micropump. This paper presents a technique of measuring the pressure inside the chamber of a micropump, which is a very important parameter to study the performance of a micropump accurately. This technique is also useful to study the variation of chamber pressure due to the dynamic behavior of the micropump, and it helps in clearly understanding the performance of a micropump both during the pumping phase and also during cavitation phase. The following sections of this paper describe the fabrication of micropumps, and characterization of the micropump performance through flow measurements and pressure measurements under different stages, and the comparison of the results.
2. Micropump fabrication and non-cavitating flow characterization
In this study, the micropump was actuated with a piezo actuation system. Piezo actuation is one of the most common actuating principles used in micropumping which is useful to achieve a vast range of flow rates. Advantageous properties such as ease of integration with microsystems and high speed response make piezo-actuation a very good choice for micropump applications. In comparison to devices with different actuation principles, piezoelectric micro-pumps can be designed to work at very high frequencies which translate into increased flow rates, an advantage which is not available for a few other actuation methods such as pneumatic or shape memory alloy actuation [9]. In addition, other advantages of piezoelectric actuator over other types of actuators such as electromagnetic, thermopneumatic, magnetohydrodynamic, etc. is the capacity to generate large forces and the ability of being synthesized and shaped at very small scale thereby enabling the fabrication of robust micropump devices and easy integration with µTAS. The design of the micropump is shown in table 1.
Table 1. The different geometric parameters and the image of the fabricated valveless micropump used for cavitation experiments.
 |
|
|---|---|
| Parameter | Value |
| Diffuser angle, θd | 30° |
| Diffuser length, Ld (µm) | 2000 µm |
| Inlet diffuser width, wd | 100 µm |
| Microchamber depth | 100 µm |
| Micropump chamber length, Lc | 7 mm |
| Inner diameter of connecting tubes, dc | 500 µm |
The micropump base which houses microfluidic channels, diffusers, and micropump chamber was fabricated on polydimethylsiloxane (PDMS) platform with glass membrane forming the diaphragm, which is actuated by a piezo disc. Initially, the PDMS micropump base is fabricated by soft lithography technique using the mold fabricated on silicon with SU8. Deep reactive ion etching (DRIE) of the silicon mold was carried out in order to achieve a total depth of 100 µm. A glass diaphragm is then spun coated with a thin layer of PDMS and semicured (at 80 °C for 180 s), and brought in contact with the PDMS micropump base, after creating ports therein for microfluidic interconnects. Piezo disc (Piezosystems Inc., USA) of 6 mm diameter is then attached with the glass diaphragm using conductive epoxy, along with the electrical leads. The entire assembly is then housed on a support, and microfluidic tubes are inserted in the ports to form a tight fit.
As mentioned before, the performance of a micropump is expressed in terms of its flow rate. Therefore, it is important to characterize the flow rate of the micropump first before carrying out further tests. The flow rate of the micropump is a characteristic of the rectification produced by the diffuser, pump deflection, operating frequency and the back pressure (i.e. the pressure exerted by the system on the liquid moving forward). Experiments carried out to study the performance of the micropump were based on the measurement of the flow rate at different operating conditions, such as the operating frequency, back pressure, and applied voltage. For these experiments, DI water was used as the working fluid.
Initial flow characterizations were carried out with the flow meter attached at the exit of the outlet tube from the micropump. However, it was found that the integration of the flow meter caused an additional back pressure to the system, thereby affecting the flow drastically. Therefore, the flow was measured from the outlet tube of the micropump by tracing the movement of the liquid meniscus against a calibrated scale. The setup is as shown in figure 3. Since the tube at the outlet is open, there is no additional back pressure to the flow of the liquid inside the system. The mean average flow is taken over a period of time, by measuring the distance travelled by the lower meniscus of the liquid in the tube, and since the inner diameter of the tubes are known, the total volume of the fluid that is pumped during the process is calculated.
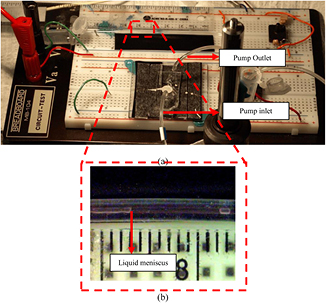
Figure 3. (a) Experimental setup for flow measurement at the micropump outlet (b) Tracking the movement of the liquid meniscus inside the microfluidic tube against a calibrated reading.
Download figure:
Standard image High-resolution imageThe drive frequency of the micropump is defined as the frequency at which maximum flow rate is obtained. For a given micropump system, at the driving frequency, the pressure distribution is optimum so as to favor maximum flow. The flow rate  at zero inlet head, i.e. when there is no pressure exerted at the inlet, was measured for different operating frequencies. The experiments were repeated three times and the average values of the flow rates were recorded. The results of the flow rate measurements are as shown in figure 4. Maximum flow obtained with the micropump was ~55 nl min−1 for a driving frequency of 2 Hz with an applied voltage of 195 Vpp. The flow rate was also studied by varying the applied voltage at this driving frequency. as shown in figure 3(b). It can be seen that the flow rate varies significantly for the change in the diaphragm deflection obtained by varying the voltage. Very insignificant flow rate was obtained for voltage less than 150 Vpp.

Figure 4. (a) Variation of flow rate with pump operating frequency (b) Variation of flow rate with applied voltage.
Download figure:
Standard image High-resolution imageThe flow rate of a micropump is generally calculated against back pressure. As the back pressure increases, the flow rate decreases. In that way, the performance of the micropump is usually calibrated against the maximum workable back pressure. However, when the micropump integrated within a µTAS, one does not have much control over the back pressure in such a system and the flow rate cannot be controlled by changing the back pressure. In such a system, in order to overcome the back pressure applied to the micropump flow, the flow rate can be increased only by increasing the pressure head due to the water column at the suction side [19], i.e. the inlet of the micropump. The schematic of such a system is as shown in figure 5.
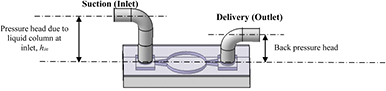
Figure 5. Schematic of the micropump inlet and outlet pressure heads.
Download figure:
Standard image High-resolution imageFor this system, without the application of external pressure, the pressure head can be varied only by the variation of the pressure exerted by the height of the liquid column available at the inlet, hin.
Thus, the pressure due to the liquid column at the inlet is given as

where ρ is the density of the liquid and g is the acceleration due to gravity.
For the present micropump, the flow rate was calculated by varying the pressure available at the inlet of the micropump. The variation of the flow rate with pressure head due to the liquid column at the inlet, Pin, is as shown in figure 6. The flow rate increases linearly as Pin increases. It can also be seen that the maximum pressure that can be overcome by the micropump to produce a forward flow is ~0.8 kPa.
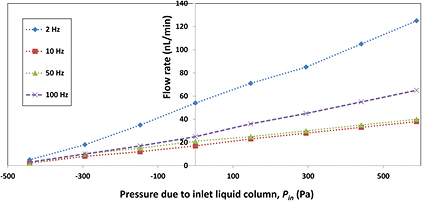
Figure 6. Variation of the pump flow rate with pressure head due to water column at the micropump inlet, at different operating frequencies.
Download figure:
Standard image High-resolution image3. Characterization of micropump through pressure measurement
One of the important considerations for designing a pressure measurement system is that it should not interfere with the main flow of the micropump. The schematic of the micropump chamber pressure measurement is as shown in figure 7(a) and the experimental setup for the pressure measurement in the micropump chamber is as shown in figure 7(b). For the pressure measurement, an independent pressure channel was connected at the top of the micropump chamber to the pressure sensor (Fujikura), as shown in figure 7. Prior to connecting the pressure channels, the microfluidic tubes used as the pressure channels were tested for inherent frictional losses, and it was found that the frictional pressure loss in the pressure channels were negligible. Therefore, the pressure sensor directly measures the static pressure inside the chamber of the micropump. Also, the pressure channels were integrated with the micropump system in such a way that the setup enables the measurement of chamber pressure without disrupting the main flow stream. The entire assembly of the pressure measurement system, which consists of microfluidic pressure sensor circuit connected with the data acquisition system, was made on a circuit board so as to make a rigid setup.
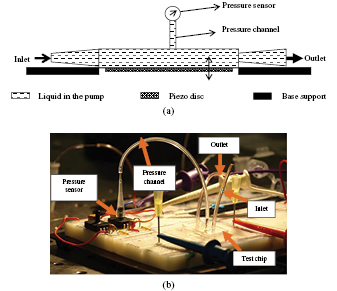
Figure 7. (a) Schematic of the micropump pressure measurement setup (b) Experimental setup for the micropump chamber pressure measurement.
Download figure:
Standard image High-resolution imageThe variation in the chamber pressure at different operating frequencies (1, 2, 3, 5, 10, 15, 20, 25Hz, 30, and 50 Hz) are as presented in figure 8. The y-axis represents the pressure (kPa) and the x-axis represents the arbitrary time of the micropump operation in seconds.

Figure 8. Variation of measured micropump chamber pressure for different actuation frequencies at 195 Vpp. (a) 1 Hz; (b) 2 Hz; (c) 3 Hz; (d) 5 Hz; (e) 10 Hz; (f) 15 Hz; (g) 20 Hz; (h) 25 Hz; (i) 30 Hz; (j) 50 Hz.
Download figure:
Standard image High-resolution image3.1. Comparison of pressure and flow measurement results
During pumping, the micropump chamber pressure (Pc) can be defined by the relation

where Pcm is mean chamber pressure and the dPc is the amplitude of pressure variation due to the sinusoidal oscillation of the diaphragm at the frequency of ωp. Whereas the difference between Pc and the external pressure at the outlet, Po causes the net forward flow of the fluid, the dPc accounts for the oscillatory motion of the fluid. Under no-flow conditions, the mean chamber pressure is given by the relation
i.e. the mean chamber pressure is the average of the pressure available at the inlet and the outlet [17]. However, during pumping, the chamber pressure varies. The extent of this variation depends on several factors, such as pressure drops across the nozzle/diffusers, pressure drops due to channel friction, inertial contribution due to fluid acceleration, etc. However, for any given micropump, there exists an optimum pressure distribution depending upon the combination of the micropump geometry, operating conditions and fluid parameters, which favors the maximum flow. Therefore, at the driving frequency of the micropump, the pressure distribution is optimum so as to favor maximum flow.
The variation of chamber pressure Pc and the amplitude of its variation dPc, at different micropump operating frequencies are shown in figures 9 and 10 respectively. In order to non-dimensionalize the parameter, chamber pressure and the pressure variation have been normalized with respect to its maximum value. It can be seen that the maximum normalized chamber pressure is generated at the frequency of 2 Hz. Comparison of the chamber pressure with normalized micropump flow rate shows that the behavior of both these parameters are very similar, which corroborates the results of flow measurement presented in section 2.

Figure 9. Variation of normalized measured micropump chamber pressure and normalized flow rate against operating frequency.
Download figure:
Standard image High-resolution image
Figure 10. Variation of pressure rise amplitude with pump operating frequency.
Download figure:
Standard image High-resolution imageThus the driving frequency of the present pump configuration is 2 Hz, when the maximum flow rate is obtained due to the generation of maximum pump pressure. It can also be seen that, at the driving frequency, the amplitude of pressure variation due to the sinusoidal motion of the diaphragm is also the maximum, thereby producing the maximum fluid to flow across the diffuser during one cycle, which therefore enables better flow rectification [24] from the diffusers. Thus, it is clear that the maximum flow rate of the micropump is achieved when the maximum pressure is generated in the chamber.
4. Pressure measurement under cavitation conditions
The size of the bubbles generated during cavitation depends on the energy supplied by the oscillating diaphragm to sustain the cavitation growth. As it is difficult to measure the static pressure inside the bubbles of different size range due to the micro nature of the system, the growth of the bubble is monitored indirectly through the rise in pressure of stagnant fluid compressed by the growing bubble. The schematic of the pressure measurement system to monitor the growth of cavitation bubbles is as shown in figure 11. Herein, the growth of the bubble in the micropump chamber squeezes the liquid column in the stagnant channel, which causes an increase in pressure on the pressure sensor. The inception of cavitation bubbles usually occurs near the center of the oscillating diaphragm. But due to asymmetry and nucleating conditions, the inception and growth of cavitation bubbles also occurs away from the center of the diaphragm. In both cases, whether the bubbles directly touch the stagnant fluid chamber or not, growth of the bubbles inside the chamber squeezes the fluid in the measuring channel leading to increase in measured pressure. Thus, the increase in the squeezing pressure exerted by the bubbles becomes indicative of the growth rate of the bubble in the micropump chamber as schematically shown in the pressure variation curve in figure 11(b).
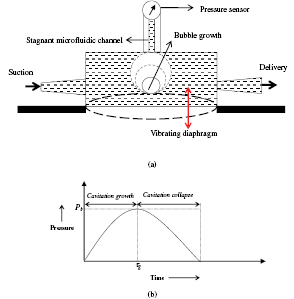
Figure 11. Schematic of (a) pressure measurement setup during cavitation, using stagnant microfluidic channel to monitor the bubble growth (b) pressure variation under cavitation conditions.
Download figure:
Standard image High-resolution imageThe pressure-growth relationship of the cavitation bubbles is denoted by the bubble pressure ratio, σp. If the pressure exerted by the bubble at any time t during the operation of the pump is denoted as Pb(t), then the bubble pressure ratio is given as
where τg is the total time taken for the maximum bubble growth before collapse. The maximum bubble pressure is obtained at t = τg.
The plot of the variation of σp with time for different cavitation frequencies (νc) is as shown in figure 12(a). Since there is no bubble formed in the chamber when the pump is not operated, at time t = 0, σp is 0. The increase in the pressure indicates the expansion of the bubbles inside the micropump chamber. Usually, the collapse time for the bubble is very short, of the order of a few milliseconds [25, 26], the volume attained by the expanding vapor bubbles is maximum at t = τg. The rate of increase in pressure depends on the actuation frequency. For lower frequencies, the time taken for the bubbles to expand and reach the maximum volume before collapse is longer. As the pumping frequency is increased, the time taken for the bubble to attain the maximum pressure reduces, which indicates that the rate at which the bubble growth is faster at higher frequencies. After attaining a maximum pressure at t = τg, the decrease in σp indicates the beginning of collapse of the cavitation bubbles. The overall volume occupied by the bubbles inside the chamber reduces as the bubbles collapse, and thus the pressure exerted by the bubbles reduces.

Figure 12. (a) Variation of bubble pressure ratio with time for different actuation frequencies. (b) Comparison of τg between pressure measurement and visualization of bubble collapse.
Download figure:
Standard image High-resolution imageThe total time taken for bubble growth (τg) was compared to the results obtained from flow visualization [23], and the comparison is presented in figure 12(b). It can be seen that there is a very close agreement between the results obtained from both these experiments, which thus corroborates the results presented in figure 12(a).
During micropumping stage, the pressure in the chamber varies in phase with the oscillation of the diaphragm as shown in figure 7. This is because, at very low frequencies, when there is no bubble growth during the micropumping phase, the pressure exerted by bubbles is zero and hence the variation of pressure is purely in phase with the oscillating diaphragm. However, during cavitation phase, the pressure increases due to the inception and growth of cavitation bubbles. Therefore, the increase in pressure is an indicator of the inception of cavitation.
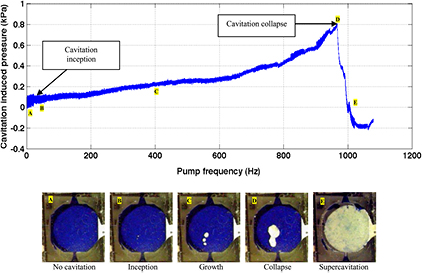
In order to verify this, another experiment was carried out wherein the frequency was continuously varied at an interval of 1 Hz and the pressure due to the bubble growth was recorded. The results are presented in figure 13, together with the image of the micropump chamber at each stage of cavitation. For better flow visualization, colored dye was used for this experiment. It can be seen that cavitation inception occurs at around 50 Hz. Thereafter the growth of cavitation bubbles is continuous as the frequency is increased. Also, from the results presented in figure 12, the increase in pressure due to the bubble growth at a monotonic frequency has a constant slope. However, when the frequency is changed continuously, the slope of the curve changes drastically until the bubbles collapse. The pressure increase continues till ~950 Hz beyond which the energy supplied by the oscillating diaphragm causes the cavitation bubbles to collapse. The rate of pressure drop is drastic which shows the continued collapse of cavitation bubbles.
Figure 13. Variation of cavitation induced pressure with frequency.
Download figure:
Standard image High-resolution image
The results presented in figure 13 clearly shows that pressure measurement can be used to understand the different stages of cavitation i.e. the inception, growth and collapse of the cavitation bubbles. Under no cavitation condition, the slope of the curve of cavitation-induced pressure is zero and the pressure in the chamber varies with the oscillation of the diaphragm as shown in figure 8. However, the increase in slope indicates inception and growth of cavitation bubbles, with the rate of growth of bubbles being directly proportional to the increase in slope in figure 12. The collapse of cavitation bubbles is indicated by a decrease in the pressure curve. Thus, by measuring the pressure inside a micropump chamber, it is possible to reliably characterize both the cavitation and non-cavitation behavior of a valveless micropump.
5. Conclusion
The performance of valveless micropumps is usually characterized by flow rate which varies from pump to pump because of the coupled multiphysics involving the micropump geometry and the nature of fluid. However, for the same design configuration under similar working conditions, the performance of a micropump i.e. the net flow output and the driving frequency, is expected to be constant. Despite several analytical studies, till date, the flow rate of a micropump and the driving frequency have been verified only through experimental characterization. The pressure measurement technique proposed in this work provides an alternate and easy method in addition to the flow measurement to characterize the pump behavior in terms of chamber pressure. For a particular valveless micropump configuration, the flow behavior of the micropump is dependent on the pressure generated in the chamber and the distribution of pressure within chamber, which affects the net fluid flow. Therefore, it is very useful to study the performance of a micropump and the interaction of the micropump diaphragm and the chamber during cavitating and non-cavitating conditions through its chamber pressure measurement. Also, the dynamic pressure measurement provides a method of measuring the NPSHr of a micropump.
Another compelling reason for carrying out pressure measurement in a micropump is for the study of cavitation behavior. Cavitation is a pressure related phenomenon which cannot be completely described by flow measurement. Therefore, pressure measurement provides a way to accurately study the performance of a micropump at different stages of pumping and cavitation. Thus, this paper presents the successful effort to measure the interaction between the micropump diaphragm and the chamber through dynamic pressure variation in the valveless micropump chamber under both cavitation and non-cavitation conditions.