

Abstract
Sensitive detection of a specific deoxyribo nucleic acid (DNA) sequence is important for biomedical applications. In this report, a two-step amplification strategy is developed based on magnetic nanoparticles (MNPs) to achieve ultrasensitive DNA fluorescence detection. The first level amplification is obtained from multiple binding sites on MNPs to achieve thousands of probe DNA molecules on one nanoparticle surface. The second level amplification is gained by enzymatic reaction to achieve fluorescence signal enhancement. MNPs functionalized by probe DNA (DNAp) are bound to target DNA (t-DNA) molecules with a ratio of 1:1 on a substrate with capture DNA (DNAc). After the MNPs with DNAp are released from the substrate, alkaline phosphatase (AP) is labelled to MNPs via hybridization reaction between DNAp on MNPs and detection DNAs (DNAd) with AP. The AP on MNPs catalyses non-fluorescent 4-methylumbelliferyl phosphate (4-MUP) to fluorescent 4-methylumbelliferone (4-MU) with high intensity. Finally, fluorescence intensity of the 4-MU is detected by a conventional fluorescence spectrophotometer. With this two-step amplification strategy, the limit of detection (LOD) of 2.8 × 10⁻¹⁸ mol l−1 for t-DNA has been achieved.
Export citation and abstract BibTeX RIS

Original content from this work may be used under the terms of the Creative Commons Attribution 3.0 licence. Any further distribution of this work must maintain attribution to the author(s) and the title of the work, journal citation and DOI.
1. Introduction
Sensitive and selective DNA detection for a specific sequence is of great importance because of its broad applications in biomedical studies [1–3], clinical diagnosis [4–7] and genetics therapy [8, 9]. In particular, some diseases like cancers are induced by genetic disorders; therefore, specific genes usually play important roles in the diagnosis of these diseases [10, 11]. Thus, sensitive and selective amplification methods for DNA detection are desirable and represent an important advance in these fields.
Recently, many amplification methods for DNA detection have been reported for the distinct advantages of ease of use, rapid response, low cost and cheap instrumentation, such as technology based on nanoparticle amplification [2, 12]. Magnetic nanoparticles (MNPs) [1, 13–16] and noble metal nanoparticles [2, 9, 17–21] such as gold and silver nanoparticles have been most commonly used in the amplification strategies. Among them, MNPs stand out in applications due to the following specific advantages. Firstly, when the MNPs are applied, the separation between target molecules and substances can be realized easily by external magnetic field [22–24]. In addition, MNPs modified with various recognition elements can be used for specific bio-affinity capture of different molecules because of good biocompatibility and adequate functional groups for chemical fixation [7]. In these strategies, usually one target DNA (t-DNA) molecule corresponds to one MNP that is usually modified with a large number of labels such as probe DNA (DNAp) molecules and detection DNA (DNAd) molecules, meaning that one t-DNA molecule corresponds to a large number of labels. In this way, the signal of t-DNA will be significantly amplified because of the large number of labels on the surface of MNPs [16, 25–27].
Up to now, a variety of amplification methods for DNA detection have been developed to improve detection sensitivity. Polymerase chain reaction (PCR) assays have been commonly applied for rapid and specific ultra-trace DNA detection due to their high sensitivity and specificity, as well as good analytical parameters [6, 28]. However, the PCR technique is highly dependent on DNA sample properties and the precise change of temperature [4, 29]. Enzyme-amplified assays have been reported frequently to improve the sensitivity and detection limit of detection techniques. Enzymes are very efficient catalysts for biochemical reactions and are highly selective for catalyzing specific reactions with high sensitivity. Therefore, enzymes are usually used in signal amplification-based bioassay [3, 15, 30–35].
In this paper, we develop a two-step quantitative amplification strategy for specific DNA determination based on the combination of multiple binding sites of MNPs and enzymatic reaction for ultra-sensitive fluorescence determination. The schematic principle of this strategy is shown in figure 1. The first step amplification is realized by modifying one streptavidin-coated MNP (SA-MNP) with thousands of biotinylated DNAp (B-DNAp) molecules. Two DNA hybridization reactions: biotinylated capture DNA (B-DNAc) on a streptavidin (SA)-coated substrate with t-DNA and t-DNA with DNAp on MNPs, are applied to bind MNPs to t-DNA molecules on the substrate with a ratio of 1:1. The second step amplification is achieved by the enzymatic reaction of alkaline phosphatase (AP) labelled onto the MNPs via hybridization reaction of B-DNAp and biotinylated detection DNA (B-DNAd) with streptavidin-AP (SA-AP). The AP on MNPs catalyzes non-fluorescent 4-methylumbelliferyl phosphate (4-MUP) to fluorescent 4-methylumbelliferone (4-MU) to gain strong fluorescence intensity. Finally, the fluorescence intensity of 4-MU is detected by a conventional fluorescence spectrophotometer to determine extremely low concentrations of t-DNA.
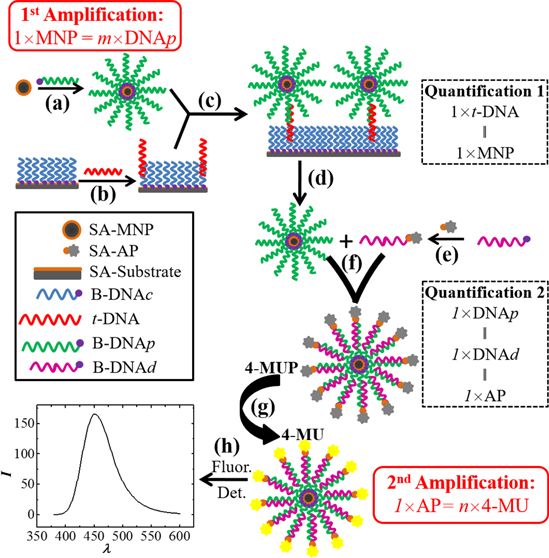
Figure 1. Schematic drawing of the two-step quantitative amplification process for fluorescence determination of t-DNA: (a) fabrication of DNAp-MNPs (first amplification), (b) hybridization of t-DNA to DNAc modified on a SA-substrate, (c) conjugation of DNAp-MNPs to the substrate via hybridization on DNAp and t-DNA at 1:1 ratio (quantification 1), (d) release of DNAp-MNP from the substrate, (e) fabrication of DNAd-AP via irreversible interaction between biotin of B-DNAd and streptavidin of SA-AP, (f) hybridization of DNAp on MNPs and DNAd with AP to form AP-DNAd-DNAp-MNPs (quantification 2), (g) conversion of non-fluorescent 4-MUP to fluorescent 4-MU via the catalysis reaction of AP-DNAd-DNAp-MNPs (second amplification), and (h) fluorescence detection.
Download figure:
Standard image High-resolution image2. Materials and methods
2.1. Reagents and solutions
Streptavidin (SA)-MNPs (350 nm diameter) from Ademtech (Pessac, IN, France), Tris (>99.8%) from Amresco Inc. (Solon, OH), streptavidin HC coated plates (S6940, 96 wells) from Sigma (St. Louis, MO), Tween-20 from Sangon Co. Ltd (Shanghai, China), SA-AP solution (1 mg ml−1) from Shanghai Herochem Bioreagent Co. Ltd (Shanghai, China) and 4-MUP from Alladin were used in the experiments. The phosphate buffered saline (PBS) consisted of 0.15 mol l−1 NaCl, 7.6 × 10⁻³ mol l−1 NaH2PO4, and 2.4 × 10⁻³ mol l−1 Na2HPO4 (pH 7.4). The TE buffer consisted of 0.010 mol l−1 Tris-HCl and 0.001 mol l−1 Na2EDTA (pH 8.0). The TT buffer consisted of 0.25 mol l−1 Tris-HCl (pH 8.0) and 0.1% Tween 20. The TTE buffer consisted of 0.25 mol l−1 Tris-HCl (pH 8.0), 0.1% Tween 20 and 0.020 mol l−1 Na2EDTA (pH 8.0). The TTL buffer consisted of 0.100 mol l−1 Tris-HCl (pH 8.0), 0.1% Tween 20 and 1 mol l−1 LiCl. Other chemicals were obtained from standard reagent suppliers. The synthetic single-stranded B-DNAc (biotin-5'-T20–GGAAGGTGAAGGTCGGAGTCAACGGATT-3'), B-DNAp (biotin-3'-T20–GTATTTTCTCGAGG-T20-TCCTCACCCACAGCGACAACTTCAGTCTC-5'), B-DNAd (biotin-3'- T20–ACCTCGAGAAAATAC-5'), and t-DNA (5'-GGAGTGGGTGTCGCTGTTGAAGTCAGAGAATCCGTTGACCTTCC-3') were purchased from Sangon Co. Ltd (Shanghai, China). The 1.00 × 10⁻⁴ mol l−1 stock solutions for each DNA were prepared by centrifuging for 1 min at 1000 rpm and dissolved in an appropriate volume of TE buffer, and stored at −20 °C. The diluted DNA solutions were obtained by a serial dilution with TE buffer. Before experiments, the solutions were heated for 5 min at 90 °C and then cooled for 10 min in an ice bath. The preparation of the DNA solutions was performed on a clean bench. To prevent contamination from possible repeat sampling, the commercial SA-MNP suspension and the stock DNA solutions were divided into several small packs in disinfected plastic vessels. All aqueous solutions were prepared with doubly distilled water.
2.2. Fabrication of DNAp-MNPs
To remove surfactants in SA-MNP suspension, 400 μl of TTL buffer was added into 10 μl of 2.0 × 10⁷ MNPs μl−1 SA-MNP suspension. After washing three times with TTL buffer, the SA-MNPs were diluted with 30 μl of TTL buffer. Then, 30 μl of 1.0 × 10⁻⁵ mol l−1 B-DNAp solution was added to the SA-MNP suspension and the suspension was incubated for 2 h. The unreacted B-DNAp was washed away with 400 μl of 0.15 mol l−1 NaOH, 400 μl of TT buffer and 400 μl of TTE buffer twice, respectively. During washing SA-MNPs, a magnet was placed underneath the vessel. Subsequently, 10 μl of TTE buffer was added to disperse the DNAp-MNPs for subsequent experiments.
2.3. Binding of DNAp-MNPs to t-DNA captured on substrate
The wells of the streptavidin-coated plates were used as the reactors. B-DNAc was bound onto the streptavidin (SA)-coated substrate of the well according to the same procedure as described in the previous work [15]. Then, 270 μl of t-DNA and 30 μl of 5.0 mol l−1 NaCl were added to the well, and the solution was incubated for 2 h in a constant-humidity chamber to capture t-DNA on the substrate. Subsequently, the substrate of the well was washed three times with 200 μl of 0.5 mol l−1 NaCl. The DNAp-MNPs were conjugated to the t-DNA captured on the substrate by adding 20 μl of 2.0 × 10⁷ MNPs μl−1 DNAp-MNP suspension obtained above and 20 μl of 1.0 mol l−1 NaCl, and incubating for 2 h in the constant-humidity chamber. Then, the solution was removed and the substrate was washed three times with 200 μl of 0.5 mol l−1 NaCl to remove the unconjugated DNAp-MNPs. In the washing step, no magnet was used.
2.4. Release of DNAp-MNPs from the substrate and functionalization of the MNPs
To release DNAp-MNPs from the substrate through dehybridization, the solution was incubated for 10 min after 200 μl of 50% (w/w) urea solution was added to the well with DNAp-MNPs on the substrate. Then, the released DNAp-MNPs were transferred to a vessel and washed three times with 200 μl of 0.5 mol l−1 NaCl. Before functionalization of the DNAp-MNPs, B-DNAd was modified with SA-AP via the reaction between biotin and streptavidin. 30 μl of 1.0 × 10⁻⁴ mol l−1 SA-AP solution was added into 15 μl of 1.0 × 10⁻⁵ mol l−1 B-DNAd solution to conjugate AP to the DNAd. Then the solution with AP-DNAd was added into the DNAp-MNP solution fabricated above. 100 μl of 1 mol l−1 NaCl was added as the reaction buffer. The solution was then incubated for 2 h to obtain AP-DNAd-DNAp-MNPs. After that, the AP-DNAd-DNAp-MNPs were magnetically separated and washed twice with 200 μl of 0.5 mol l−1 NaCl and 200 μl PBS buffer by placing a magnet underneath the vessel. Then 10 μl of TTE buffer was added for subsequent experiments.
2.5. Fluorescence detection of AP-DNAd-DNAp-MNPs
100 μl of 1.0 × 10⁻³ mol l−1 4-MUP was added to the vessel. The reaction was conducted at 35 °C in the dark area for 2 h. At the end of the reaction, the solution was taken out for fluorescence detection. Fluorescence spectrophotometer (F-4600, Hitachi, Tokyo, Japan) was used to record fluorescence emission spectra at an excitation wavelength of 360 nm with an excitation slit width of 5 nm, an emission slit width of 5 nm and a scan speed of 1200 nm min−1.
3. Results and discussion
3.1. Fabrication of AP-DNAd-DNAp-MNPs
SA-AP and B-DNAd with a ratio of 20:1 were used to prepare AP-DNAd without separation through the irreversible interaction between streptavidin and biotin (Ka = 1015mol−1 l−1) with rapid binding kinetics and strong affinity. In this case, almost all B-DNAd was bound by SA-AP. The DNAp-MNP conjugates were obtained using B-DNAp and SA-MNPs. Bigger MNPs can obtain a larger signal amplification factor due to the larger surface area on which the AP-DNAd is attached. However, bigger MNPs conjugated to single t-DNA molecules on the substrate with a ratio of 1:1 are easily removed due to larger mass during shaking in multiple washing steps for removing reagents in solution. It has been demonstrated that 350 nm diameter MNPs can be against the washing operation after they are conjugated to single t-DNA molecules immobilized on the substrate [15]. Therefore, 350 nm SA-MNPs were chosen in this work. The B-DNAp (biotin-3'-T20-GTATTTTCTCGAGG-T20-TCCTCACCCACAGCGACAACTTCAGTCTC-5') has a complementary sequence (sequence 1, TGGAGCTCTTTTATG) to the AP-DNAd sequence at the biotin end and a complementary sequence (sequence 2, CTCTGACTTCAACAGCGACACCCACTCC) to the t-DNA sequence at the other end to hybridize both AP-DNAd and t-DNA. In order to reduce the steric hindrance between the B-DNAp and the matched AP-DNAd, and between the B-DNAp and the matched t-DNA immobilized on the substrate, a sequence with 20 thymines as a spacer was inserted to the B-DNAp between biotin and sequence 1, and between sequence 1 and sequence 2.
The AP-DNAd-DNAp-MNPs were fabricated using the AP-DNAd and DNAp-MNPs through a hybridization reaction between DNAd and DNAp. It has been demonstrated in the literature [15] that when the ratio of the number of B-DNAp molecules to the biotin binding sites on the surface of SA-MNPs is 20:1 during preparing DNAp-MNP conjugates, the surface of the SA-MNPs is almost completely occupied by B-DNAp, and the average number of AP-DNAd bound onto the surface of one DNAp- MNP is ∼7000. This means that a huge amount of AP can be attached to the surface of one MNP. Therefore, the same ratio of the amount of AP-DNAd to biotin binding sites on the surface of the SA-MNPs was used in this work. Additionally, a NaCl solution with high concentration (0.5 mol l−1) as the hybridization buffer and washing buffer was used in the hybridization step. In this case, the stability of the hybrids consisting of DNAp and AP-DNAd on the MNPs was enhanced.
3.2. Optimization of experimental conditions
In this MNP-based two-step amplification strategy, the amplification factor of detection signal depends on the number of AP-DNAd on the surface of one MNP and the amount of fluorescent 4-MU (the product of non-fluorescent 4-MUP), to which 4-MUP is converted by the AP in the AP-DNAd in alkaline conditions according to equation (1) in [36]. When 4-MU is excited by a light in the range of 280–440 nm, 4-MU emits a light with a maximum emission wavelength (λem,m) of 360 nm. Therefore, light with an excitation wavelength (λex,m) of 360 nm, with which the maximum fluorescence emission of 4-MU is obtained, was used in this work to excite 4-MU during recording the emission spectra of 4-MU (figure 2). The concentration of 4-MU used for this measurement was 1.0 × 10⁻⁶ mol l−1.
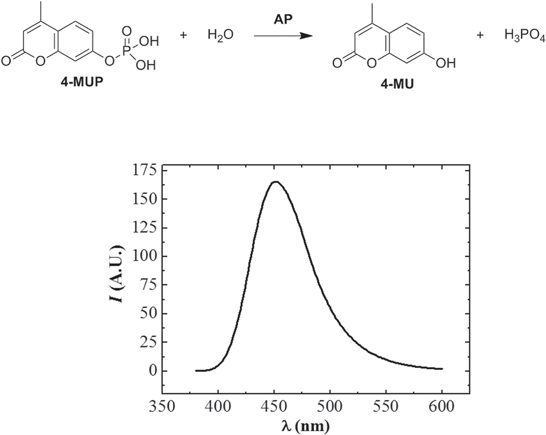
Figure 2. The emission spectrum of 4-MU at λex, m = 360 nm.
Download figure:
Standard image High-resolution imageIt has been demonstrated that AP in Tris-HCl buffer with a pH of 9.4 can efficiently catalyze the conversion of 4-MUP to 4-MU [36]. The same buffer was used to perform the AP-catalyzed reaction in this work. The amount of 4-MU converted by AP depends on the 4-MUP concentration (C4-MUP), reaction temperature (Tr) and time (tr). Accordingly, these parameters have been studied. Firstly, we investigated the influence of C4-MUP on the fluorescent intensity of 4-MU with concentrations of AP in the range between 1.0 × 10⁻⁹ and 1.0 × 10⁻⁷ mol l−1. The reaction temperature was 35 °C, and the reaction time was 2 h. When AP concentration was 1.0 × 10⁻⁷ mol l−1, the fluorescence emission spectra of 4-MU at different C4-MUP are shown in figure 3(a). As shown in figure 3(b), the maximum fluorescence intensity (Im) increased with increasing C4-MUP. When C4-MUP increased to >1.0 × 10⁻³ mol l−1, Im became stable. When AP concentrations were <1.0 × 10⁻⁷ mol l−1, Im increased with increasing C4-MUP, and no stable Im values were observed for C4-MUP in the range between 1.0 × 10⁻³ and 1.0 × 10⁻¹ mol l−1. Moreover, Im values were less than the Im value for 1.0 × 10⁻⁷ mol l−1 AP. C4-MUP of 1.0 × 10⁻³ mol l−1 was used in this work. When C4-MUP was the same, the amount of 4-MU was determined by Tr and tr. Figure 3(c) shows the fluorescence spectra of 4-MU at different Tr for C4-MUP = 1.0 × 10⁻³ mol l−1 and tr = 20 min in the presence of 5 × 10⁻⁹ mol l−1 SA-AP. Im shows a maximum value at Tr = 35 °C. This value was used in the subsequent experiments. Figure 3(d) shows Im of 4-MU at different tr. Im increased with the reaction time at the beginning. When tr was 1 h, Im started to increase slowly and stayed stable afterwards. Therefore, the reaction time was set to 2 h in the following experiments to ensure optimum conditions. Therefore, the experimental conditions were set as λex,m = 360 nm, C4-MUP = 1.0 × 10⁻³ mol l−1, Tr = 35 °C and tr = 2 h.
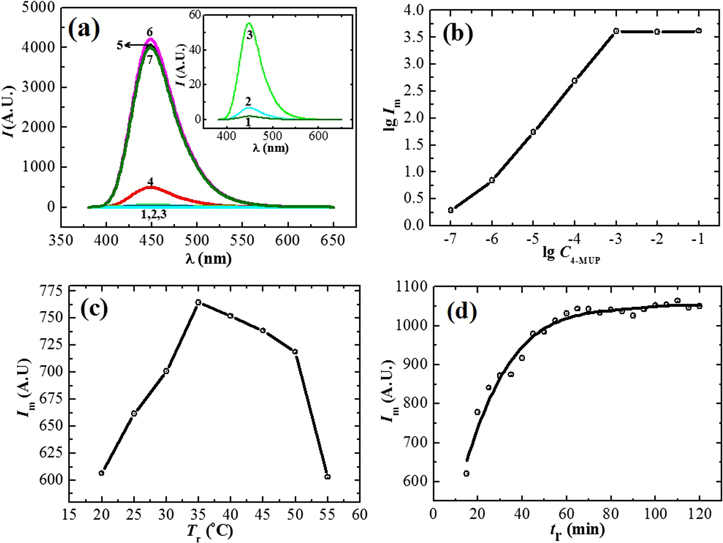
Figure 3. (a) Fluorescence spectra of 4-MU at different C4-MUP (mol l−1): (1) 1.0 × 10⁻⁷, (2) 1.0 × 10⁻⁶, (3) 1.0 × 10⁻⁵, (4) 1.0 × 10⁻⁴, (5) 1.0 × 10⁻³, (6) 1.0 × 10⁻², (7) 1.0 × 10⁻¹; (b) logarithmic relationship between Im on the spectra and C4-MUP; (c) relationship between Im and Tr and (d) relationship between Im and tr.
Download figure:
Standard image High-resolution image3.3. Detection of AP-DNAd-DNAp-MNPs
Since one t-DNA molecule corresponds to one MNP in this strategy, detection of t-DNA depends on the detection of AP-labeled MNPs, i.e. AP-DNAd-DNAp-MNPs. The fluorescence intensity of the product 4-MU in the enzymatic reaction of AP-labeled MNP is influenced by concentration of 4-MUP, reaction time, reaction temperature and AP-DNAd-DNAp-MNP concentration. Based on the results shown in the previous section, C4-MUP, Tr and tr were set as C4-MUP = 1.0 × 10⁻³ mol l−1, Tr = 35 °C and tr = 2 h. Figure 4 shows the fluorescence emission spectra of 4-MU at different AP-DNAd-DNAp-MNP solutions. When AP-DNAd-DNAp-MNP concentration was reduced to 1.0 × 10⁵ MNPs μl−1, the fluorescence spectrum is close to that of the blank solution. The limit of detection (LOD) could be calculated to be 3.3 × 10⁵ MNPs μl−1 according to the equation LOD = 3σ/S, where σ is the standard deviation for a series of nine measurements of the blank solution and S is the slope of the calibration curve of Im and AP-DNAd-DNAp-MNP concentration [37].

Figure 4. Fluorescence spectra of 4-MU in the solutions at different concentrations of AP-DNAd-DNAp-MNP (MNPs/μl): (1) 0, (2) 1.0 × 10⁵, (3) 5.0 × 10⁵, (4) 1.0 × 10⁶, (5) 5.0 × 10⁶, (6) 1.0 × 10⁷, (7) 5.0 × 10⁷. C4-MUP = 1.0 × 10⁻³ mol l−1, Tr = 35 °C and tr = 2 h.
Download figure:
Standard image High-resolution image3.4. Signal amplification factor of AP-DNAd-DNAp-MNPs
The signal amplification factor of the heterogeneous enzyme-catalyzed reaction for the enzyme immobilized on the surface of MNPs is different from that of the homogeneous enzyme-catalyzed reaction in a free enzyme solution. The signal amplification of the heterogeneous enzyme-catalyzed reaction from AP-DNAd-DNAp-MNPs has been investigated by comparing Im of 4-MU converted by the AP-DNAd-DNAp-MNPs and that converted by AP. The optimum conditions (C4-MUP = 1.0 × 10⁻³ mol l−1, Tr = 35 °C and tr = 2 h) mentioned above for the AP-catalyzed reaction in Tris-HCl buffer were used in these experiments. It was found that the Im value of 4-MU measured in 1.7 × 10⁻¹² mol l−1 AP-DNAd-DNAp-MNP solution was the same as that measured in 1.0 × 10⁻⁷ mol l−1 AP solution under the same optimum conditions. The experimental results indicate that when concentration of AP-DNAd-DNAp-MNP (1.7 × 10⁻¹² mol l−1) is about 6 × 10⁴ times lower than that of AP (1.0 × 10⁻⁷ mol l−1), the same fluorescence intensity is obtained, i.e. the signal amplification factor of the heterogeneous enzyme-catalyzed reaction for the AP-DNAd-DNAp-MNPs used in this work is about 6 × 10⁴ times higher than that of the homogeneous enzyme-catalyzed reaction for AP.
3.5. Quantification of t-DNA by the two-step amplification strategy
It has been demonstrated that when the commercial SA-coated substrates from Sigma are used, the nonspecific adsorption and binding of DNAp-MNPs can be eliminated [15]. The same SA-coated substrates were used in this work to bind the B-DNAc. In order to decrease the steric hindrance of the hybridization reaction between t-DNA and DNAc, B-DNAc with a sequence of 20 thymines at the biotin end of B-DNAc acting as a spacer was used. For determination of t-DNA using this method, one MNP should be bound to one t-DNA molecule onto the substrate. Therefore, in this work, the distance between two adjacent t-DNA molecules captured on the substrate was larger than the MNP diameter. To guarantee this, very low t-DNA concentrations should be used. It has been demonstrated that when 1.0 × 10⁻¹² mol l−1 t-DNA is used, this requirement can be met [15]. In this work, concentrations of t-DNA lower than 1.0 × 10⁻¹² mol l−1 were used. In addition, a high concentration of NaCl (0.5 mol l−1) was used as the hybridization buffer and washing buffer to enhance the stability of the hybrids of t-DNA with DNAc and t-DNA with DNAp. Then, 50% (w/w) urea solution was used to release the DNAp-MNPs from the substrate through a dehybridization reaction. After labelling AP with AP-DNAd, the AP-DNAd-DNAp-MNPs catalyzed 4-MUP to 4-MU via the enzymatic reaction of AP, and the fluorescence of 4-MU was detected to quantify the t-DNA.
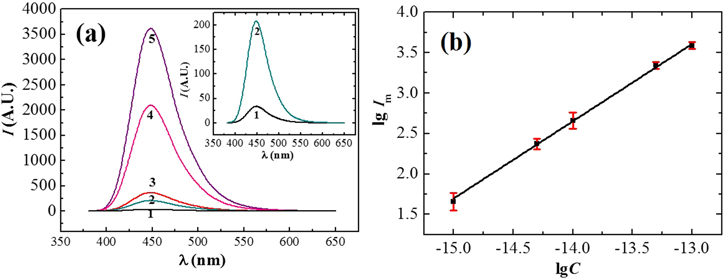
Since both AP and 4-MUP are non-fluorescent, during detecting the fluorescence of the generated 4-MU, no separation of 4-MU from AP and 4-MUP is needed. In order to determine fluorescence of 4-MU, the same optimum conditions mentioned above for the enzyme-catalyzed reaction, i.e. C4-MUP = 1.0 × 10⁻³ mol l−1, Tr = 35 °C and tr = 2 h, were used. The fluorescence spectra of 4-MU for different t-DNA concentrations and the logarithmic relationship between Im and t-DNA concentration (Ct-DNA) (three measurements for each point) are shown in figure 5. The linear dynamic range from 1.0 × 10⁻¹³ mol l−1 to 1.0 × 10⁻¹⁵ mol l−1 was obtained. The slope of the straight line in figure 5(b) was 0.955 with a correlation coefficient of 0.998. The LOD of the method for t-DNA determination could be calculated to be 2.8 × 10⁻¹⁸ mol l−1. The LOD reported in this work is ∼1 × 10⁴ times lower than that of the method with one-step amplification (2.7 × 10⁻¹⁴ mol l−1) [34], and ∼3 × 10³ lower than that of the method with two-step amplification (8.5 × 10⁻¹⁵ mol l−1) [16] reported in literature. Using the two-step amplification strategy described in this work, ultrasensitive detection of t-DNA can been achieved.
Figure 5. (a) Fluorescence emission spectra of 4-MU at different concentrations of t-DNA (mol/l): (1) 1.0 × 10⁻¹⁵, (2) 5.0 × 10⁻¹⁵, (3) 1.0 × 10⁻¹⁴, (4) 5.0 × 10⁻¹⁴, (5) 1.0 × 10⁻¹³; and (b) logarithmic relationship between Im on the spectra and the concentration of t-DNA.
Download figure:
Standard image High-resolution image
4. Conclusions
A two-step amplification strategy with magnetic nanoparticle amplification and enzymatic reaction amplification has been proposed. The first step amplification is realized by a DNA hybridization–dehybridization reaction of DNAc ↔ t-DNA ↔ DNAp on the surface of MNPs, and the quantification relation between 350 nm MNP and t-DNA with a ratio of 1:1. The second amplification is achieved by the enzymatic catalyzed reaction by converting non-fluorescent 4-MUP to fluorescent 4-MU via AP on MNPs, and the quantification is realized by hybridization reaction of AP-DNAd ↔ DNAp-MNP. The two-step amplification strategy has also been verified by ultimate fluorescence detection of 4-MU and quantification of t-DNA by using a conventional fluorescence spectrophotometer. This method with the LOD of 2.8 × 10⁻¹⁸ mol l−1 for t-DNA can be applied in the field of ultra-high sensitivity DNA detection.
Acknowledgments
We appreciate the financial support by Natural Science Foundation of China (No. 21303060 and No. 61574065), Program for Changjiang Scholars and Innovative Research Team in University (IRT13064), Guangdong Engineering Technology Center of Optofluidics Materials and Devices (2015B090903079), International Cooperation Base of Infrared Reflection Liquid Crystal Polymers and Device (2015B050501010) and Guangdong Natural Science Foundation (No. 2014A030308013).