
Abstract
Kelvin probe force microscopy (KPFM) is a powerful characterization technique for imaging local electrochemical and electrostatic potential distributions and has been applied across a broad range of materials and devices. Proper interpretation of the local KPFM data can be complicated, however, by convolution of the true surface potential under the tip with additional contributions due to long range capacitive coupling between the probe (e.g. cantilever, cone, tip apex) and the sample under test. In this work, band excitation (BE)-KPFM is used to negate such effects. In contrast to traditional single frequency KPFM, multifrequency BE-KPFM is shown to afford dual sensitivity to both the electrostatic force and the force gradient detection, analogous to simultaneous amplitude modulated and frequency modulated KPFM imaging. BE-KPFM is demonstrated on a Pt/Au/SiOx test structure and electrostatic force gradient detection is found to lead to an improved lateral resolution compared to electrostatic force detection. Finally, a 3D-KPFM imaging technique is developed. Force volume (FV) BE-KPFM allows the tip–sample distance dependence of the electrostatic interactions (force and force gradient) to be recorded at each point across the sample surface. As such, FVBE-KPFM provides a much needed pathway towards complete tip–sample capacitive de-convolution in KPFM measurements and will enable quantitative surface potential measurements with nanoscale resolution.
Export citation and abstract BibTeX RIS

Content from this work may be used under the terms of the Creative Commons Attribution 3.0 licence. Any further distribution of this work must maintain attribution to the author(s) and the title of the work, journal citation and DOI.
1. Introduction
Kelvin probe force microscopy (KPFM) [1] has become the gold standard for characterization of electrostatic and electrochemical properties of materials and devices on nanometer length scales. KPFM is well established as a quantitative technique, providing an accurate measurement of the local contact potential difference (CPD) between tip and sample material, which in turn can be related to a range of electrochemical properties depending on the material under test. KPFM has found applications across a broad range of material research, for measuring work function in metals [1], surface photo-voltage in photovoltaics [2–6], surface potential distribution in polymeric thin films [7] ferroelectrics [7–14] and across working devices [15]. In biology, KPFM has been used for label free detection of biomolecules [16–18], for detection of specific binding events [19], surface photo-voltage in optically active proteins [20], as well as presenting an interesting opportunity for non-invasive DNA sequencing [19, 21]. Although conventional KPFM has been applied across a broad range of disciplines, the technique is known to suffer from systemic errors and a dependence of the measured CPD on both operational parameters (e.g. ac drive amplitude, tip–sample distance, feedback optimization) [8, 22–26] and sample-topographical effects [27]. In light of such imperfections, the broad applicability of KPFM across diverse fields of study has been remarkable in the face of the technical difficulties. We note two major obstacles for readily achieving truly quantitative high resolution KPFM which are; (i) overcoming long range capacitive coupling between the probe (e.g. cantilever, cone, tip apex) and sample surface and (ii) eliminating the influence of instrumentation in the measurement, in particular the feedback effect [24]. The former originates from the long range nature of the electrostatic force, which means that not only the tip apex, but also the cone and the cantilever beam strongly contribute to the measured CPD [28]. As a direct result, the CPD measured does not purely reflect the local CPD under the tip apex but is a weighted average over the entire probe and the sample surface, and as such is heavily tip–sample separation dependent [24]. Considering the long range nature of the interactions probed, combined with the known distance dependence in KPFM measurements [24], the lack of an established 3D-KPFM imaging approach [29] is somewhat surprising.
The feedback effect is a less well recognized problem in KPFM measurements, however, it has been shown to introduce systematic instrumentation dependent errors [24, 30, 31], as well as a long list of related artefacts including a dependence of the recorded CPD on drive amplitude Vac [8, 23, 24], tip–sample distance [25], and topographical crosstalk into the recorded CPD channel [26, 27]. This makes comparison between measurements, or comparison between measurement and theory difficult using conventional KPFM methods. Furthermore, an inherent distance dependence in closed loop KPFM, introduced by the feedback effect [8, 24], complicates its applicability to 3D measurements and is likely a large reason for the absence of such an approach to date. Recently, however, several open loop KPFM approaches have been demonstrated in ambient [12, 24, 32, 33], where 'open loop' refers to a system which does not require feedback control. Crucially, these approaches offer the potential to overcome feedback related artefacts [32], at the same time have shown success towards extending KPFM measurements to liquid environments [34, 35].
In this work open loop variants of KPFM techniques are developed as pathways to overcoming the existing limitations of conventional KPFM approaches. In particular we investigate the use of multifrequency open loop KPFM, using the band excitation (BE) approach [36–38], which we show to have several advantages over its single frequency counterparts [32]. First we demonstrate the capabilities of BE-KPFM for simultaneous measurement of electrostatic force and electrostatic force gradient interactions. BE-KPFM is shown to be successful in extracting information on both local (e.g. electrostatic force gradient detection) and non-local (e.g. electrostatic force detection) electrochemical parameters simultaneously. In this way BE-KPFM has similarities with combined frequency modulated (FM) and amplitude modulated (AM)-KPFM, respectively, while avoiding complications associated with closed loop bias feedback. Finally, we develop and implement force volume (FV) BE-KPFM, a three-dimensional open loop KPFM imaging approach, which provides the entire probe-sample interaction at each distance and spatial location across the sample surface.
2. Background
KPFM was developed to provide quantitative measurements of CPD between tip and sample and can be implemented in several ways. Many variants of KPFM techniques have evolved and are discussed in various book chapters or reviews [25, 38, 39]. The measurement can be made in lift mode where the topography is recorded in the first pass, and the KPFM measurement is performed in a second pass as the topography is retraced at a constant defined distance above the surface. Alternatively, the experiment can be performed simultaneously with surface topography acquisition using an electrical excitation at a frequency far from the mechanical excitation used for topographical feedback [40, 41]. KPFM can be operated in AM [41] or FM-KPFM [42–46] modes, which are sensitive to the electrostatic forces or force gradients, respectively. Common to all conventional KPFM techniques, however, is the application of a dc voltage, Vdc, superimposed on an ac voltage, Vac, applied to the tip such that, Vtip = [(Vdc − Vcpd) + Vacsin(ωt)], where Vcpd is the CPD between tip and sample.
2.1. AM-KPFM
In AM-KPFM the bias dependent response, is detected via the first harmonic electrostatic force of the cantilever, Fel(ω) = −C'z(Vdc − Vcpd)Vac, where C'z is the tip–sample capacitance gradient. The periodic electrostatic force produces cantilever oscillations, where the first harmonic amplitude response is given by; A(ω) = −C'z(Vdc − Vcpd)VacG(ω), which is proportional to the transfer function (G(ω)) of the cantilever itself. For this reason it is beneficial to perform KPFM measurements at the cantilever resonance frequency to achieve resonant amplification and hence improved signal to noise ratios. The amplitude response, A(ω), is minimized when the applied dc bias is equal to the CPD between tip and sample (i.e., when Vdc = Vcpd). Traditionally, lock-in amplifiers (LIAs) are employed to detect the amplitude (A(ω)) and phase (θ(ω)) response of the electrostatic force at the frequency of the applied bias, and the mixed response (A(ω)cos(θ(ω)) is used as the input to the feedback loop. For 'ideal' KPFM operation [8, 24], the dc bias output of the KPFM feedback loop can thus be used to construct a map of the CPD as the tip is scanned across the sample surface.
2.2. FM-KPFM
FM-KPFM is sensitive to the electrostatic force gradient (F'el), as opposed to electrostatic force as in AM-KPFM. The cantilever resonance frequency (ωr) shifts as a result of conservative interactions as described by; Δω ≈ ωr/2k(F'el), where k is the cantilever spring constant. The resultant frequency shifts (Δω), due to changes in the gradient of the static electrostatic force between tip and sample, are governed by; F'dc = C''z((Vdc–Vcpd)2 + ½Vac2), where C''z is the derivative of the capacitance gradient. FM-KPFM can be operated using a phase-locked loop (PLL) to determine the bias-induced frequency shift. Alternatively sideband detection can be implemented using two cascaded LIAs and requiring a low frequency electrical excitation applied to a mechanically excited tip [47]. Both approaches however require closed loop bias feedback where, in a fashion similar to AM-KPFM, the bias feedback is used to nullify Δω and hence determine the CPD.
2.3. AM-KPFM versus FM-KPFM
There are several advantages and disadvantages of both AM and FM modes of KPFM detection [47, 48] as summarized in table 1. A major drawback of AM-KPFM measurements originates from the long range nature of the electrostatic force, meaning not only the tip apex, but also the cone and the cantilever beam strongly contribute to the KPFM imaging mechanism [28]. FM-KPFM does obviate unspecific interactions to a large extent by virtue of the fact that it is sensitive to electrostatic force gradients. The electrostatic force gradient decays at much shorter distance than the electrostatic force, and hence shows much less influence from cone and cantilever to the overall CPD image. As a consequence higher lateral resolution is routinely achieved using FM-KPFM [47, 49, 50]. FM-KPFM, however, is known to demonstrate reduced bias sensitivity as compared to AM detection requiring excitation with relatively high ac bias (>2 V [47]) which is not suitable for some voltage sensitive materials [51]. In general FM-KPFM is less straight forward to implement than the AM-KPFM as it requires additional electronics and most commonly operated in single pass mode during non-contact imaging, which can be problematic for rough samples. Although possible, FM-KPFM is not as well suited to lift mode operation in comparison with AM-KPFM [50].
Table 1. Advantages and disadvantages of AM- and FM-KPFM.
| AM-KPFM | FM-KPFM | |
|---|---|---|
| Sensitive to: | Electrostatic force | Electrostatic force gradient |
| Potential sensitivity | Good potential sensitivity [47, 52] | Poor potential sensitivity [47, 52] |
| Application of small ac voltage required [52] | Application of high ac voltage required [52] | |
| Lateral resolution | Demonstrates a 1/z distance dependence [53] | Demonstrates a 1/z2 distance dependence [53] |
| Cantilever influences the electrostatic interaction and the achievable lateral resolution [53] | Cantilever electrostatic interaction is negligible and tip apex dominates the lateral resolution [53] | |
| Ease of implementation | Requires LIA plus a feedback loop | Requires PLL (or 2 LIAs) plus a feedback loop |
| Can operate in single pass or lift mode | More suitable to single pass |
3. Methods
3.1. Experiment and sample details
All measurements were performed using Pt/Ir-coated cantilevers (MicroMasch, DPE18) with nominal resonant frequencies and stiffnesses of 75 kHz and 2.8 nN. Experiments were performed using a Cypher AFM (Asylum Research). BE-KPFM and FVBE-KPFM was implemented using NI 5122 and 5412 cards (National Instruments) run by custom Matlab software (MathWorks). Excitation amplitude of 0.5 V with a center frequency at the resonance frequency (65–80 kHz) and bandwidth of 8–20 kHz having between 38–96 bins per band was applied to the tip. Test structures were fabricated by evaporating Au (100 nm) and Pt (20 nm) electrodes deposited on a SiOx surface, forming a cross pattern of 20 × 20 μm dimensions (figures 2 and 3). The test structure in figure 5 was formed by evaporation of a circular Au (100 nm) electrode on a SiOx coated Si surface. Conductive silver paint (Agar Scientific Ltd) was used to attach the samples to metal discs, which were used to ground the sample surface.
3.2. Open loop BE-KPFM
In this work we use open loop BE-KPFM [32], referred to here as simply BE-KPFM, in which the first harmonic frequency-dependent response is probed using a train of BE pulses with varying dc voltage offset, as shown in figure 1(a). Contrary to single frequency techniques, in BE an excitation waveform with amplitude, Vac, is applied in a frequency band with a central frequency at a cantilever resonant frequency, ω0. The full cantilever response (versus bias) can then be detected using high speed data acquisition methods. In BE-KPFM the full amplitude and phase response as a function of frequency and bias is acquired at each XY spatial location. Figures 1(b) and (c) show the amplitude response versus frequency and bias for a single point measurement collected 10 nm above a freshly cleaved high ordered pyrolytic graphite (HOPG) surface. This 2D response contains information both on the electrostatic tip–surface interactions and cantilever transfer function in the vicinity of the resonance.
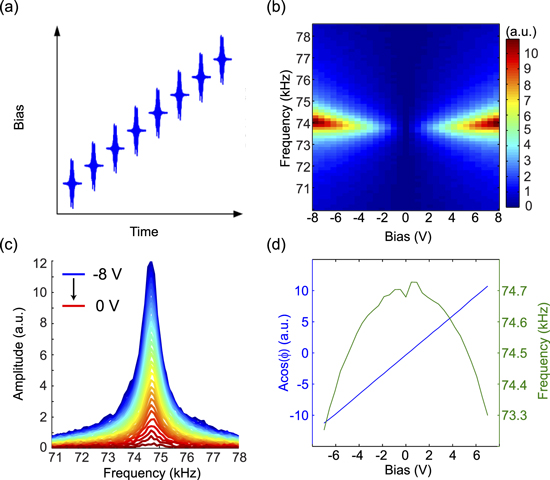
Figure 1. Operating principle of BE-KPFM. (a) A train of band excitation waveforms superimposed on a linear voltage ramp is applied to the tip. (b) Cantilever response amplitude versus bias and frequency is acquired at each location. (c) Cantilever response amplitude versus frequency for negative bias values. (d) Bias dependence of cantilever mixed amplitude response (left: y axis) and resonant frequency (right: y axis).
Download figure:
Standard image High-resolution image3.3. FVBE-KPFM
In FVBE-KPFM rather than raster scanning in the plane of the surface as with conventional scanning probe techniques, a fine grid of points is specified on the surface and the tip is gently approached toward the surface at each point. Tip positioning is controlled by custom software written in Igor Pro (Wavemetrics), where, at each pixel on the grid, the tip is brought into contact with the sample, afterwards the tip is retracted to the largest user defined tip–sample distance and stepped linearly towards the surface in a closed loop manner while electrically excited with a waveform comprised of a train of BE waveforms superimposed on a linear voltage ramp. In this manner a 5D data set comprising amplitude (and phase) response versus frequency, bias, and position (X, Y, Z) is acquired.
3.4. Quantitative data analysis of BE-KPFM measurements
The raw BE-KPFM data, figures 1(b) and (c), can be well approximated by a simple harmonic oscillator (SHO) model [36, 37]. For extracting quantitative properties from BE-KPFM measurements, the response at each bias is fitted to the SHO model used to describe a resonance frequency spectrum, which has amplitude/phase forms as:
where ω0 is the resonance frequency and Q is the quality factor; Adrive and φdrive are the amplitude and phase, respectively, of the driving force. The BE approach allows accurate decoupling of these SHO parameters since the cantilever response spectra is recorded across a band of frequencies. The SHO fitting step reduces the 4D BE-KPFM (5D FVBE-KPFM) array to a vector 3D (4D) dataset of {Ar, ωr, Qr, φr}{x, y, (z), Vdc} yielding the amplitude and phase of response at the resonance, ω0 and Q as a function of bias. The electronic properties of the sample can be determined at each spatial location from the bias dependence of the SHO fit parameters corresponding to the electrostatic force (i.e. amplitude response) and force gradient (i.e. frequency response) interactions. Figure 1(d) shows the corresponding bias dependence of mixed response, and ω0, obtained from SHO fitting. For the electrostatic force equations, for purely capacitive interactions, the tip–surface capacitance gradient and CPD can be determined from the bias dependence of the mixed response. The CPD is found from the nulling potential (or zero amplitude crossing) and the C'z is proportional to the slope of the linear fitting. Hence, if the experimentally measured bias dependence is linear, as is the case for figure 1(d), the tip–surface capacitance gradient and CPD can be determined. This linear fit thus reduces the 4D (5D FBVE-KPFM) BE-KPFM dataset into two 2D (3D) maps containing information on tip–surface capacitance and CPD, respectively. In terms of the electrostatic force gradient the frequency shift is parabolic as a function of bias for a purely capacitive system. In this case, parabolic fitting of the bias dependence of the frequency shift can be used to find the CPD from the point of inflection of the parabola (i.e. F'dc = 0; Vdc = Vcpd) and the derivative of the capacitance gradient (C''z) can be inferred from the parabolic fitting parameters. In this way, BE-KPFM allows simultaneous measurement of local (i.e. force gradient, FM-KPFM) and non-local (i.e. force, AM-KPFM) response. Importantly, the ability to determine the validity of the bias dependence of the (electrostatic force and force gradient) response in BE-KPFM represents a significant advantage over its closed loop counterpart, while also providing valuable information on the dielectric properties of the sample under test which can be used for surface [54, 55] or subsurface [56, 57] mapping of dielectric properties. Noteworthy, at values close to the nulling bias (i.e. when the bias value approaches the CPD between tip and sample) the frequency shift can deviate from a parabolic trend as a direct result of difficulty in accurately SHO fitting small response amplitudes. For this reason, points close to the CPD values were not used in parabolic fitting to avoid influencing the quality of fit. In future, this complication can be avoided by adopting excitation mechanisms which are insensitive to the surface bias but still provide clean response, such as has recently been demonstrated using photothermal excitation [58, 59].
4. Simultaneous force and force gradient KPFM
In this section we implement BE-KPFM [32] on a model sample, shown in figure 2(a), formed by Au (100 nm) and Pt (20 nm) electrodes deposited on a SiOx surface. Such test structures are useful for examining KPFM operation as they contain topographic (cross edge), work function (Au versus Pt), and dielectric constant variation. Figure 2(a) is a 3D representation of the surface topography, where the red star indicates the location of the point spectroscopy measurement and, in figures 2(b) and (c), we make comparison between the bias dependence of the electrostatic force and force gradient detection collected 10 nm above the gold electrode. From figure 2(b) it can be seen that the electrostatic force results in a linear bias dependence of the amplitude response with a minima at Vdc corresponding the CPD. A phase inversion of 180° is observed when the response passes through the CPD indicating a reversal of the charge polarity between tip and sample (not shown). From this data, the CPD can be determined as the bias value that nullifies the amplitude response, in this case, found by performing a linear fit to the mixed response as shown.
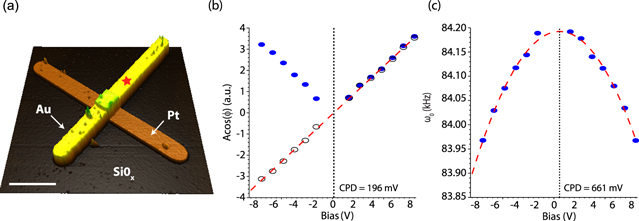
Figure 2. Comparison of CPD determined by electrostatic force and force gradient detection with BE-KPFM. (a) 3D topography image of a test structure containing Pt and Au strips deposited on a Si wafer (Z scale = 150 nm, scale bar 5 μm) (b) resonance amplitude (full circles) (mixed response (opaque circles)) and (c) resonance frequency response versus bias. The CPD values determined using both electrostatic force (196 mV) and force gradient (661 mV) detection are indicated using dashed black lines respectively.
Download figure:
Standard image High-resolution imageFurthermore, the BE-KPFM approach affords the bias dependence of the electrostatic force gradient which results in a parabolic bias dependence of the resonance frequency, having a maximum close to the minima in the amplitude response. The bias at which the maximum of the parabola is located yields the local CPD and the derivative of the capacitance gradient can be determined from the derivative of the slope. From figures 2(b) and (c) it was found that the CPD measured by force detection was 196 ± 9 mV compared to 661 ± 14 mV by force gradient detection. Since both measurements are made simultaneously, using the same instrumentation and the same signal pathways, we can conclude that the difference of ∼465 mV corresponds to the stray capacitance effect and non-local electrostatic interactions.
In figure 3, BE-KPFM imaging is illustrated where linear and parabolic fitting of the electrostatic force and force gradient at each point reduces the BE-KPFM dataset into four 2D maps containing information on tip–surface capacitance and CPD, determined independently using force (figures 3(a) and (b)) and force gradient (figures 3(c) and (d)) detection. The average CPD between Pt and Au electrodes was determined to be 306 ± 56 mV using force gradient detection and 136 ± 32 mV using force detection. This large difference can be explained by lateral averaging of the CPD in force detection due to the long range interaction between the AFM cone and cantilever with the sample test structure [49, 53]. This effect is less pronounced in the force gradient response since the interaction decays faster than the force, hence why FM-KPFM shows no influence from the cone and the cantilever [53]. The frequency shift can additionally be used to map the second derivative of the capacitance, figure 3(d), which results in a high resolution material contrast of dielectric sample properties [59]. Figure 3(e) shows cross sections of the CPD in both force and force gradient detection. As a consequence of the short decay length of electrostatic force gradient, a higher lateral resolution can be achieved and the local CPD can be measured directly without the need of de-convolution techniques [59, 60].
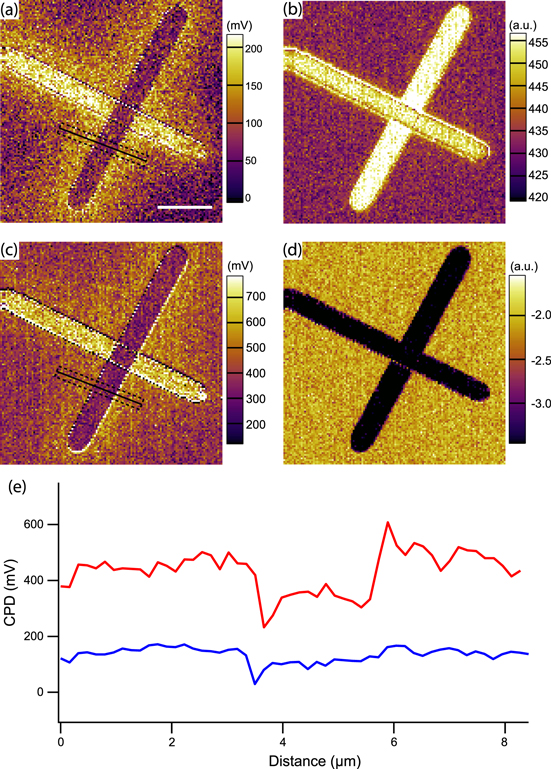
Figure 3. Combined electrostatic force and force gradient detection using BE-KPFM. (a) and (b) CPD and capacitance gradient determined by electrostatic force detection (scale bar = 5 μm). (c) and (d) CPD and second derivative of the capacitance gradient determined electrostatic force gradient detection. Averaged cross section of the CPD in both (a) and (c) determined from the region indicated with the black lines (force detection-red) (force gradient detection-blue). Data collected at a lift height of 10 nm. Image size 128 × 128 pixels.
Download figure:
Standard image High-resolution image5. Distance dependence in BE-KPFM
In figure 4 we compare the distance dependence in a single point BE-KPFM with a standard AM-KPFM measurement over a freshly cleaved HOPG sample. For a metal tip–sample configuration with a uniform sample work function one would not expect variation in the measured CPD with changing tip–sample distance. BE-KPFM SHO fit parameters are shown as a function of bias, figures 4(a) and (b), and distance, figures 4(c) and (d). The electrostatic force, figures 4(a) and (c), demonstrate a linear bias dependence for all tip–sample distances investigated, with slight deviations from linearity evident at small distances and large applied bias due to static deflections of the tip. It is clear that the slope of the bias dependence, figure 4(a), changes as a function of distance providing a measure of the increase in the capacitance gradient with decreasing tip–sample distance. The capacitance gradient can also be determined from the distance profile of the BE-KPFM for a single bias value other than the nulling potential, see figure 4(c). On the contrary, the electrostatic force gradient, figures 4(b) and (d), the response shows a strong parabolic bias dependence for small tip–sample distances (<50 nm), which becomes much less pronounced with increasing tip–sample distance. Furthermore, the distance profile of the electrostatic force gradient, see figure 4(d), is much shorter range than figure 4(c), as it is sensitive to the derivative of the capacitance gradient.

Figure 4. Distance dependence in BE-KPFM. Bias dependence of the (a) amplitude and (b) frequency response as a function of distance from the surface. Orthogonal representation of the (c) amplitude and (d) frequency bias and distance dependence. (e) Distance dependence of the CPD determined by BE-KPFM using electrostatic force (red triangles), force gradient (black circles) detection and standard AM-KPFM (blue triangles) imaging. (f) Comparison between the distance dependence of the AM-KPFM CPD measurement with the strongly coupled inverse capacitance gradient effect.
Download figure:
Standard image High-resolution imageIn figure 4(e) we compare CPD measurements determined using BE-KPFM (electrostatic force and force gradient detection) and standard AM-KPFM as a function of distance at the same location on a freshly cleaved HOPG sample, demonstrating uniform work function over at least at 20 μm area (confirmed by AM-KPFM, not shown). The BE-KPFM data in figure 4(e) again demonstrates a large deviation in CPD between measurements determined by electrostatic force and force gradient detection. The CPD values determined from the bias dependence of the electrostatic force gradient demonstrates a large spread in CPD values (∼200 mV) at large tip–sample distance (>50 nm) due to the lower bias sensitivity of the approach. Note this result explains the difficulties in implementing FM-KPFM in lift mode due to the requirement for very small tip–sample separation [50], and hence why FM-KPFM is more usually operated during non-contact FM-AFM imaging. On the other hand, CPD values determined from the bias dependence of the electrostatic force demonstrate a small spread in CPD values, however, a decreasing CPD with tip–sample distance (∼65 mV) is observed, which is not expected for a uniform metal sample. This can potentially be related to contamination/damage of the metal coating of the tip which have not been fully characterized. Finally, we overlaid data collected using conventional closed loop AM-KPFM at the same location. The deviation in the CPD with decreasing tip–sample distance was found to be approximately double (∼110 mV) that observed using BE-KPFM electrostatic force detection. For non-ideal KPFM feedback (i.e. when the feedback is incorrectly optimized or when parasitic signals reach the input to the bias feedback loop), the tip response is not completely nullified and will have a finite amplitude (δ), hence the applied Vdc ≠ Vcpd but governed by:

In figure 4(f) the CPD determined using AM-KPFM is overlaid with the inverse capacitance gradient term in equation (2). The measured CPD demonstrates the expected trend described for non-ideal feedback and is proportional to the inverse capacitance gradient. This complication of closed loop KPFM limits its application to 3D-KPFM imaging modes without the adoption of additional correction procedures [61, 62]. Note that open loop KPFM modes, and all electrical AFM measurements in general, can suffer from crosstalk if electronic offsets are not calibrated correctly or signal pathways are not sufficiently shielded from each other [31]. However, since BE-KPFM detects the entire bias dependence, any parasitic contributions can be more easily detected and calibrated for than in closed loop operation.
6. FVBE-KPFM
The distance dependence of the tip–sample electrostatic interactions has motivated the development of a 3D open loop KPFM technique to capture not only the spatial variation in the X–Y plane, but also as a function of tip–sample distance. Figure 5 shows the result of a FVBE-KPFM measurement of a simple gold electrode test structure deposited on SiOx. Figure 5(a) shows a simple schematic of the FVBE-KPFM measurement and sample topography, where rather than raster scanning in the plane of the surface, as with conventional scanning probe techniques, the electrostatic interactions are recorded as function of tip–sample distance across a fine grid (X, Y, Z; 30 × 30 × 50) of points on the surface. The fitting parameters can be used to determine the 3D CPD and capacitance gradient determined using the electrostatic force and force gradient respectively, providing a wealth of information on the tip–sample interactions. Figures 5(b) and (c) show CPD measurements collected using standard AM-KPFM and FVBE-KPFM both at 50 nm from the sample surface. Again, a significant deviation from the CPD values determined from open and closed loop operation even at the same tip–sample distance is observed, as was previously been reported [24]. A significant advantage of FVBE-KPFM, is that unlike standard KPFM, information on the capacitance gradient can also be determined (see figure 5(e)), as well as the distance dependence of the CPD and capacitance gradient for each spatial location or across a section of the sample surface as shown in figures 5(d) and (f). The data acquisition for the FVBE-KPFM image shown in figure 5 took approximately 8 times longer to collect that a standard conventional 2D KPFM image (∼25 mins), however we note that this technique affords a significant increase in the channels of information obtainable over conventional KPFM. Furthermore, in most instances, a single 2D BE-KPFM image combined with a high density 3D FVBE-KPFM line scan will be sufficient to deconvolute the long range tip-sample interactions across the entire image. In this case we only show the results determined from the electrostatic force, however, similar information can be obtained from the electrostatic force gradient.

Figure 5. 3D CPD mapping with force volume band excitation-KPFM. (a) Schematic of the FVBE-KPFM measurement. (b) AM-KPFM image and (c) electrostatic force detection FVBE-KPFM collected at 50 nm from tip–sample separation. (d) FVBE-KPFM cross sectional CPD data from region indicated with black dashed line in (c). (e) Spatial map (x, y, height = 50 nm) of capacitance gradient and (f) capacitance gradient as function of distance from location indicated with dashed black line in (c).
Download figure:
Standard image High-resolution image
7. Summary
We have developed a quantitative 3D-KPFM imaging approach based on the BE method. It was shown that CPD and capacitance gradient information can be obtained from the bias dependence of the electrostatic force and force gradient, respectively. Comparative measurements were performed at fixed height above the surface to demonstrate the force gradient detection provided higher spatial resolution than the electrostatic force detection when operated close to the sample surface (<50 nm). KPFM measurements performed using BE-KPFM are shown to be less distant dependent than conventional AM-KPFM measurements, likely a result of eliminating the requirement for bias feedback which was shown to introduce artefacts into the measured CPD. FVBE-KPFM is expected to offer a useful bridge between KPFM experiment and modeling ultimately leading to a complete de-convolution of the effect of the probe geometry in KPFM measurements.
Acknowledgments
This publication has emanated from research conducted at the Center for Nanophase Materials Sciences, which is sponsored at Oak Ridge National Laboratory by the Scientific User Facilities Division, Office of Basic Energy Sciences, US Department of Energy (CNMS2012-036). LC gratefully acknowledges financial support from UCD Research.