


Abstract
A primary temperature scale requires realising a unit in terms of its definition. For high temperature radiation thermometry in terms of the International Temperature Scale of 1990 this means extrapolating from the signal measured at the freezing temperature of gold, silver or copper using Planck's radiation law. The difficulty in doing this means that primary scales above 1000 °C require specialist equipment and careful characterisation in order to achieve the extrapolation with sufficient accuracy. As such, maintenance of the scale at high temperatures is usually only practicable for National Metrology Institutes, and calibration laboratories have to rely on a scale calibrated against transfer standards. At lower temperatures it is practicable for an industrial calibration laboratory to have its own primary temperature scale, which reduces the number of steps between the primary scale and end user. Proposed changes to the SI that will introduce internationally accepted high temperature reference standards might make it practicable to have a primary high temperature scale in a calibration laboratory. In this study such a scale was established by calibrating radiation thermometers directly to high temperature reference standards. The possible reduction in uncertainty to an end user as a result of the reduced calibration chain was evaluated.
Export citation and abstract BibTeX RIS

Original content from this work may be used under the terms of the Creative Commons Attribution 3.0 licence. Any further distribution of this work must maintain attribution to the author(s) and the title of the work, journal citation and DOI.
1. Introduction
Many diverse industrial processes involve temperature measurement above 1000 °C [1–3]. Improvement to metrology in this area could lead to reduced energy usage, and tighter process control could lead to more consistent product quality. At high temperatures radiation thermometers for non-contact measurement are commonly used. Traceable temperature measurement starts with a primary realisation of the International Temperature Scale of 1990 (ITS-90) [4]. In the high temperature regime this is based on extrapolation from a reference of the freezing temperature of silver, gold or copper. At temperatures below the freezing temperature of silver (961.78 °C) it is realistic for an industrial calibration laboratory to have a primary temperature scale realisation, that is, a temperature scale based on the specified methodology given in the text of the ITS-90 [5]. At higher temperatures it is impractical for all but National Measurement Institutes (NMI) to maintain a full ITS-90 temperature scale and so have the lowest achievable uncertainties. There is typically a sequence of calibration steps from NMI to industrial calibration laboratory to industrial end user. In some countries, for example, the UK, practicalities dictate that commercial radiation thermometers are at least four and more usually six steps removed from the basic temperature scale definition. Each time the scale is transferred in this way, measurement uncertainty increases.
Proposed changes to the SI and the mise en pratique for the definition of the kelvin (MeP-K) [6] may soon make it practicable for industrial calibration laboratories to have their own primary realisation of an internationally agreed thermodynamic scale. A series of high temperature fixed points (HTFP) [7] of specified temperatures and uncertainties will allow an interpolated scale from the silver point up to at least 2500 °C. A set of fixed point cells and a radiation thermometer, as the interpolation device, will be sufficient for maintaining the scale. However, end users of radiation thermometers will only benefit from the changes if the industrial calibration laboratory primary standard thermometers are of an appropriate design that balances the calibration uncertainty budgets correctly. In this study, we examine the effects upon measurement uncertainty of transferring the fundamental temperature scale realised at the industrial calibration laboratory to the end user using different radiation thermometers.
HTFP of cobalt–carbon, platinum–carbon and rhenium–carbon were used in a high temperature furnace to provide a series of calibration points. These were used to calibrate firstly a reference-standard industrial radiation thermometer specifically designed for use in Land Instruments International Ltd's commercial calibration laboratory and then the same type of instrument modified to give a narrower spectral response and improved stability. Finally, a radiation thermometer specifically designed to be calibrated using HTFPs was calibrated. The effect of instrument choice and the number and type of fixed points used on the calibration chain could then be evaluated.
2. Experimental
The measurements were carried out using the facilities [8] of the calibration laboratory at Land Instruments International Ltd (LAND). They were the UK's first industrial ISO 17025 UKAS accredited laboratory for thermal measurements and it is an example of a laboratory that maintains its own ITS-90 scale below the silver point and currently relies upon the UK's NMI (National Physical Laboratory, NPL) for traceability above it. LAND has issued over 21 000 calibration certificates in the laboratory's 45 years of operation and they design their own standard radiation thermometers that are not made available to the market and are designed solely for the purpose of providing minimum measurement uncertainty in their calibration laboratory. These factors combined enable LAND to report particularly small uncertainties for an industrial laboratory, not only to its end users, but in support of LAND's wider manufacturing facility. In our study, NPL supplied the fixed points, the furnace tubes and the insulation used to optimise thermal conditions in the furnace. NPL, LAND and University of Sheffield (UoS) each supplied a radiation thermometer; denoted absolute Thermometer kelvin, ATK (NPL), S1-LII (Land), S1-UoS (Modified) respectively. The two S1 thermometers were identical except for the modifications deemed necessary in order to demonstrate the benefits of the new MeP-K temperature scale realisation.
Measurements were made over three days, with each day devoted to either rhenium–carbon, platinum–carbon or cobalt–carbon, and the two S1 instruments, manufactured by LAND, were measured at the three fixed points. The ATK radiation thermometer relied on measurements of HTFPs made previously at NPL.
The three radiation thermometers were then compared directly to each other at NPL, and indirectly to the NPL primary scale via the ATK.
Finally, the thermometers were used to assign a temperature, with uncertainty, to a furnace operating at the UoS, in order to demonstrate the benefits of the MeP-K to end users of radiation thermometers.
2.1. Fixed point cells
The fixed point cells were graphite crucibles, 24 mm in diameter, 40 mm long and had a 3 mm diameter blackbody cavity enclosed in an ingot of metal–carbon alloy at the eutectic composition, with a volume of about 3 cm3. The melting temperature values used were those specified in [10]. NPL had recently been involved in this project to assign thermodynamic temperatures to fixed points and so was in a position to judge the agreement between the cells used in the fixed point temperature assignment and this work. The Pt–C and Co–C cells were equivalent to those on which the published data is available. The Re–C cell used here was specially designed for extreme robustness and was able to survive temperature changes of hundreds of degrees Celsius per minute [9]; however, the cell has comparatively thick walls, and consequently a low emissivity and larger temperature drop across the cavity wall. The influence of these features was found to cause the radiance temperature to be 0.3 °C lower than the conventional design. This difference was applied as a correction to the published value. The values used were 2474.38 ± 0.35 °C for rhenium–carbon, 1738.28 ± 0.18 °C for platinum–carbon and 1324.24 ± 0.13 °C for cobalt–carbon.
Different fixed-point cells were used for the ATK and for the two S1 based devices. Allowance was made for non-reproducibility between cells in the uncertainty budget, the dominant contributions were the result of impurities and differences in thermal conditions between furnaces.
The fixed-point cells were pre-set up at NPL in furnace tubes with suitable insulation. This was to simplify the measurement process, rather than any difficulty in setting up at the LAND laboratory, and such insulation is routinely supplied with HTFP purchased from NPL. Installation was then simply a matter of removing the furnace calibration tube and replacing with the appropriate fixed-point cell assembly, with parts shown in figure 1.
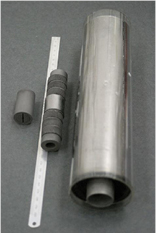
Figure 1. Fixed point assembly consists of a graphite work-tube that doubles as the heater element and is wrapped in graphite felt and a silica tube. The fixed point itself is wrapped in graphite foil and has discs of graphite felt as insulation. The rhenium cell is smaller at 25 mm long, the others are 40 mm, and one of these is shown alongside.
Download figure:
Standard image High-resolution image2.2. Furnace
The calibration laboratory at LAND uses a Thermogauge [11] 25.4 mm dual blackbody calibration source. It operates with an argon purge so does not need any window to protect/seal the graphite within an inert atmosphere. The radiation thermometer is aligned on the fixed point cell cavity by eye and/or by scanning to identify the radiance profile when hot. The fixed point assemblies were heated and cooled at approximately 15–20 °C min−1
2.3. Radiation thermometers
LAND's S1 are high quality radiation thermometers, based on standard products [12], and specifically designed as working standards for calibrating other thermometers within the production environment. Their traceability is through NPL, though, as previously described, they are two calibration steps removed from ITS-90. Two radiation thermometers from the S1 range, S1-LII and S1-UoS were developed specifically for use with HTFPs in a LAND-NPL collaborative project around fifteen years ago [13]. The calibration history of these instruments has since been tracked and it was found that the design is remarkably stable, with no significant drift in calibration over the intervening years. Prior to modification of S1-UoS, these two S1 instruments were identical and, therefore, provided an excellent testbed for our study.
2.3.1. Unmodified S1-LII.
The S1-LII was unmodified since its original manufacture. It had a spectral response defined by an RG850 filter and the detection limit of the silicon photodiode detector. The size of the semiconductor bandgap of silicon is inherently temperature dependent, which means the output was substantially affected by changes in the internal temperature of the instrument. It was not temperature stabilised but relied on characterisation of the signal drift with temperature, followed by numerical ambient temperature correction. The major contribution of this drift comes from the long wavelength edge of the detector responsivity spectrum. This could have been removed optically, however, the design gave this instrument high optical throughput compared to the narrow-filter NMI thermometers and excellent signal to noise ratio at low temperatures.
2.3.2. Modified S1-UoS.
The S1-UoS was modified in two ways. Firstly, the RG850 filter was replaced with an interference filter [14]. A 25 mm diameter filter nominally 809 nm centre wavelength and 81 nm bandpass was used. This was trepanned to give a 6.5 mm diameter filter to fit the S1 filter mount. Almost all the changes in the detector photocurrent as a function of ambient temperature were as a result of the sensitivity to long wavelengths changing. The interference filter stabilised the photocurrent by removing these wavelengths from the measurement. A relatively narrow spectral filter was used such that the thermometer could now be considered pseudo-monochromatic. The spectral response of an interference filter changes with its temperature and so the second modification was that the detector housing assembly, which holds the filter, was wrapped in resistance wire and a proportional–integral–derivative controller (PID) was used to stabilise the metal housing temperature, with a thermistor mounted within the assembly as a control sensor.
2.3.3. ATK.
The third radiation thermometer used in this study was designed at NPL and its design details are described elsewhere [15]. The instrument was designed to simplify establishing a low uncertainty scale. The optics gave small target size and it had a fairly complicated optical assembly that provided good size-of-source response. The detector and amplifier were specifically chosen for linearity and stability. The coloured glass filter with a centre wavelength of 715 nm and fwhm of 76 nm was chosen to be sufficiently narrow band spectral response to give minimum deviation from the Planck response, while also being stable and having low temperature coefficient. An interference filter could have been specified if required. The optical and electronic components were temperature stabilised using resistive heater pads and the mechanical structure had matched thermal expansions to keep a constant optical geometry, regardless of environmental conditions. It was intended to be calibrated with HTFPs and then used as a low uncertainty reference standard thermometer.
2.4. Temperature scale
General purpose radiation thermometers have a wide spectral response, required in order to achieve good signal to noise ratios at low temperature. The temperature scale that they carry is through transfer-standards with very narrow responses, which follow Planck's Law with lower uncertainty. This is presently how a primary scale at an NMI is transferred to calibration laboratories.
To set up what will be classed a primary scale for this study after calibration at the fixed points, the results were fitted to an interpolation function based on Planck's law, the Sakuma–Hattori equation [15]
There are three adjustable parameters (A, B, C) and c2 is the second radiation constant in Planck's law, which has a value of 0.014388 mK. With three fixed point measurements the fitting is exact. To reduce the number of fixed points required, one of the parameters can be calculated. It has been shown [16] that the B parameter, which is related to the width of the bandpass spectral response, has only a weak effect upon Sint. A reasonable value for B can, therefore, be calculated if the spectral response is not too wide. The parameter A is near the central wavelength of the spectral response and the calculated temperature for a given signal is very sensitive to small changes in its value, so again the calculated value cannot be used without extensive further characterisation. Parameter B, however is relatively insensitive: for a narrow interference filter a simple 'by-eye' evaluation of the filter spectral response curve can be sufficient to estimate B with insignificant error [17].
The spectral response passband of the filter was close to rectangular, as shown in figure 2. Knowledge of this, together with the manufacturer's data sheet, giving the FWHM a nominal value of 88.4 nm, allows the following calculation for this shape of filter [16]

and from the result, parameter B can be approximated as

with c2 = hc/k = 0.014388 with h, c and k the Planck constant, speed of light and the Boltzmann constant respectively and λ0 the centre wavelength of the filter at nominally 809 nm. The calculated value for this parameter can therefore be inserted directly into (1), meaning that two fixed points would be sufficient for a complete calibration according to the MeP-K. Such generic information is generally available from manufacturers, but is inadequate for an ITS-90 scale realisation where uncertainty in spectral response is often the biggest source of uncertainty in the temperature scale.
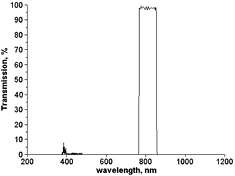
Figure 2. Plot of the spectral transmission data supplied by the manufacturer of the Semrock 809/81 nm Brightline filter.
Download figure:
Standard image High-resolution image2.5. Uncertainty budgets
The uncertainties propagate in a fairly complex manner, and at each temperature there is a contribution from both uncertainty in the reference points' temperatures and from the signals from the instrument. Fortunately, the propagation equations for any number of fixed points are known [18]. For the case of three fixed-points the equations become
with the indices l, m, n referring to the three fixed points The uncertainty at any temperature uT due to uncertainty in the fixed point temperature (uTl,m,n) and uncertainty in the measured signal at that fixed point (usl,m,n) is given by
The fixed-point temperature uncertainty is intrinsic to the fixed point cell itself. It contains components for the knowledge of the pure ingot melting temperature [8], effect of impurities, temperature drop across the fixed point cell cavity wall, the identification of the point at which the fixed point is judged to be at the melting temperature and an allowance for the intrinsic repeatability of the transition [19]. Allowance was also made for possible variation due to different thermal conditions in different furnaces and complications arising from the very fine alloy microstructure with consequent large interfacial energy effects.
Equation (2) therefore gives the uncertainty in the calibration of the instrument. The combination of the propagated uncertainties from the calibration points is then combined with uncertainties associated with the actual use of the instrument: the effect of ambient conditions, size-of-source-effect, current to voltage conversion, stability and non-linearity. This uncertainty is intrinsic to the instrument in a given measurement situation, here it is the calibration comparison conditions at NPL. Using the Wien approximation gives

This leads to an additional component

which is added in quadrature to the other terms in (2).
2.6. Scale comparison
When the fixed point measurements were evaluated equation (1) was fitted to the results and the uncertainty budgets were calculated using equation (2). The values used for temperature for the fixed-point cells were the best available thermodynamic melting temperatures. Each thermometer therefore carried what will be, once the expected changes to the MeP-K are incorporated, a primary thermodynamic scale. The three thermometers were compared at NPL from 1000 °C to 2600 °C using a Thermogauge dual blackbody similar to that at used at LAND. In addition, the ATK instrument was compared to the main NPL primary ITS-90 realisation [20]. The scales were compared at the UoS under conditions that would be found in an end-user laboratory; as opposed to the particular conditions of the dedicated and accredited radiation thermometry labs of LAND and NPL. This was, in essence, a robustness test of the S1-UoS instrument's ability to transfer the scale to the end user. Its field of view was translated laterally and longitudinally on a Land Instruments R1200B approximate blackbody furnace [8].
The temperature measurement by all radiation thermometers is affected by the size of the object that they measure. This is due to various issues with the quality of the optical system and is impossible to eliminate entirely. The size-of-source-effect for the S1-UoS was carefully measured using a 140 mm diameter integrating sphere, with a 125 W tungsten halogen lamp and a 50 mm aperture. At the aperture was fixed a 10 mm thick Perspex plate; with a 3 mm diameter, 2.6 mm deep plastic approximate blackbody set into its centre. The thermometer was arranged such that its field of view was entirely filled by the blackbody. Were there to be no sensitivity to radiation outside the thermometer field of view, no signal would be measured and there would be no size-of-source-effect. In practice, radiation is measured from outside the field of view and it can be quantified as a function of source-size by in-turn placing a series of apertures in front of the Perspex plate, in order to simulate an increased source-size.
Tolerance to changes in ambient temperature were measurement by blowing warm air into the S1-UoS through a small hole in its chassis, whilst monitoring an internal thermocouple.
2.7. Validation of LAND primary scale
With their own primary scale LAND would be in a position to supply an instrument directly calibrated to it, which would be expected to offer very low uncertainties. In order to demonstrate the benefits to end users, measurements were made at the UoS with all three instruments measuring the temperature of a three-zone furnace.
3. Results
3.1. Calibration
Typical melt and freeze cycles are shown in figure 3. It can be seen that the output of S1-LII increases as it is heated by the thermal energy radiated from the fixed-point cell at approximately 2500 °C. This is corrected for using the measured instrument internal temperature.

Figure 3. Rhenium–carbon melt and freeze cycles measured with S1-LII, The fixed point is heated and cooled to cycle through the eutectic transition, here at 5.65 volts.
Download figure:
Standard image High-resolution imageThe calibration results at the three fixed points of cobalt–carbon, platinum–carbon and rhenium–carbon are the input to equation (2) together with the in-use uncertainties determined from the instrument characterisation. The overall uncertainty is shown in figure 4. This is the uncertainty that would arise from the instrument in assigning a temperature to, for example, a calibration blackbody source. A previous comparison between HTFPs and a traditional calibration was previous undertaken [21]. With all the measurement uncertainties evaluated and combined, we find that the ATK, which was specifically designed for low uncertainty under a study of this methodology, was the more accurate.
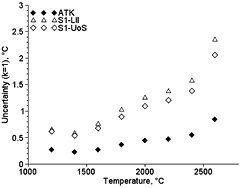
Figure 4. Total uncertainty for the three instruments comprising the calibration and in-use components. This is the uncertainty that would be assigned to a measurement as resulting from the instrument.
Download figure:
Standard image High-resolution imageThe high volume production instrument most similar to the S1 [12] has a measurement uncertainty guaranteed to be lower than 10 °C (0.7% K) k = 2 whilst measuring a target of 1150 °C. As shown in figure 4, the HTFP calibration methodology improves the measurement uncertainty by a factor of five over this value for commercial thermometers. Whilst the improvement was huge, it should be noted that the datasheet value is the worst case that is expected from a production batch of instruments, where a simplified calibration procedure is used and no attempt is made to account of individual thermometer uncertainties. This approach makes it possible to manufacture thermometers in volume; it is too time consuming to calibrate high volume production instruments using HTFPs. End users can pay for an additional service to have the true uncertainties evaluated for their instrument.
A small improvement to measurement uncertainty was achieved by the modifications to the S1. These were in part due to the improved temperature stability of the S1-UoS and also due to the shorter effective wavelength at which the modified instrument measured temperature.
3.2. Comparison
In the second part of the experiment, the thermometers were each taken to NPL in order to compare them with NPL's primary ITS-90 scale. This was carried out using the standard procedures and equipment that would be used for any calibration above 1000 °C up to a maximum of 3000 °C. A calibrated standard is used to assign a temperature to a blackbody calibration source. The uniformity is assessed and accounted for in the uncertainty budget with respect to differences in the viewed areas of the different instruments. The emissivity of the source (>0.995) is accounted for based on differences in wavelength between the instruments. The comparison results are shown in figure 5. It is clear that the three instrument agree within their uncertainties. It is expected that tables of differences between ITS-90 and thermodynamic temperature will be published as part of the mise-en-pratique of the definition, but in this case the differences are small compared to the uncertainties and the scales are functionally equivalent.
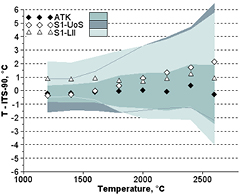
Figure 5. Comparison of the three primary scales to the ITS-90 primary scale at NPL. Shaded areas indicate the comparison uncertainty for each instrument at k = 2.
Download figure:
Standard image High-resolution image3.3. Validation
In order to investigate potential advantages of the MeP-K for end users, we assessed the temperature of an approximate blackbody calibration furnace at the UoS. The furnace controller measured the temperatures of internal thermocouples and the measurements were not necessarily representative of the radiance temperature that the radiation thermometers measured.
The furnace was set to 1150 °C for the data presented in figure 6. A fourth measurement is also plotted and this was measured by LAND's commercial solution for laboratory calibration, a UKAS certified C100 [22]. The uncertainty plotted for the C100 in figure 6 was measured in LAND's calibration lab during the certification process. These results demonstrate measurements from a primary scale with reasonable accuracy. There was not time to fully investigate source uniformity and stability, but the difference between the two S1 based instruments is similar to that observed in the scale comparison. The excellent performance of the S1-LII demonstrates the potential for improved uncertainties compared to the commercial version of the S1, with its quoted uncertainty of 10 °C and it also compares well with the C100 that LAND supplies as a standard thermometer to their customer's calibration labs.

Figure 6. Measurements of an end user furnace, together with a measurement by a commercial UKAS certified radiation thermometer (C100). The furnace set point was 1150 °C.
Download figure:
Standard image High-resolution image3.4. 2-point calibration
Figure 7 shows the difference between the scales generated for the S1-UoS from fitting to all three fixed-points compared to fitting just to two: either cobalt–carbon and platinum–carbon, cobalt–carbon and rhenium–carbon or platinum–carbon and rhenium carbon. The additional parameter was calculated from the manufacturers published data for spectral response of the filter and detector as described in 2.4 above. When used within the range given by the two fixed-points the difference between scales is at the level of the uncertainties.
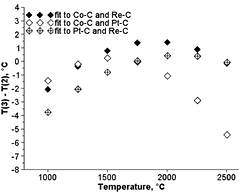
Figure 7. The difference T(3)—T(2) in temperature scales between fitting to three fixed-points and fitting to two fixed-points with the addtional parameter determined from readily available spectral response data of the interference filter and silicon photodiode.
Download figure:
Standard image High-resolution imageFigure 8 shows that the very small measurement area of the S1-UoS gives good tolerance to misalignment from the centre of a calibration furnace.

Figure 8. S1-UoS thermometer measurement as its field of view was translated across the furnace aperture.
Download figure:
Standard image High-resolution imageThe size-of-source-effect was measured using an integrating sphere in order to provide a more sensitive comparison with the other thermometers. Figure 9 shows that this is an aspect of the design in which we have made the S1 performance slightly worse by the modifications. The reduced performance is very likely due to the 5 mm thick thermal insulation that we added to the heater block that has allowed additional stray light to be reflected from it and onto the optical axis, as compared to the uninsulated S1-LII detector holder.
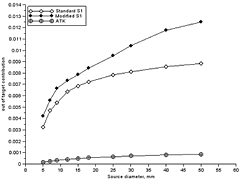
Figure 9. Size-of-source measurement for S1-LII, S1-UoS and ATK thermometers respectively.
Download figure:
Standard image High-resolution imageThe S1-UoS thermometer optical system brought its field stop into best focus at a distance of 500 mm from the front of the instrument. A general purpose transfer standard must be relatively insensitive to distance at which it is positioned from the calibration furnace. We see from figure 10 that the S1-UoS thermometer exhibits reasonable tolerance to defocusing, though there is significant measurement error when taking the thermometer far from its best focus. Having established that the furnace has a relatively uniform radiance across its aperture, as shown in figure 8, and that the thermometer's field of view is filled for all target distances, figure 10 is another measure of the size-of-source-effect. As the target increases in size, a greater proportion of the internal mechanical features can become illuminated, leading to an increase in stray radiation reaching the detector and, in turn, increase in the apparent temperature that is measured.

Figure 10. Change in measurement temperature as the S1-UoS thermometer was moved away from its best focus position of 500 mm.
Download figure:
Standard image High-resolution imageOne of the goals of this study was to produce a high quality primary standard that would be practicable for an end user to realise; through modification to a commercial instrument, without a prohibitive level of expertise and resource. Central to this theme was the addition of a temperature stabilised detector block within the instrument. The ambient temperature stability is shown in figure 11. The detector heater was set to stabilise at 31 °C and the temperature measurement of the S1-UoS remained very stable below 30 °C, showing that we had achieved our goal of temperature stability using a simple heater, at normal room temperature.

Figure 11. The ambient temperature stability of the S1-UoS thermometer's temperature measurement.
Download figure:
Standard image High-resolution image
4. Discussion
Our results, supported by our previous work [23] demonstrate the potential benefits of the MeP-K allowing a primary scale to be delivered directly in a calibration laboratory. The S1-LII performance is clearly good, though the raw thermometer output voltage is substantially less stable than the S1-UoS, with very big drifts as a hot source heats the detector and changes the spectral response. The unmodified instrument performs well here because its spectral drift with ambient temperature has been very carefully characterised at a previous date. This approach is appropriate for a large production run of many thousands: a generic behaviour is established for a model and then individual thermometers are calibrated by comparison to a standard, at three temperatures, and a correction function is applied. The S1-LII performs better than a similarly designed commercial instrument because great lengths went into characterising the signal output and by replacing the electronic components with very expensive, low drift amplifiers and other precision components. However, we have demonstrated that this approach of characterisation is unnecessary for small production runs when the aim is excellent accuracy for calibration, rather than for general purpose industrial thermometry, where low component cost and good low temperature signal-to-noise-ratio is more of a concern. The advantage of stabilising the thermometer is that a three-point calibration based on HTFP is all that is required, making it possible to make simple modifications to commercial instruments that allows a primary temperature scale to be maintained within an industrial laboratory.
In some situations, the difference between the three-point and two-point calibrations may be small enough that the compromise would be acceptable. It simplifies the calibration process and if only a limited temperature range is needed, this might be a valid choice. It should be possible to simplify the process further by use of one of the ITS-90 fixed points that many calibration laboratories already have, and one HTFP.
5. Conclusion
For a calibration laboratory that has a high temperature tube furnace, we have demonstrated that the MeP-K makes the establishment of a primary scale straightforward. This would reduce the number of calibration steps between primary realisation and end-user, and consequently could be a cost effective way to reduce uncertainties. Some differences in working practices will require addressing, particularly the need to align the instruments on a small area of an otherwise rather uniform target; though we have demonstrated that if the thermometer optics are of a high quality then a primary standard that is tolerant to defocusing and misalignments can be realised. Both the thermometer types give improved uncertainties to the end user. The S1 is suitable for manufacture in high volume and could be supplied as a device calibrated against HTFPs, with low uncertainty, in a form-factor that makes it rugged and suitable for use outside the laboratory. The ATK offers lower uncertainty and might be more suitable to a situation where a calibration laboratory or a smaller NMI needs everyday access to an ultra-low uncertainty scale but without daily recourse to measuring HTFPs. We also showed that a 'two point fit', where the radiation thermometer interpolates between only two HTFPs, appears to be perfectly adequate for some situations, especially if a limited range is needed. This further simplifies calibration and allows easier optimisation of a standard radiation thermometer, in order to become compatible with HTFPs and the MeP-K.
Acknowledgments
Dr Willmott's work was supported by the Engineering and Physical Sciences Research Council under grant EP/M009106/1.