

Abstract
Current sources are widely used in bio-impedance spectroscopy (BIS) measurement systems to maximize current injection for increased signal to noise while keeping within medical safety specifications. High-performance current sources based on the Howland current pump with optimized impedance converters are able to minimize stray capacitance of the cables and setup. This approach is limited at high frequencies primarily due to the deteriorated output impedance of the constant current source when situated in a real measurement system. For this reason, voltage sources have been suggested, but they require a current sensing resistor, and the SNR reduces at low impedance loads due to the lower current required to maintain constant voltage. In this paper, we compare the performance of a current source-based BIS and a voltage source-based BIS, which use common components. The current source BIS is based on a Howland current pump and generalized impedance converters to maintain a high output impedance of more than 1 MΩ at 2 MHz. The voltage source BIS is based on voltage division between an internal current sensing resistor (Rs) and an external sample. To maintain high SNR, Rs is varied so that the source voltage is divided more or less equally. In order to calibrate the systems, we measured the transfer function of the BIS systems with several known resistor and capacitor loads. From this we may estimate the resistance and capacitance of biological tissues using the least-squares method to minimize error between the measured transimpedance excluding the system transfer function and that from an impedance model. When tested on realistic loads including discrete resistors and capacitors, and saline and agar phantoms, the voltage source-based BIS system had a wider bandwidth of 10 Hz to 2.2 MHz with less than 1% deviation from the expected spectra compared to more than 10% with the current source. The voltage source also showed an SNR of at least 60 dB up to 2.2 MHz in comparison to the current source-based BIS system where the SNR drops below 40 dB for frequencies greater than 1 MHz.
Export citation and abstract BibTeX RIS
1. Introduction
Bio-impedance spectroscopy (BIS) measurement systems are used to measure the impedance spectra of biological tissues in impedance imaging and bio-electromagnetism [1–7]. Results of BIS studies have significantly contributed to the understandings of electromagnetic phenomena inside the human body [8–10]. BIS measurement systems use the four-terminal or tetrapolar impedance measurement approach to minimize the effects of cables and contact impedance, vital for reproduction of frequency dependence [11–13]. Constant current source-based BISs are popular due to (1) the ability to set currents close to the medical safety limits which specify maximum current at the electrodes and (2) that they maximize distinguishability in impedance imaging, particularly when multiple independent current sources are used to apply high spatial frequency current patterns, which require careful control of injected current patterns [7, 14, 15]. In this method, a constant current is applied and the resulting voltage drop is obtained by the use of a voltmeter as shown in figure 1(a). However, as recognized by Sansen et al [16], the current source approach is limited by its output impedance at high frequencies. They introduced an open-loop control system that measured the current applied by a voltage amplifier with a peak detector. More recently, electrical impedance tomography or spectroscopy (EIT/EIS) systems were developed with voltage-controlled current sources and calibration circuits to apply multi-frequency constant current from 2 kHz to 1.6 MHz, or from 10 Hz to 500 kHz [17, 18] and 20 kHz to 1 MHz [19]. A common problem here is that the performance degraded at high frequencies.
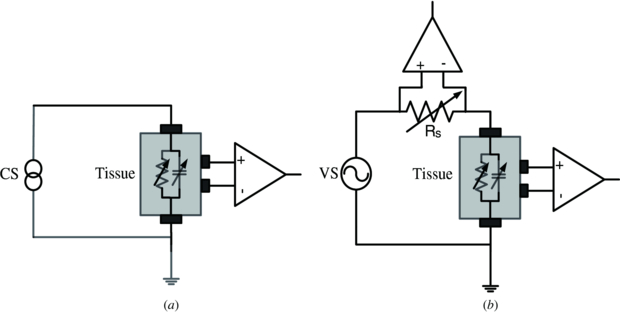
Figure 1. (a) The concept of BIS based on the current source (CS) and (b) BIS based on the voltage source (VS).
Download figure:
Standard imageIn another approach, a unity gain buffer with a current sensing resistor in the feedback loop was used with an additional instrumentation amplifier to measure the voltage drop across the current sensing resistor and a voltage buffer to measure the output voltage. A four-step calibration scheme was used to calibrate the gains of these additional components and determine the total impedance shunt to ground due to capacitance and variation in current sensing resistance. Pspice simulations demonstrated a bandwidth of less than 1 MHz [20]. Recently a digital auto-balancing bridge-based BIS using a voltage source and extensive FPGA digital functions were developed to achieve good performance in simulation up to 10 MHz [21]. No measurement results or calibration methods for realistic stray impedance have been provided so far. These are important for monitoring the injected current to both determine the impedance and meet medical safety limits (figure 1(b)). Voltage source and current source impedance measurements have been combined in order to measure the conductivity of breast tissue over a wide bandwidth for breast cancer detection [22]. They reported higher bandwidth for the voltage source and lower dc SNR, mainly due to choosing different components in the two systems.
Both voltage source- and current source-based BISs are affected by system parasitics such as stray capacitance in the environment, which mainly degrades the high-frequency performance. The interaction between electrode impedance, cable capacitance, capacitance between neighbouring electrode leads, capacitance between signal ground of the device and earth, and lead positioning are factors that cause a change in stray capacitance [23–25]. In order to improve the performance in a wide frequency band, we need to use a calibration method that includes the value of stray capacitance at the current state.
While several voltage sources and current sources have been proposed, there is a lack of reports where they are compared under the same test conditions and design constraints. In this paper, we directly compare a voltage-based BIS with a current-based BIS under the same test conditions. Both used similar components. Therefore, it is possible to provide a practical comparison of the performance. We introduce a new method of calibration for the systems based on the estimation of the impedance spectrum using an approximation of the transfer function of system parasitics and the transfer function of the tissue impedance fitted with a least-squares algorithm. We apply this calibration method for realistic load models of tissue to evaluate the performance of BIS systems.
2. Methods
2.1. Design of the BIS system
2.1.1. Voltage source-based BIS system
The voltage source-based BIS system is improved from the system proposed in [26], which was based on two impedance measurement modules (IMMs) from an EIT system [18]. We adopted lower noise components and an improved PCB layout to reduce stray impedance and block noise sources. The voltage source-based BIS consists of a controller unit, a constant voltage source and two voltage measurement units implemented with an instrumentation amplifier, programmable gain amplifier, analogue filter and an analogue-to-digital converter (ADC) as shown in figure 2. The IMM controller is implemented on an FPGA and controls (1) a digital-to-analogue converter (DAC) to generate the applying sinusoidal waveform with a variable frequency, (2) two ADCs to convert the measured voltages and then (3) performs digital phase-sensitive demodulation. The DSP controls the whole system by receiving instructions from the PC, decoding it and sending the specific desired commands to the IMM controller.
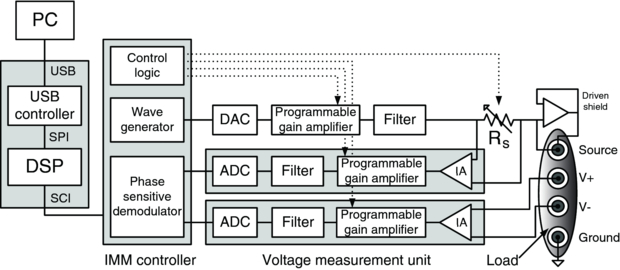
Figure 2. Block diagram of the voltage source-based BIS. The voltage signal is generated with a digital to analogue converter (DAC), programmable gain amplifier and filter to remove quantization noise. The voltage is passed through a variable current sensing resistor to provide current level and phase monitoring. The gain of the amplifiers and current sensing resistor is controlled by the IMM controller based on the required voltage and current levels. The voltage is applied between the source electrode and the ground electrode. One voltage measurement module measures the differential voltage across the current sensing resistor Rs using an instrumentation amplifier (IA), programmable gain amplifier, filter and analogue to digital converter (ADC). An identical voltage measurement module senses the differential voltage from the load. A voltage buffer is used to copy the voltage signal and applied to the inner shield of a triaxial lead to reduce cable capacitance. The outer shield of the lead is grounded. All leads are triaxial, only one is shown here on the voltage source connection for clarity.
Download figure:
Standard imageThe voltage source, filters and screen drivers were based on an operational amplifier (AD8039). The voltage measurement units are each made up of a differential amplifier (AD8130) followed by a gain amplifier (AD8039), a passive filter and a 12 bit ADC chip (AD9236). All passive components were of 5% tolerance or better.
The PC program sets the level and frequency of the voltage input, the gains of the voltmeters, signal averaging, number of sweeps from lowest to highest frequencies and display options.
A sinusoidal voltage with variable frequency is applied to the series connection of the internal sensing resistor, Rs, and the tissue, which is connected via a pair of electrodes. To form a tetrapolar or transimpedance measurement, the differential voltage between another pair of electrodes is recorded. As the system acts as a voltage divider circuit, the sensing resistor is varied to match the transimpedance of the tissue so that the two instrumentation amplifiers measure a similar voltage with similar SNR. For each measurement, we set the sensing resistor with an initial value and measure the voltages across the transimpedance of the tissue and the sensing resistor. Then, we estimate the transimpedance of the tissue and vary the sensing resistor to allocate the source voltage equally between the Rs and the tissue.
2.1.2. Current source-based BIS system
The current source BIS design, as shown in figure 3, is similar to the voltage source-based BIS system with the following modifications. (1) There is a voltage to current converter implemented with a modified Howland current pump. (2) A set of generalized impedance converter (GIC) circuits reduce the effect of stray capacitance at the output of the current source. The combination results in a high output impedance of the current source. (3) The current sensing resistor is fixed as we do not expect the current to change significantly.
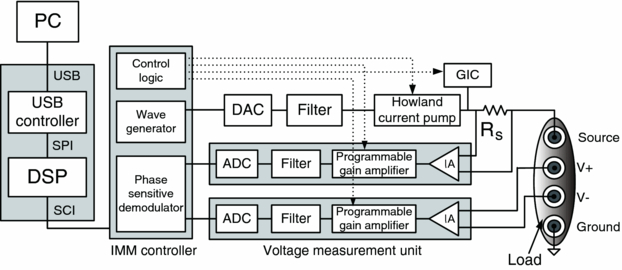
Figure 3. Block diagram of the current source-based BIS. A single-ended current is generated via the 12 bit DAC, filtered to remove quantization noise and the Howland current pump with GIC is used to provide high output impedance. The current is first passed through a fixed current sensing resistor Rs to provide current level and phase monitoring with a voltage measurement unit. The current then passes through the source electrode to the ground electrode. The other voltage measurement unit records the differential voltage between two separate electrodes to provide a four-terminal bio-impedance measurement. As in the voltage source, all leads are triaxial with the inner shield driven with a voltage buffer.
Download figure:
Standard imageThe current source-based BIS system is also constructed with the submodules of the KHU Mark2 EIT system [18]. Two IMMs comprising a current source and a voltmeter are placed between the digital backplane and the analogue backplane with plug-in connectors for electrode lead wires. One IMM is operating as a single-ended current source to inject current for the load and monitor the injection current accurately on a fixed resistor at the output of the current source. The other IMM measures the induced voltage difference in the tissue.
The modified Howland current pump uses one operational amplifier (AD8039) with both negative and positive feedback. The GIC circuit is made up of two operational amplifiers (AD8039) and a series of resistors and capacitors to simulate inductance. The voltage measurement units are each made up of a differential amplifier (AD8130) followed by a gain amplifier (AD8039), a passive filter and a 12 bit ADC chip (AD9236). All passive components were of 5% tolerance or better.
2.2. System calibration
In order to minimize systematic errors, the BIS systems require careful calibration since artefacts may occur from non-ideal characteristics of electronic subsystems. In particular, we need to remove the effect of stray impedance produced by interactions between electrode impedance, cable capacitance, capacitance between neighbouring electrode leads, capacitance between signal ground of the device and earth, and lead positioning. Since this is varied by the environment and system, we developed a calibration method to compensate for the value of stray capacitance at the current state.
Generally, phase and gain calibrations are used for voltmeters. Phase calibration nulls out the systematic phase shift. Gain calibrations are performed in two steps of intra- and inter-channel calibrations. Intra-channel calibration for each voltmeter compensates for frequency dependence of its voltage gain and also any discrepancy between circuit design and actual gain. Inter-channel calibration compensates channel-dependent voltage gains of the two voltmeters. This method of calibration is done by acquiring data using a known resistor load, RL, and then phase, intra- and inter-channel calibration factors are computed. These factors are then applied to measured data as explained in [27]. The problem, however, with this method is that it assumes that the resistor load RL is ideal and that there is no effect of stray or cable capacitance. In our development of the new BIS system we found that even though these stray and cable capacitances might be very small, their effect on the measured voltage at high frequencies is amplified by the electronics and analogue filters used in the voltmeters. In substance, we noticed that for any load RL less than the resistor used for the calibration RT, there is an overestimation of the load at frequencies higher than 1 MHz, and for any load greater than RT there is an underestimation of the load at frequencies higher than 1 MHz because of inherent capacitance of the measurement system (figure 4). Hence we developed a new calibration method based on estimation of the load impedance.
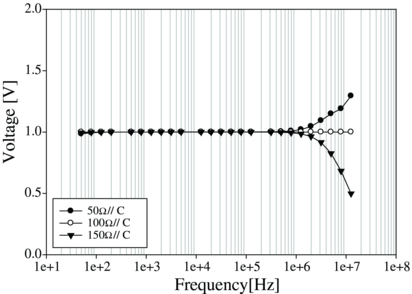
Figure 4. Overestimation when RL < RT and underestimation when RL > RT at high frequencies when using traditional calibration data obtained on RT = 100 Ω. Here, C represents the input capacitance of the BIS system. Data are normalized to highlight differences in spectral shape.
Download figure:
Standard image2.2.1. Calibration for the voltage source-based BIS system
In the previous calibration we took the following steps. (1) We used a fixed resistor load and then obtained data corresponding to the voltage drop across the resistor from the lowest frequency to the highest. (2) We used these values to compute the calibration factors. (3) In the phase calibration we find the angle that will rotate the voltage data so that its imaginary part is zero for each voltmeter. (4) In the gain calibration we obtain intra- and inter-channel calibration factors. (5) In the intra-channel calibration we select data at one frequency as reference and then compute the scaling factor that, when applied to all the data, will give the same value for all frequencies. (6) In the inter-channel calibration we compute the scaling factor for each voltmeter. This scaling factor will ensure that each voltmeter has the same response to a common load.
In the new calibration we take advantage of the fact that the measured voltage data include the load impedance and the effect of the system parasitics such as the amplifiers and filters. (1) We assume that the system parasitics remain constant to measure this with a known load. (2) We calculate calibration factors by removing the known load from the system transfer function at the calibration setup. (3) We then remove the calibration factor from subsequent measured voltage data on unknown loads. (4) The resistance and capacitance of the unknown load are then estimated using least-squares error minimization between the calibrated measurement spectrum of the load and that from the computational model.
To describe the method in detail, we assume a parallel RC load model in series with the sensing resistor Rs. Let the impedance of this model be  . If we know the components of this model, we can accurately compute its load impedance as
In the real case, the system transfer function of BIS includes the effect of non-ideality of electronics, electrodes and cables. We may estimate it as  , using the known load,

Here  is the measured load impedance at the calibration setup of the load and
  is the parasitic effect of the amplifier and filter. From (1) and (2), we compute the calibration factor (CF*(ω)) as

where we assume that L*(ω) is an accurate enough model to assume equality with L(ω). Now for any measurement performed with unknown load, the estimated impedance ( ) will be given by applying the calibration factor to the complex measurement (
 ):
):
where we assume that  is the same as
  and both are independent of the load. We estimate the value of RL using the data at low frequency (below 50 Hz). Now using this value of RL in (1), we find the capacitance iteratively while minimizing the error between
  and
and  in
in

Calibration is further improved by using multiple calibration data sets. The voltage source-based BIS system was calibrated with test loads (RT) of 0.01, 0.1, 0.25, 0.5 0.75, 1, 5 and 10 kΩ.
2.2.2. Calibration for the current source-based BIS system
The current source was calibrated with the same procedure as the voltage source-based BIS system described in section 2.2.1. The current source has finite output impedance due to the existence of an output capacitance and stray capacitance from the PCB layout, switches and the triaxial cables. The current source was made of a single-ended modified Howland current pump followed by a set of GIC circuits [18]. The Howland current pump can be adjusted by means of digitally set variable resistors (DS1267, Dallas Semiconductors, USA) to give a high current output. The GIC can also be adjusted in the same way to reduce the effective stray capacitance. During the calibration of the current source, the optimum settings of the Howland current pump and the GIC digipots are found to produce high output impedance. Practically, it is very difficult to compensate them at high frequencies since the optimal setting value is sensitive to many different parameters that vary over time, including the temperature of the circuit and components, cable shape and electrode status. This reduces the effect of fixed stray capacitance but the current source is still sensitive to variations in stray capacitance at high frequencies as seen in figure 5. Then, we correct the phase of the measurement system within the same frequency range. After calibration, the output impedance of the current source was greater than 2 MΩ at all operating frequencies.
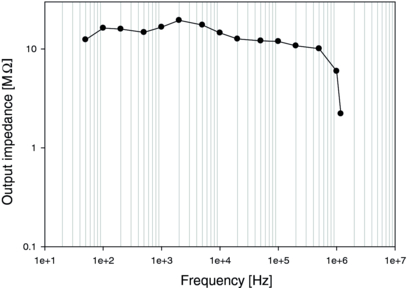
Figure 5. Output impedance of the current source used to implement the current source-based BIS. The employed Howland current pump and GIC circuit are able to reduce the effect of fixed stray capacitance; this stray capacitance has unpredictable variations as it is based on a combination of factors including the cable shape, temperature of components, electrode status and characteristics of the filter and amplifier.
Download figure:
Standard image2.3. Performance evaluation
Both BIS systems were evaluated with discrete components consisting of resistor or resistor–capacitor (R–C) loads. We selected eight resistors of 8, 25, 54, 74, 102, 152, 325 and 602 Ω for testing. We also used a fixed resistor (92 Ω) with each different capacitor (1, 100, 1000 nF) connected in parallel. All passive components were of 5% tolerance or better. The values of used resistors and capacitors were measured by a high precision LCR meter (EDC-1630, ED Corporation, South Korea) at room temperature. The chosen range of impedance values was based on the work of Gabriel et al who show that 75% of biological tissues have transfer impedance in the range of 50 Ω to 1 kΩ. The voltage source was set to maintain 100 mV across the load and the current measured. In the case of the current source the current values were fixed at 1 mA for all impedances. The components were connected using crocodile clips to an electrode model based on the Randles circuit [28, 29], which was connected to the BIS system by driven triaxial leads. The inner shield of the leads was driven with a buffered copy of the signal and the outer shield was grounded at the system's end.
The spectrum of each resistor was recorded repeatedly by both BIS systems to assess the performance of the new calibration method and to compare systems. From the collected data, we calculated the signal to noise ratio (SNR) and the percentage error between the LCR meter load resistances and measured resistances. We also confirmed the new calibration method with R–C loads.
BIS measurements with living tissues use electrodes where each electrode has a different characteristic and contact impedance. When we integrate the developed BIS systems with the specific electrodes, the total transfer function of the measurement system will again vary and this will affect the measurement accuracy. For measuring the impedance spectra of the samples made with saline or agar, we used two types of electrodes as shown in figure 6. One is a cubic container 5 × 5 × 5 cm3 with large injection and ground electrodes and small voltage measurement electrodes (figure 6(a)) filled with saline and agar. The second is a needle-type electrode made of four gold needles attached to an acrylic slab (figure 6(b)), which is inserted 10 mm into samples of saline and agar.
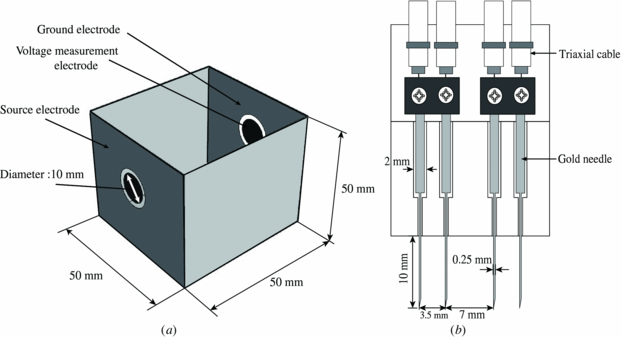
Figure 6. (a) Container with planar electrodes and (b) four needle electrodes for measuring the impedance spectrum of saline or agar samples.
Download figure:
Standard imageThe conductivity can be determined by the measurements in the container with planar electrodes. It is computed by multiplying the ratio of the cross-sectional area of the container and its length by the inverse of the resistance. Saline samples of different conductivities were used to make a mapping table of impedance measurements between the needle-type electrode and planar electrode in the container. We computed the SNRs and conductivities with two different electrodes on several samples to compare the voltage- and current-based BIS systems. All measurements were repeated 64 times to confirm reproducibility.
3. Results
3.1. BIS system calibration
In order to evaluate the new calibration method, we choose three resistors (54, 152 and 602 Ω). Three different calibrations were applied to the collected data. Table 1 shows the percentage error of the previous calibration method, without least-squares fitting, compared with the new methods. Two versions of the new calibration method are compared: the first only used one set of calibration data collected with RT = 1 kΩ. The second used three sets of calibration data collected with RT = 100, 250, 500 Ω. The currents measured from the voltage source BIS were 1.85 mA for 54 Ω, 0.6 mA for 152 Ω and 0.16 mA for 602 Ω with the voltage fixed at 100 mV. The current for the current source was fixed at 1 mA. The new calibration method using multiple calibration data could estimate load resistance with less than 1% error.
Table 1. Comparison of calibration methods with percentage error.
| Previous calibration | Using single data set | Using multiple data sets | ||||
|---|---|---|---|---|---|---|
| RL True value (Ω) | Estimated value (Ω) | Error (%) | Estimated value (Ω) | Error (%) | Estimated value (Ω) | Error (%) |
| 54 | 68.57 | 26.97 | 55.64 | 3.03 | 54.14 | 0.25 |
| 152 | 176.38 | 16.04 | 155.71 | 2.44 | 152.75 | 0.96 |
| 602 | 609.05 | 1.17 | 590.94 | 1.84 | 600.94 | 0.175 |
We applied the new calibration method to both BIS systems as described in section 2.2. Figures 7 and 8 show the transfer functions of magnitude and phase in the voltage source- and current source-based BIS systems before and after calibration, respectively.
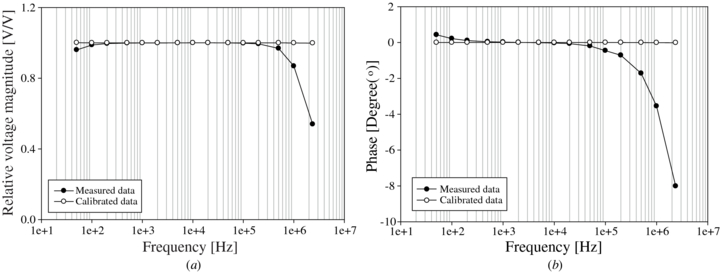
Figure 7. (a) Magnitude and (b) phase transfer function of the voltage source-based BIS system.
Download figure:
Standard image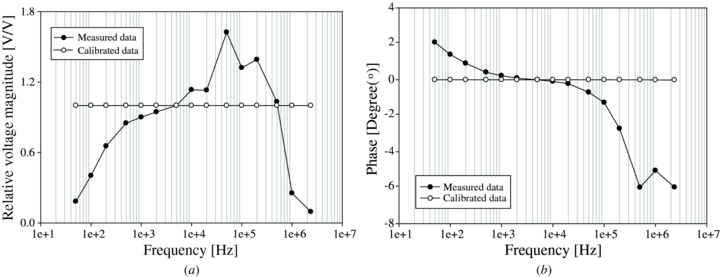
Figure 8. (a) Magnitude and (b) phase transfer function of current source-based BIS system.
Download figure:
Standard image3.2. Resistive and capacitive loads
Figure 9(a) shows the SNR measured on a resistor of 54 Ω for both systems. The SNR was defined as the mean recorded voltage divided by the variation as this captures all noise sources in the system. The SNR of the voltage source-based BIS was higher for frequencies greater than 250 kHz. Figure 9(b) is a plot of percentage error versus frequency of two resistor cases with Load1, 54 Ω, and Load2, 75 Ω. The voltage source BIS clearly shows less deviation at high frequencies than the current source BIS where there is over 10% error at 1 MHz.
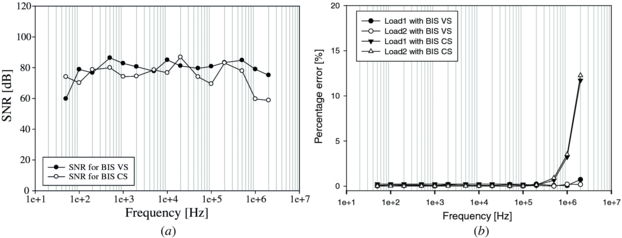
Figure 9. (a) The SNRs and (b) the percentage error between measured resistances and used resistors (Load1 = 54 Ω, Load2 = 75 Ω).
Download figure:
Standard imageWe evaluated both systems with R–C parallel loads and the results are presented in table 2. When increasing load capacitance, the accuracy for estimated resistance was degraded, because the model for our load included inaccuracies and the discrete capacitor includes some stray resistance. The transfer function also varied when we exchanged the different loads. However, the voltage source-based BIS system produced consistently better performance than the current source-based BIS system.
Table 2. Measurements and percentage errors with R–C parallel loads.
| CL = 1 nF | CL = 100 nF | CL = 1 μF | ||||
|---|---|---|---|---|---|---|
| RL = 92 Ω BIS | VS | CS | VS | CS | VS | CS |
| RL | 92.03 Ω | 92.4 Ω | 92.32 Ω | 92.75 Ω | 92.57 Ω | 92.82 Ω |
| CL | 1.1 nF | 0.46 nF | 98 nF | 95 nF | 985 nF | 875 nF |
| Error in RL | 0.038% | 0.49% | 0.35% | 0.6% | 0.62% | 1.98% |
| Error in CL | 10% | 53.9% | 1.7% | 4.5% | 1.5% | 12.5% |
3.3. Phantom experiment
We prepared 0.02% saline and 0.02% agar phantoms following the directions described in [27] and tested them with both systems. Figure 10(a) shows the SNR measured on a saline sample of 0.02% NaCl in the container with planar electrodes. The agar case was similar. The performance of the voltage source BIS was higher than that of the current source BIS above 100 kHz.
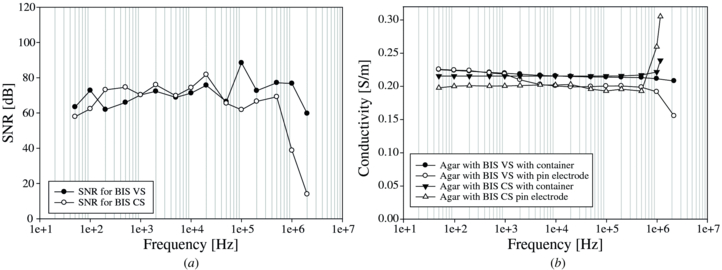
Figure 10. (a) The SNRs measured on a 0.02% saline sample and (b) the conductivity spectra from a 0.02% agar phantom measured by two different electrodes and two different systems.
Download figure:
Standard imageWe used the container with planar electrodes as well as the needle-type electrodes for comparing the measurements on an agar phantom. From the obtained impedance values, we calculated the conductivities of the sample. The plot in figure 10(b) shows the estimated conductivity for the agar phantom. The voltage source-based BIS system in the container produced the flattest frequency spectrum. Since the agar object has low capacitance and was homogeneous within the tested region, the BIS with the voltage source was more accurate. The current source BIS system output was fairly flat up to 500 kHz. But the error was increased in higher frequencies. Using the needle-type electrodes included more errors even at lower frequencies.
4. Discussion and conclusion
We implemented two kinds of BIS systems using a voltage source and a current source, which used similar design constraints, and applied the new calibration method to each system using the transfer function of the measurement system. We evaluated both systems with discrete resistor or R–C parallel loads including an electrode model and 0.02% saline or agar sample with planar electrodes or needle-type electrodes under the same test conditions.
From table 1 and figures 7 and 8, we confirmed that the calibration method clearly provided improvements in both magnitude and phase for both types of BIS systems. Before calibration, the voltage source displayed some deviation at low and high frequencies consistent with a pole introduced by stray capacitance effects, while the current source displayed an irregular and larger deviation in both magnitude and phase. This is likely due to the mutual influence of the modified Howland current pump and the GIC circuit. Table 1 shows that the accuracy is increased dramatically using a single calibration data set and further improved by using multiple calibration sets in the voltage source-based BIS system.
The experiments were carried out in similar conditions to minimize the errors due to varying test conditions. Each test was repeated 64 times to make sure that the results were reproducible. The voltage source used less current than the current source except on one load of 54 Ω. Figure 9(b) shows that the percentage error on two small loads is significantly greater with the current source-based system at frequencies greater than 500 kHz. Here, the percentage error in the current source-based BIS system increases to more than 10% while with the voltage source-based system the error stays below 1%. This was further reflected in the agar phantom results with two different electrode types in figure 10(b). Here, the deviation from an expected flat spectrum was significantly larger for the current source-based system at high frequencies, above 500 kHz, with both electrode types. This behaviour was also seen with the voltage source but with significantly less deviation. For both types of BISs, the deviation was in the opposite direction for the two electrode types. This deviation is similar to that found before calibration in figure 4. The pin electrode is expected to have higher impedance, which will encourage the current to shunt away from the sample, increasing the apparent measured conductivity. The larger container electrodes showed a decrease in conductivity, which may reflect a decrease in the voltage measured due to a combination of stray impedance and contact impedance. This effect may also occur for the pin electrode but is masked by the greater effect of a low-current injection.
The SNR results in figures 9(a) and 10(a) showed that the voltage source BIS system had a better performance at high frequencies (above 500 kHz) than the current source BIS system. When tested on discrete resistors, saline and agar, the voltage source-based BIS system had a wider bandwidth of 10 Hz to 2.2 MHz with an SNR of at least 60 dB over the full bandwidth in comparison to the current source-based BIS system where the SNR drops below 40 dB for frequencies greater than 500 kHz.
We are not aware of any current source that could have been designed with better frequency response. In order to maintain medical safety at all times in bio-impedance and EIT a careful design of the current source is imperative. Various works have been carried out to test which current source design was best suited for EIT [30–33] and they all concluded that an improved Howland current pump was the best. In this work, we implemented the current source using a 16 bit DAC followed by an improved Howland current pump circuit and the four sets of GICs. The limiting factor of a current source is that its output impedance degrades at high frequencies due to stray capacitance. In our system, we used the GIC circuits to cancel this stray capacitance. After calibration, the output impedance of the current source was greater than 1 MΩ at all testing frequencies (figure 5). It may be the case that an improved Howland current source might be designed with alternative components or with a custom integrated circuit ASIC but this would not then be a fair comparison against the voltage source. Our intent in this paper was to use as many common components with the voltage and current sources for a fair comparison.
In conclusion, we designed two wideband BIS systems, one using a current source and the other using a voltage source, and tested them for performance at high frequencies. The two systems were implemented using identical electronic chips where possible and applying similar calibration techniques to improve their performance. This allows us to make a general conclusion that voltage source-based systems are superior to current source-based systems at higher frequencies. In both systems the use of inexpensive and common components demonstrates that a cost-effective system can be developed as an alternative to expensive commercial systems in order to measure an impedance spectrum for biological tissues.
Acknowledgment
This work was supported by the grant from Kyung Hee University in 2011 (KHU-20 110 247).