
Abstract
This article presents a spectroscopic investigation of Sr0.33Ba0.67(NbO2)3, doped with 1 mol% of Pr3+. Photoluminescence and luminescence kinetics were measured at different temperatures at ambient (ferroelectric phase) and 76 kbar pressures (paraelectric phase). The photoluminescence spectrum is dominated by 1D2→3H4 transition of Pr3+ in both phases. At ambient pressure when the system is excited with UV radiation, the intensity of dominant 1D2→3H4 emission evidently increases in the 200–293 K temperature range. This effect is attributed to enhancement of the excitation of the 1D2 state through the praseodymium trapped exciton state, which at higher temperatures does not populate the higher lying 3P0 state. Additionally, under UV radiation the material exhibits afterglow luminescence activated by temperature that can also have an impact on the increase of the 1D2 emission. We propose that the afterglow luminescence is related to the existence of electron traps. At a pressure of 76 kbar the depth of the electron traps decreases in comparison to the ones observed at ambient pressure. However, the phase transition does not change the number of electron traps.
Export citation and abstract BibTeX RIS
1. Introduction
Strontium barium niobate crystals SrxBa1−xNb2O6 (SBN) are important ferroelectric materials which have several applications due to their well-known electro-optic, photorefractive, pyroelectric, piezoelectric and non-linear properties [1]. SBN crystals doped with Ln3+ have been widely used in many applications, especially in the fields of photorefractive memories [2] and solid-state lasers [3].
Of particular interest is their relatively low value of the Curie temperature Tc. At ambient conditions SBN crystals exist in the ferroelectric phase with the point group C4v (space group P4bm). The Tc at which material changes phase from the ferroelectric to the paraelectric, with the phase described by point group D2d and space group P4b2, depends linearly on x; in the range 0.25<x<0.73 it changes from 470 to 320 K [1], [4]. In the case of Sr0,33Ba0,66Nb2O6 the Tc is equal to 430 K [5]. A high hydrostatic pressure strongly decreases the Curie temperature. At temperature 7 K the transition from the ferroelectric to the paraelectric phase for Sr0,6Ba0,4Nb2O6 has been observed for a pressure around 50 kbar [6].
Although SBN materials doped with Ln3+ have been widely investigated [7], [8], [9], [10], there are still several issues which are not fully understood. Recent papers dealing with the luminescence of Pr3+ in these hosts evidence interesting effects that have their origin in the interactions between the host lattice and doping ions [11, 12]. In our previous paper [13] the influence of excitation energy and high pressure on the kinetics of the emission from 3P0 and 1D2 states of Pr3+ in SrxBa1−x(NbO2)3, x =1/2 and 1/3 doped with 1 mol% of Pr3+ were presented. We found that pressure causes a quenching of the Pr3+ luminescence. This effect was explained by the existence of a praseodymium trapped exciton (PTE) state [14], also described as an intervalence charge transfer state [15]. We considered whether the PTE state appears when the hole is trapped by Pr3+, with Pr4+ then capturing the electron by Coulomb potential [16]. Pressure causes the increase of the energy of the localized states of Pr3+ with respect to the conduction band and PTE, and therefore quenches the 3P0 and 1D2 luminescence when respective states are pushed above the PTE states. In this study the luminescence kinetics of the Sr0,33Ba0,66Nb2O6 : Pr3+ system at different temperatures at ambient and high hydrostatic pressure, obtained in a diamond anvil cell (DAC), are presented and discussed. Specifically, we present the results on the persistent luminescence that appears after excitation by UV radiation.
2. Experimental
Single crystals of Sr0.33Ba0.67Nb2O6 (SBN33) doped with 1 mol% Pr3+ ions were grown by spontaneous nucleation in a strontium barium tetraborate flux, following a procedure previously described [17].
Luminescence excitation spectra were acquired using a spectrofluorometer FluoroMax-4P TCSPC produced by Horiba and containing Czerny–Turner monochromators for excitation and emission. The excitation source in this system was a 150 W ozone-free xenon lamp which makes possible luminescence measurements from 220 to 850 nm with an accuracy of 1 nm. Fluorescence intensity was measured using a side-on photomultiplier R928. The spectra were automatically corrected for instrumental spectral response and xenon lamp output spectrum. Data were collected by the FluroEssence software.
Steady-state luminescence spectra were excited with He–Cd and diode lasers using the wavelengths of 325 nm and 473 nm, respectively. The photoluminescence spectra were recorded on a SR-750-D1 luminescence spectrometer with an Andor CCD camera DU420A-OE type with an accuracy of 0.5 nm. The spectra were corrected for instrumental spectral response using a standard lamp.
To obtain the decay times of the luminescence and time-resolved spectra, the sample was excited using a system consisting of a PL 2143 A/SS laser and a PG 401/SH parametric optical generator. This system can produce 30 ps pulses with a frequency of 10 Hz and with wavelengths ranging from 220 to 2200 nm [18]. The emission signal was analyzed using a Bruker Optics 2501S spectrograph and a Hamamatsu Streak Camera model C4334-01. Time-resolved luminescence spectra were collected by the integration of streak camera images over time intervals, whereas luminescence decays were collected by the integration of streak camera images over the wavelength intervals. The 640 × 480 (wavelength×time) pixels image ensures a maximal point-to-point spectral resolution of 0.5 nm and a temporal resolution of 1 ns. This apparatus allowed for the measuring of time-resolved spectra and luminescence decays for time scales not longer than 10 ms. A closed cycle helium cryostat type DE-202 (Cryogenics Inc.) were used for low-temperature measurements. The temperature was controlled by a Lake Shore controller Model 331 with accuracy of 1 K. High hydrostatic pressure was applied in a Merrill Bassett type [19] DAC. Polydimethylsiloxane oil was used as the pressure-transmitting medium; the pressure being measured in all the considered temperatures by the shift of the R1 luminescence ruby line with an accuracy of 3 kbar.
3. Results and discussion
The pressure dependence of the dielectric properties of SBN crystals show a linear decrease of Tc with pressure p, indicating a change rate of dTc/dp = −6.8 K kbar−1 [6, 20]. In our case with SBN33 : Pr, Tc is equal to 430 K at ambient pressure. Taking into account the above relation, we consider that Tc is equal to 10 K at a pressure of 62 kbar. In the considered 10–350 K temperature range, at ambient pressure, the SBN33 : Pr belongs to the ferroelectric phase, whereas at 76 kbar the SBN33 : Pr belongs to the paraelectric phase.
The luminescence and luminescence excitation spectra of SBN33 : Pr are presented in figure 1. The excitation spectrum (dashed curve) of the emission monitored at 611 nm (the 1D2→3H4 transition of Pr3+) consists of sharp lines related to the 3H4→3P0, 3P1 and 3P2 transitions, and a broad band, with the maximum at 370 nm, related to host absorption and electron–hole (e–h) pairs creation. The emission spectrum (solid curve), excited with 325 nm in the host absorption band, consists of the 1D2 dominant emission and the low-intensity 3P0 emission lines. The detailed assignment is presented in figure 1. More information on the influence of the excitation energy on luminescence spectra can be found in our earlier paper [13].
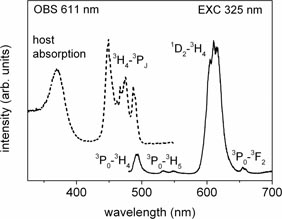
Figure 1. Luminescence excitation and emission spectrum of SBN33 : Pr. The emission spectrum (solid curve) was collected at room temperature under UV excitation at 325 nm. Excitation spectrum (dashed curve) was recorded by monitoring the 1D2 photoluminescence at 611 nm.
Download figure:
Standard image High-resolution imageFigure 2 shows the temperature dependence of the photoluminescence obtained under steady-state excitation of SBN33 : Pr monitored in the region of the 1D2 emission (580–650 nm), under a 473 nm excitation (figure 2(a)) and a UV excitation (figure 2(b)). Under internal excitation of the 1D2 state through the 3H4→ 3PJ transitions (473 nm), the intensity of the 1D2 emission barely depends on the temperature when in the range 10–293 K. Above 293 K, the 1D2 photoluminescence intensity decreases (see figure 2(a)). Under excitation with 325 nm in the range 10–200 K the 1D2 photoluminescence intensity barely depends on temperature, while further increasing the temperature from 200 to 293 K causes enhancement of the photoluminescence intensity. Above 293 K, the intensity of the photoluminescence decreases (see figure 2(b)). To summarize these results, the integrated intensity of the 1D2→3H4 luminescence versus temperature for different excitation wavelengths (473 and 325 nm) are presented in figure 3(a). An evident increase of the intensity of luminescence under UV excitation is observed in the temperature range 200–293 K.
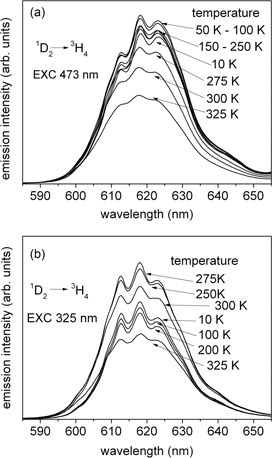
Figure 2. Temperature dependence of the 1D2 steady-state photoluminescence of SBN33 : Pr under 473 nm excitation (a) and under UV excitation at 325 nm (b).
Download figure:
Standard image High-resolution image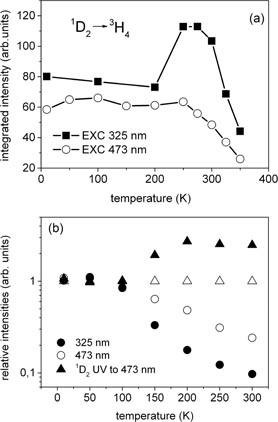
Figure 3. (a) Integrated intensity of the 1D2 emission under 473 nm excitation (circles) and under UV excitation at 325 nm (squares) as a function of temperature. (b) Temperature dependence of the ratio of the intensities of lines related to the 3P0→3H4 to 1D2→3H4 under excitation 325 and 473 nm (solid and hollow circles). The solid triangles represent temperature dependence of the 1D2→3H4 emission intensity under excitation 325 nm with respect to the 1D2→3H4 emission intensity under excitation 473 nm (hollow triangles).
Download figure:
Standard image High-resolution imageThe increase of the 1D2 emission at a higher temperature under steady-state excitation at 325 nm can be attributed to an enhancement of the direct excitation of the 1D2 state through the PTE state, which does not populate the higher lying 3P0 state. To investigate this effect better, the temperature dependence of the ratio of the 3P0→3H4 emission to the 1D2→3H4 emission under excitation with 325 and 473 nm are presented in figure 3(b). It is seen that under 325 nm excitation, the emission originating from the 3P0 state decreases more rapidly with respect to the 1D2 emission than in the case of direct excitation of the 3P0 state with 473 nm. This effect could be responsible for the increase of the 1D2 emission for temperatures above 200 K under excitation with 325 nm.
The physical situation is presented in the configurational coordinate diagram in figure 4. Here nonradiative processes that populate the 1D2 and 3P0 after band to band excitation are represented by dashed arrows. After UV excitation to the PTE state the system relaxes either to the 1D2 or to the 3P0. When the energy ΔE3 = ΔE2–ΔE1 is small, the PTE and 3P0 states are in thermal equilibrium after UV excitation. According to the diagram the nonradiative transition from the PTE to the 1D2 state does not need activation energy. In this case the ratio of the occupation of the 1D2 to the 3P0 state is the same as the respective ratio of the PTE to the 3P0 and is proportional to quantity exp[–ΔE3/kT]. Thus when the temperature increases, the population of the 1D2 state increases proportionally to exp[–ΔE1/kT]. On the other hand, after excitation directly to the 3P0 state, the probability that the 1D2 state is occupied is proportional to the quantity exp[–ΔE2/kT]. If ΔE2 > E1 the increase of the intensity of the 1D2 emission under excitation with 325 nm should be observed for lower temperatures than under excitation directly into the 3PJ state. In fact when the system is excited to the 3PJ intensity of the 1D2, emission does not depend on temperature because the energy  is too high to activate the additional nonradiative transition from the 3P0 to the 1D2 state. One should also consider the influence of the afterglow luminescence on the increase of the 1D2 emission within a certain temperature range. In contrast to the dependence of the steady-state emission intensity on excitation wavelength and temperature, the changes in the luminescence kinetics cannot be related to the configurational coordinate diagram presented in figure 2(e).

Figure 4. Configurational coordinate diagram representing energetic structure and radiative (solid arrows) and nonradiative (dashed arrows) transitions in the Sr0,3Ba0,6(NbO2)3 : Pr3+ system.
Download figure:
Standard image High-resolution imageThe temperature behavior of the temporal profiles of the 1D2 photoluminescence excited through the host absorption and 3PJ states are presented in figures 5(a) and (b), respectively. Under 473 nm, excitation of the 1D2 photoluminescence decay profiles are almost single exponential in all considered temperature ranges, and only at 293 K is a trace of a slower component to be seen in the temporal profile (see figure 5(b)). A different situation is observed under 355 nm (host absorption) excitation. The decay profiles of the 1D2 photoluminescence are single exponential between 10 and 100 K temperatures. When the temperature increases above 100 K, the temporal profiles become slower and consist of multiple exponential components (see figure 5(a)). This effect is most apparent in the same temperature range 200–293 K, for which the enhancement of photoluminescence intensity was observed. In order to discuss the temperature dependence of the 1D2 decay profiles, we have approached the problem using two components: a faster one which reflects the 1D2 luminescence decay (observed in all considered temperature regions), and a slower one which is activated when a temperature in the range 200–293 K is reached. The slower component yields a decay time of the order 2–3 ms and is interpreted as an afterglow. Above 293 K the afterglow decay is again absent in the temporal profile of luminescence monitored in the 600–630 nm spectral region.

Figure 5. Decays of SBN33 : Pr monitored at the 600–620 nm region of the 1D2 emission measured at different temperatures in the range 10–350 K under 473 nm excitation (a) and under 355 nm (b).
Download figure:
Standard image High-resolution imageTo understand better the extraordinary temperature behavior of the 1D2→3H4 emission of SBN33 : Pr3+, time-resolved spectroscopy has been used. The main advantage of this technique is the possibility of observing spectral distribution and luminescence decay at the same time. Time-resolved luminescence spectra of SBN33 : Pr, excited with different wavelengths, are presented in figure 6. The spectra obtained in the timescale 0–1 ms (after a laser pulse) are presented as solid curves and consist of luminescence related to the emission from the 1D2 states of Pr3+. The spectra integrated over the time period 1–10 ms (after a laser pulse) are presented as dashed curves and consist of afterglow also related to the emission from the 1D2 state of Pr3+. A detailed analysis of the time-resolved emission under different excitation wavelengths showed that the relative intensity of the afterglow luminescence to conventional luminescence depends on excitation wavelength. Three different excitation pathways are presented in figure 6. The excitation wavelength 355 nm corresponds to the host absorption and e–h pairs creation; the 473 nm and 594 nm wavelengths correspond to the transition from the ground state 3H4 of Pr3+ ions to the excited states 3PJ and 1D2, respectively. When the system is excited in the host absorption band under excitation at 355 nm (figure 6(a)), the intensity of afterglow luminescence is comparable to the intensity of the 1D2 luminescence of Pr3+ ions. Under excitation at 473 nm only a trace of afterglow was observed. Under excitation at 594 nm there is a lack of afterglow. One notices that the emission spectra measured after the 594 nm excitation differs from that obtained for other excitations. In this measurement the excitation wavelength was close to the observation region, therefore we had to use a filter that reduced the intensity of the 1D2→3H4 luminescence, though the filter does not influence the luminescence decay.

Figure 6. Time-resolved luminescence spectra of SBN33 : Pr excited with wavelength (a) 355 nm, (b) 473 nm and (c) 594 nm.
Download figure:
Standard image High-resolution imageUnder UV excitation in the host absorption band, e–h pairs are created. We considered two processes of de-exciting e–h pairs which leads to conventional luminescence and afterglow luminescence. The situation is presented schematically in figure 7. Conventional luminescence appears when the hole is trapped immediately at Pr3+ forming Pr4+; the electron is captured by Coulomb potential on the Pr4+ forming the PTE [13]. The PTE then recombines, populating the 3P0 or 1D2 excited states of Pr3+. The ratio of the 3P0 to 1D2 luminescence depends strongly on temperature.
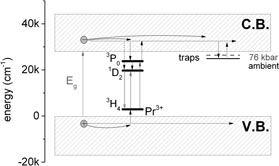
Figure 7. Diagram representing energetic structure of the of SBN33 : Pr system and mechanism of persistent luminescence.
Download figure:
Standard image High-resolution imageThe afterglow luminescence appears when the hole is trapped immediately at Pr3+ forming Pr4+, but the excited electron, instead of forming the PTE, can be captured at the traps. This process at low temperatures leads to a praseodymium ion in the 4+ charge state and an electron in the trap. When the temperature increases the electron can be excited from the trap state to the conduction band and can then be captured by Pr4+, giving rise to afterglow luminescence.
One notices that under 473 nm excitation, which correspond to direct excitation in the 3PJ states, conventional luminescence is mainly observed. However, the trace of afterglow luminescence is also observed, which can be related to the autoionization of Pr3+ ions (the electron is transferred from 3PJ to the conduction band, where it can then be trapped).
To get more insight into the nature of the traps we will discuss the effect of temperature and pressure on the afterglow decay under the most efficient excitation, which is in the UV region. In figure 8 the luminescence decays collected in the 600–630 nm spectral region, obtained at ambient (ferroelectric phase) and 76 kbar (paraelectric phase) pressure, and at different temperatures in the 50–350 K range, are presented. Under ambient pressure, an afterglow decay component is activated at 200 K, with a decay time constant equal to 3 ms. The contribution of this component increases with increasing temperature up to 275 K. Above 275 K, the contribution of afterglow luminescence decreases. Furthermore shortening of the decay time above 275 K is observed. A different situation occurs under 76 kbar pressure, which corresponds to the paraelectric phase (figures 8(c) and (d)), where the afterglow component is activated at a lower temperature than was found for the ferroelectric phase. At 50 K the decay time constant is equal to 2 ms. The contribution of the long-lived decay component increases with increasing temperature up to 200 K. Above 200 K the contribution of afterglow luminescence decreases and a shortening of the decay time is observed. In figure 9 the ratio of the emission intensity integrated over the 1–10 ms scale (after a laser pulse) to the intensity integrated over the 0–1 ms scale, Ia/Ic, is presented. This ratio represents the relationship between the afterglow luminescence and conventional luminescence. At ambient pressure (ferroelectric phase) the ratio Ia/Ic is considerable for temperatures above 200 K and reaches a maximum at 275 K. At pressure 76 kbar (paraelectric phase), Ia/Ic becomes significant for temperatures greater than 100 K, whereas the maximum of Ia/Ic is observed at 225 K. One notices that the Ia/Ic ratio reaches a maximum at different temperatures for the ferroelectric and paraelectric phases, though its value is the same and approximately one. This leads to the conclusion that the depth of the traps decreases after pressure-induced ferroelectric-to-paraelectric phase transition, though the phase transition does not change the number of electron traps.

Figure 8. Decay curves under different temperatures of the SBN33 : Pr monitored at the 600–620 nm region of the 1D2 emission under 355 nm excitation.
Download figure:
Standard image High-resolution image
Figure 9. Relation intensity of conventional and afterglow luminescence as a function of temperature.
Download figure:
Standard image High-resolution image
4. Conclusions
We have presented a spectroscopic investigation of Sr0.33Ba0.67Nb2O6, doped with 1 mol% of Pr3+. At ambient pressure, when the system was excited with UV radiation, the intensity of dominant 1D2→3H4 emission evidently increased in the 200–293 K temperature range. This effect was attributed to the enhancement of the direct excitation of the 1D2 state through the PTE state, which at higher temperatures does not populate the higher lying 3P0 state. Under UV radiation the material exhibits afterglow luminescence activated by a temperature that can also have an impact on the increase of the 1D2 emission. We have proposed a mechanism for explaining the persistent luminescence based on the detrapping of electrons. Under UV excitation, electron–hole pairs are created and electrons are captured at traps, whereas holes are captured by Pr3+ (the creation of Pr4+). At a certain temperature the electron can be excited from the trap state to the conduction band and then be captured by Pr4+, giving rise to afterglow luminescence. Under excitation at 473 nm a trace of afterglow is observed due to autoionization of Pr3+. A high pressure study showed that the depth of the traps decreases after pressure-induced ferroelectric-to-paraelectric phase transition, though the phase transition does not change the number of electron traps.
Acknowledgments
This study has been funded by grant PMN no. 538-5200-B159-13 and by the POIG.01.01.02-02-006/09 project 'New efficient phosphors for lighting and solar concentrators'. The contribution of AL was supported within the International PhD Project 'Physics of future quantum-based information technologies': grant MPD/2009-3/4 from the Foundation for Polish Science.