
Abstract
The properties of neutral defects in SrTiO3 are calculated using the screened hybrid density functional of Heyd, Scuseria, and Ernzerhof. The formation energies, the crystal field splittings affecting the SrTiO3 band structure, and the relaxation geometries around each defect are discussed. Oxygen vacancies introduced in SrTiO3 are found to cause a small tetragonal elongation of the lattice along the z-axis. The resulting conduction band minimum electron effective masses deviate from the bulk values and support the proposal of enhanced electron mobility along the direction of the compressive strain. The locations of the various defect bands within the SrTiO3 gap are estimated without introducing any post hoc corrections, thus allowing a more reliable comparison with experiment.
Export citation and abstract BibTeX RIS
1. Introduction
The properties of point defects in metal oxides and their superlattices have been an area of recent interest, and have been investigated using increasingly precise and sophisticated experimental methods [1, 2]. Optical experiments can determine differences between sharp photoluminescence peaks with meV precision [3]; this can be used to determine the different types of defect, but the chemical identity of a point defect or defect complexes remains difficult to obtain. Electronic structure methods have been used to obtain the formation energies and the location of defect levels within the gap to identify the source of the photoluminescence peaks [4, 5]. However, first principles calculations of defects in complex systems suffer from several limitations [6]. The long-range interaction between defects in neighboring cells, an artifact of periodic boundary conditions (PBCs), can affect relaxation around a defect [7]. Also, correcting the spurious interaction between charged defects [8, 9] and the introduced compensating background charge is an area of ongoing interest. Furthermore, there is a well known underestimation of band gaps when calculations using the local spin density approximation [10] (LSDA) of density functional theory (DFT) are performed; while it is possible to apply a post-hoc correction to the gap and get good results for uniform solids [11], it is less obvious how comparable to experiment the result of this practice is when applied to the location of the defect levels. More advanced semilocal density functionals perform better but still generally underestimate the band gap [12].
Some of these limitations may be overcome via post-DFT or hybrid DFT calculations, which often give band gaps closer to experiment [12]. Band gap accuracy generally implies efficacy in modeling defect structures; for example, a recent comparison of semilocal and hybrid density functional theory (DFT) calculations showed that there is a strong correlation between the calculated valence band width (VBW) and defect formation energies [13]. Accurate VBW values obtained with the Heyd–Scuseria–Ernzerhof screened hybrid functional [14] (HSE) lead to point defect formation energies and energy levels in close agreement with experiment for elemental and binary nonmetals [15–17]. These findings are encouraging because (unlike semilocal functionals) screened hybrid functionals require no post-DFT correction of the band gap and provide excellent lattice parameters in addition to other bulk properties [18–21]. In studies of cubic SrTiO3 (STO) [22–25] and other perovskites [23, 26–28], HSE has been shown to perform well for band gaps, spin–phonon effects, and numerous structural effects, including strain, bulk moduli, octahedral angle tilts and rotations amongst others. Recently, a regular and hybrid density functional study on many perovskites [29] has highlighted the relevance of anharmonic corrections to lower the octahedral rotation and tilt angles. The anharmonic correction was 0.15° for all compounds except STO, for which the correction was 0.8°. For methods containing 25% HF mixing, namely PBE0 and PBEsol0, the uncorrected angles in SrTiO3 were already close to experiment; applying the anharmonic correction led to too small angles. HSE belongs to the same family but has a screening parameter ω = 0.11, so it can be thought of as an interpolation between PBE (ω = ∞) and the global hybrid PBE0 (ω = 0). We expect the anharmonic effect correction would lead to HSE octahedral rotations overcorrected to too small angles compared to experiment.
We here present the results of our HSE calculations for the formation energies and band structures of neutral defects in SrTiO3. This work is motivated by HSE's agreement with experiment in the calculation of many of the electronic, structural and elastic properties in cubic SrTiO3 [22, 23] and other metal oxides [26]. It is worth noting that the direct and indirect band gaps as well as VBW are in excellent agreement with experiment (see table 1) compared to the results from LSDA and B3PW [30], which were previously used to study point defects in SrTiO3. We focus on the various neutral vacancies in SrTiO3, such as the oxygen ( ), strontium (
 ) and titanium vacancies (
 ), as well as on the effect of doping STO with La (LaSr).
Table 1. Comparison of properties of bulk STO relevant to defect formation from our work, previous computational studies, and experiment. Our HSE/SZVP band gaps and valence band widths (VBWs) are closer to experiment than the semilocal LSDA and the global hybrid B3PW results.
| LSDAa | B3PWa | HSEb | Exp. | |
|---|---|---|---|---|
| Direct gap (eV) | 2.36 | 3.96 | 3.59 | 3.75c |
| Indirect gap (eV) | 2.04 | 3.63 | 3.20 | 3.25c |
| VBW (R → R) (eV) | 4.77 | 6.47 | 5.0 | 5.0c |
| a0 (Å) | 3.86 | 3.90 | 3.89 | 3.89d, 3.90e |
| B (GPa) | 214 | 177 | 204 | 179 |
aReference [37]. bReference [22]. cReference [38]. dReference [39]. eReference [40].
2. Computational methods
All calculations included in this manuscript were performed using the development version of the Gaussian suite of programs [31], with periodic boundary conditions (PBCs) [32] used throughout. The functionals applied in this work include the generalized gradient approximation of Perdew, Burke and Ernzerhof [33, 34] (PBE) and HSE [14]. The Def2- [35] series of Gaussian basis sets were optimized following our procedure, described in [22]. We use the notation SZVP to differentiate these optimized PBC basis sets from the molecular Def2-SZVP basis sets. Strontium has the inner-shell electrons replaced with small-core pseudopotentials, while for oxygen and titanium atoms we utilize all-electron basis sets. The SZVP basis offers a good compromise between computational efficiency and high accuracy for electronic and structural properties of bulk SrTiO3 [22]. The use of the SZVP basis set with the HSE screened hybrid functional (HSE/SZVP) imposes limitations on the size of the supercell that can be efficiently computed, so an STO supercell of 2 × 2 × 2 (40 atoms) was used with a dense k-point mesh of 6 × 6 × 6, which included the Γ point. Calculations with larger supercells of 2 × 3 × 3 (90 atoms) with the same density of k-points were performed in order to discuss the importance of defect self-interactions and the effect of varying the defect concentration on the electronic properties of STO. The pruned integration grid for DFT employed was (99, 590), which corresponds to the Gaussian option 'ultrafine'. The remaining numerical settings in Gaussian were left at the default values; e.g., the geometry optimization threshold was set to 450 × 10−6 hartrees/bohr, SCF convergence was set to 'tight'. Unless otherwise noted, crystal structures for chemical potential calculations on SrO, TiO, Ti2O3, and Ti2O were downloaded as CIF files from the ICSD [36]. All structures are fully relaxed (optimized) unless otherwise noted.
3. Results and discussion
3.1. Vacancy formation energy calculations
The calculations of neutral defect formation energies are based upon the formalism of Zhang and Northrup [41]. These values are generated using the equation

where ET and ET(perfect) are the calculated total energies of the supercells containing the point defect and the perfect bulk host materials, respectively. The number of each element removed from the perfect supercell is represented by nx, while μx corresponds to the atomic chemical potentials in an SrTiO3 crystal. Given the assumption that SrTiO3 is always stable, the chemical potentials of the these elements can vary with the following restriction:

Atomic chemical potentials vary according to the sample composition and cannot be determined exactly. However, they can be varied to cover the whole phase diagram of SrTiO3, by splitting into SrO, TiO, Ti2O3 and Ti2O bulk phases. Hence, the calculated formation energies for the neutral point defects vary according to equilibrium positions; an example of this is O-rich versus O-poor points on the phase diagram. The calculated enthalpies of formation in idealized materials (non-relaxed structures) for phases containing Sr, Ti and O are summarized in table 2, and are compared to previous LSDA calculations [42] and experiment [43].
Table 2. Calculated enthalpies of formation in eV/atom for idealized materials for phases containing Sr, Ti and O compared to previous LSDA calculations and experiment.
| HSE | PBE | LSDAa | Exp.b | |
|---|---|---|---|---|
| TiO2 | −3.92 | −3.75 | −3.76 | −3.24 |
| Ti2O3 | −3.74 | −3.60 | −3.63 | −3.15 |
| TiO | −2.99 | −2.95 | −3.04 | −2.81 |
| SrO | −4.00 | −3.90 | −3.36 | −3.07 |
As a general trend, the formation enthalpies computed with HSE are close to the results from semilocal functionals LSDA and PBE (from this work), although the HSE values are slightly higher. The only exception is SrO, where both HSE and PBE tend to overestimate the formation enthalpies to the same extent, exceeding the LSDA values.
The formation energies of vacancy defects in STO as a function of its composition are plotted in figure 1 with the points A to G based5on the phase diagram in [42]. The plot shows that HSE's formation energies show a similar dependence on the chemical potentials as was observed for the LSDA results of [42]. However, both  and
and  curves are shifted to higher formation energies, while the
  curve is slightly shifted downwards compared to the LSDA spectrum. At point A,
  has the lowest formation energy followed by
  and
and  . At point B,
  remains the most stable but
  becomes more stable than
  contrary to the LSDA predictions. Under low partial pressures of oxygen (O-poor conditions corresponding to points C to G),
  vacancies form more easily and dominate the spectrum while the formation energies of
  and
and  keep increasing.
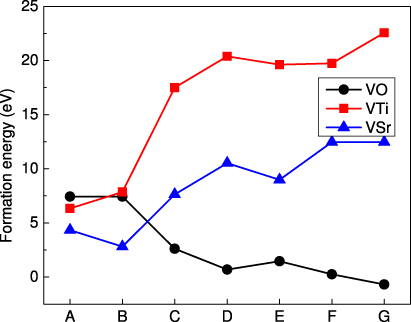
Figure 1. Defect formation energies of isolated neutral vacancies in STO at each equilibrium point based upon the phase diagram detailed in the text.
Download figure:
Standard imageA quantitative comparison with previously published calculations using the same cell size formation energies [30, 42, 44] available at point B (oxygen rich conditions) reveals several issues of interest.
- For
 , the semilocal functional PW91 [44] yields a formation energy of 8.56 eV, the global hybrid B3PW [30] predicted a higher formation energy of 8.74 eV, while LSDA [42] gave a lower value at 7.95 eV. Our HSE value is the lowest among these, yielding a formation energy of 7.43 eV. This decrease in the formation energy is one of the factors leading to a strong competition with (see below).
 - For , the semilocal functional LSDA [42] yields a formation energy of 5.7 eV, making it far more stable than . In contrast, with HSE we predict that Ef = 7.86 eV, meaning that becomes less stable than .
-
remains the most stable defect under these conditions, with HSE providing a value of 2.81 eV compared to the 1.7 eV from LSDA.


Overall, the quantitative formation energy differences between our HSE results and previous LSDA results are substantial. These might originate from the enhanced accuracy we gain with HSE in the calculated valence band width (VBW) and band gap of bulk SrTiO3 (see table 1) identified in [13] to reflect an enhanced precision in the defect formation energies.
It is also worth mentioning size effects. The formation energy of  at point B in a larger supercell of 90 atoms, giving a 1.8%
  concentration, is 7.66 eV, which is 0.2 eV higher than the value obtained with the smaller supercell.
3.2. Isolated vacancies: relaxation effects
Isolated, neutral defects have been introduced into the crystal structure of cubic STO by removing one atom of either O, Sr or Ti, respectively, as depicted in figure 2. The structure was then fully relaxed using HSE/SZVP. Figure 3 illustrates the major displacements in each of the defect structures, namely  and
and  , relative to the idealized crystal. Distance decreases are depicted by black arrows, while increasing lengths are denoted by yellow arrows. In each case, the magnitude of displacement is implied by the size of the arrows: larger/thicker arrows indicate greater deviation from the defect-free structure.

Figure 2. Ideal, crystalline SrTiO3, as observed from the 100 face, where the oxygen anions are in red, the strontium cations are in green and the titanium cations are in blue. Magenta, yellowish and cyan circles highlight the locations of the isolated  ,
,  and
and  defects, respectively.
Download figure:
Standard image
Figure 3. Relaxed SrTiO3 with a single isolated vacancy. Each structure is in the 100 orientation and the location of the vacancy is noted. The distortions induced by  and
and  are highlighted (a)–(c), respectively. Oxygen anions are red, Sr cations are green and Ti cations are blue.
Download figure:
Standard imageA 4%  vacancy was created by removing one oxygen (figure 3(a)) from a 2 × 2 × 2 cell, inducing small, asymmetric bond length changes throughout the cell and an overall decrease in volume relative to the crystal. At the vacancy, the remaining O–Ti bonds all contract but to different extents. Near the vacancy, oxygens move toward nearby strontium, inducing O–Sr bond contractions of up to 5.66 pm. Further from the vacancy, in the regions of the cell behind the defect (and the plane of the figure), strontium appears to migrate inward, toward the vacancy, causing the more distant O–Sr bonds to lengthen by as much as 6.05 pm.
The  structure contracts, and undergoes a tetragonal distortion where the lattice parameters are a = 3.879 and b = c = 3.890 Å, compared to the 3.902 Å in the crystal. A high concentration of oxygen vacancies was identified to be responsible for a similar tetragonal distortion reported experimentally [3] in STO doped with La. It is worth noting that with HSE/SZVP we are able to capture this small tetragonal distortion, corresponding to a c/a ratio of 1.0028. This distortion was also observed in previous LDA calculations [45] for supercells of the same size, but the c/a ratio was not reported.
As seen from figure 3(b), the atomic relaxation around the  induces staggered bond lengths (vertically) and a general contraction of O–Sr bonds, with the large decrease being 1.55 pm, smaller than those observed for O–Sr in the presence of an oxygen vacancy. The alternating distances cause the linear Ti–O–Ti angle to decrease to 173.9°. Again, the defect structure contracts, with all lattice parameters decreasing: a = b = c = 3.880 Å.
The  structure depicted in figure 3(c) shows the axial oxygens experiencing a 9.2 pm decrease in length, while the medial oxygens move away from the vacancy by 0.6 pm. The Sr–O distances shrink over a range of 1.51–5.40 pm. While also asymmetric, these distortions have less of an effect on the cell, with the equilibrium lattice parameters being a = c = 3.892 and b = 3.894. The a/b ratio here is very small, so the structure remains effectively cubic following full relaxation.
In summary, the loss of metallic species results in smaller volumes with the loss of the larger metal,  , producing greater contraction. Removing the oxygen produces larger deviations from cubic symmetry in addition to overall shrinkage of the unit cell.
3.3. Isolated vacancies: band structures
The electronic band structure and the projected densities of states (PDOSs) of the ideal and nonideal/defect STO supercells (doped with O, Sr and Ti neutral vacancies) are shown in figure 4. To allow a clear comparison between the different systems, the VBM was set as reference for all systems while the Fermi energy is depicted with a solid line. The PDOSs are plotted alongside with their corresponding band structure and rescaled in the same way.
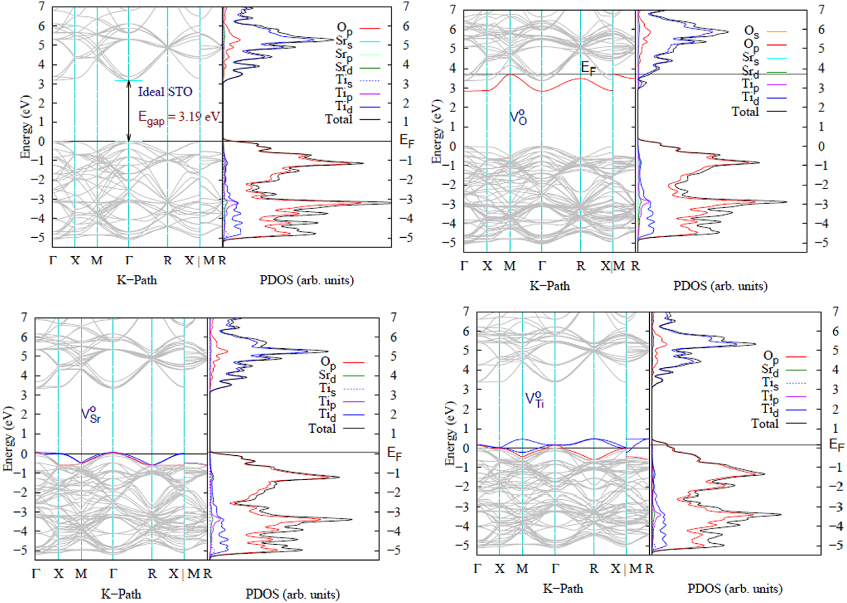
Figure 4. Band structures and PDOSs calculated with HSE/SZVP for the 2 × 2 × 2 SrTiO3 supercell. The top row represents bulk STO and  while the bottom row contains
  and
and  . The Fermi energy EF is indicated by a solid black line. The red bands indicate the occupied defect bands while the unoccupied defect bands are shown in blue.
Download figure:
Standard imageFor the ideal 2 × 2 × 2 STO supercell the Brillouin zone folds, causing a direct band gap of 3.19 eV. The CBM in the ideal solid is triply degenerate at Γ and composed of a heavy electron band (he), a light electron band (le) and a spin–orbit band (so). The band degeneracy is lifted as we move far from the Γ point toward high symmetry directions X,M and R, giving rise to different values of the electron effective masses mhe,mle,mso in each direction. The electronic effective mass for each band i can be computed by the curves of energy versus  being fitted to a parabola [46];
  is taken from the Γ point up to 0.5% along Γ → X,Γ → M and Γ → R paths using the formula
We estimate the Γ → X effective masses, without spin–orbit correction,  and
and  , to be 7.3me and 0.5me respectively, where me is the free electron mass. This agrees well with previous non-relativistic calculations [23, 46, 47] using LSDA and HSE, which predicted he masses ranging from 6.1 to 7.3me and le masses of 0.4me. The remaining effective masses are
  and
and  .
.
Introducing  into STO, the defect band averaged in the Brillouin zone is located at 0.15 eV above the valence band maximum (VBM) and 3.06 eV below the conduction band maximum (CBM) (see table 3). The defect band has a VB character and is triply degenerate at Γ with a single band occupied by two electrons, while the upper two bands are empty (see figure 4). The crystal field resulting from the atomic relaxation around
  causes the triply degenerate CBM band to split in the following way: the heavy electron band (he) is followed by the light electron band (le) at 26 meV, while the spin–orbit band (so) is located 14 meV higher.
Table 3.
Location of the various defect bands averaged in the Brillouin zone with respect to the conduction band minimum (Δ DB–CBM) and valence band maximum (ΔDB–VBM). Data are for the 2 × 2 × 2 SrTiO3 supercell computed with HSE/SZVP. Defect formation energies (in eV) at point B (oxidation condition) are reported as well.
| ΔDB–CBM |
ΔDB–VBM |
Ef | |
|---|---|---|---|

|
3.06 | 0.15 | 7.86 |

|
3.27 | 0.07 | 2.81 |

|
0.44, 0.40a | 2.82, 2.90a | 7.43 |
For  , a triply degenerate defect band appears at 0.07 eV above the VBM and 3.27 eV below the CBM at the Γ point. From figure 4, two bands are occupied by four electrons while the upper band is empty. The degeneracy of the defect band is lifted at the X point, where the two occupied bands remain degenerate while the unoccupied band is 600 meV higher in energy. The he and le bands in the CBM remain degenerate while the so band is located 1.5 meV higher in energy, mainly because the overall deformation
  introduces into the lattice is small.
Table 4.
Non-relativistic HSE/SZVP calculated heavy electron effective masses (in units of the free electron mass me) at the conduction maximum along different high symmetry directions in ideal ( ) and oxygen vacancy doped SrTiO3 (
 ). k∥ and k⊥ represent the parallel and perpendicular planes to the direction of the compressive 100 strain resulting from
  .
.
| Direction |

|

|
|---|---|---|
| Γ → X(100) | ||
| k∥ | 7.3 | 0.5 |
| k⊥ | 7.3 | 11.2 |
| Γ → M(110) | ||
| k∥ | 1.1 | 1.1 |
| k⊥ | 1.1 | 1.1 |
| Γ → R(111) | ||
| 0.9 | 0.9 | |
Introducing  into STO causes a defect band (DB) populated with two electrons to appear in the gap just below the bulk-like conduction band maximum labeled here as DCBM, indicating a donor band. The Fermi energy is shifted from the top of the valence band to the maximum of the defect band at the M point followed by the empty conduction band. The CBM conserves the bulk character as it remains empty and triply degenerate (clearly shown in figure 4), corresponding to the Ti t2g states followed by a doubly degenerate eg band. The above CBM conservation of degeneracy confirms that the band appearing underneath is a fully occupied non-degenerate defect band. The isosurface of the highest occupied state at the Γ special k-point (figure 5) shows that the electronic charge density is localized on
  occupying the Ti dangling bonds.
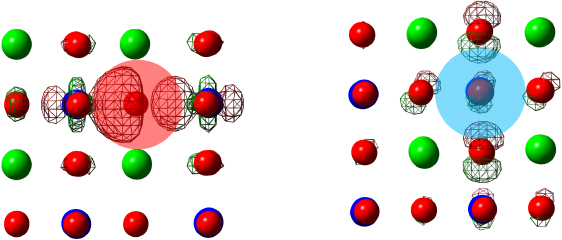
Figure 5. Isosurface of the highest occupied orbitals viewed along the 100 direction showing orbital localization around  (left)
  (right).
Download figure:
Standard imageWe calculated the position of the defect state by averaging over the Brillouin zone. We found that the DB is located on average 0.44 eV below the CBM for the 40 atom supercell (see table 3) and 0.42 eV for the 90 atom supercell. This could be compared with the recent experimental measurements, which place the position of the defect level 0.4 eV below the CBM, causing the blue light photoluminescence of STO at room temperature [3, 48]. In the present calculations, self-defect interaction or the so-called size effects were minimized by keeping the defects neutral, and conserving the same high density of k-point sampling of the Brillouin zone [49]. Nevertheless, simulations using larger supercells and finite size scaling [7] are still needed for a more accurate comparison. With today's computational resources, a full relaxation of larger supercells using HSE/SZVP and the computational settings used here is computationally very expensive. This defect band seems to be shallower than the one computed with B3PW, which was located 0.79 eV below the CBM [30]. We attribute this to the B3PW functional overestimating the band gaps (indirect gap of 3.6 eV compared to 3.2 eV from experiment). Our HSE-predicted defect level for  is deeper than that calculated with LDA; in those calculations the defect band can often not be distinguished from the CBM (resonant band) [45], although in some cases it lies as little as 0.08 eV below the CBM [42].
The atomic relaxation around  leads to a tetragonal distortion of the supercell where c/a = 1.0028 (see section 3.2), corresponding to a −0.3% compressive strain along the X axis. This amount of strain is comparable to the values applied experimentally in La doped STO [24] and identified as causing a substantial increase of the electron mobilities (by a factor of 3.3) due to the appearance of light electron effective mass along the strain and the transport direction.
In our calculation, the effective mass  along the direction parallel to the compressive strain (k∥ = π/a(100)) drops from the bulk value of 7.3 to 0.5 in defective SrTiO3 (see table 4), indicating that the electron mobility increases substantially along the x-axis. However,
  increases along the k⊥ = π/a(010) = π/a(001) directions (perpendicular to the compressive strain) to 11.0, indicating a reduced electron mobility in these directions. Along Γ → M, the effective masses remain unchanged in the k∥ = π/a(110) = π/a(101) containing the strain axis.
3.4. STO doped with La
The substitution of one Sr atom by a La atom in our 2 × 2 × 2 STO supercell led to a dopant concentration of 12.5%, which is low enough to be compared to experimental data [3], where dopant concentrations as high as 15% have been used. The resulting Sr0.875La0.125TiO3 compound relaxes to a cubic structure with lattice parameters a = b = c = 3.893 Å. This agrees well with experiments [3] which demonstrated that La doping conserves the cubic symmetry, and has a negligible effect on the c-axis lattice parameter.
Figure 6 shows the band structure of Sr0.875La0.125TiO3 for spin up and spin down electrons. For the spin up electrons, the VBM is almost triply degenerate with a very small splitting of 7 meV; this is also the case of the lowest CB, a band which is populated with one extra electron and shows a small band broadening (13 meV). The energy difference between the last VB and the first populated CB is 3.16 eV. The next set of conduction bands, normally located at 200 meV above the CBM in the bulk STO, is split into one band 172 meV above the CBM followed by a doubly degenerate band 100 meV higher. Visualization of the isosurface of the highest occupied state at the Γ special k-point shows that the charge density is not localized on the defect site, but rather corresponds to the Ti t2g states. The electronic density of states (not shown) also confirms that the CB remains dominated by Ti 3d states as it does in the STO bulk phase; La 4d starts to contribute to the CBM only about 2.3 eV above the Fermi energy.
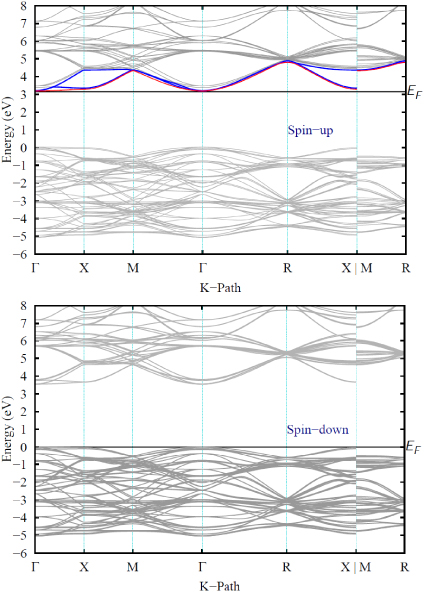
Figure 6. Band structure for spin up (top) and down (bottom) electrons in a 2 × 2 × 2 SrTiO3 supercell doped with La. The Fermi energy EF is indicated by a solid black line. For spin up electrons, one of the triply degenerate bands in the CBM is populated (shown in red) while the remaining empty ones are shown in blue.
Download figure:
Standard imageFor the spin down electrons (bottom of figure 6), the band structure conserves most of the bulk band characteristics with triply degenerate CBM and VBM, but the band gap is larger than the bulk value, measuring 3.55 eV. The heavy electron effective masses relative to the free electron mass ( ) of the lower band or heavy electron (he) band are isotropic and experience a decrease from the bulk value of 7.3 to 6.8 in the Γ → X direction, bringing the
  ratio closer to the experimentally measured values [3] of 6 to 7.1 for 15% La doping. A smaller decrease is observed along the other high symmetry directions.
4. Summary and conclusions
The structural and electronic properties of point defects  and LaSr in SrTiO3 have been computed using the HSE screened hybrid functional. The crystal field splittings of the conduction and valence bands, resulting from the atomic relaxation around the various defects, were evaluated. HSE is known to give an accurate description of the band gap and VBW of SrTiO3, which leads to the assumption that it will also perform well for the defect energetics, as we have shown here. In fact, the locations of the neutral defect bands in the band gap of STO calculated with HSE/SZVP do not suffer from the band gap underestimation problems displayed by semilocal functionals, thus negating the need for further corrections. The wavefunction is localized around
  and
and  as shown for the isosurface of highest occupied orbitals in figure 5 and delocalized for the defect states that almost or completely overlap with host bands such as
  and LaSr. Our calculated defect band positions are represented schematically in figure 7; we present the results this way for ease of use and comparison to subsequent works. The location of the defect level in the band gap of STO indicates that
  is probably at the origin of the blue luminescence of STO, and serves as a double shallow donor under thermal equilibrium. This defect level diagram might serve as a guideline in the interpretation of photoluminescence experiments [1, 3]. For SrTiO3 doped with
  , the calculated conduction band electron effective masses support the proposal of enhanced mobility along the strain directions [24].

Figure 7. Schematic representation of the location of the defect levels in the band gap of SrTiO3 calculated with HSE/SZVP. Numbers and arrows refer to the location of the defect band with respect to the nearest bulk-like bands.
Download figure:
Standard imageFinally, with its two fixed and unmodified parameters, the HSE functional gave a reliable description of the electronic structure for STO and its defects, in agreement with the findings in [12, 50]. It would be very interesting to extend the present study for larger supercells followed by a finite size scaling. This would enable assessment of the robustness of the present agreement we get with experiment and allow a better comparison by performing double doping with La and  .
.
Acknowledgments
This work is supported by the Qatar National Research Fund (QNRF) through the National Priorities Research Program (NPRP 08-431-1-076). We are grateful to the research computing facilities at Texas A&M University at Qatar for generous allocations of computer resources.
Footnotes
- 5
Point A: μO = μO (bulk),μSr + μO = μSrO(bulk) where μO(bulk) corresponding to the chemical potential per atom of O2 gas. Point B: μO = μO (bulk),μTi + 2μO = μTiO2 (bulk). Point C: μTi + 2μO = μTiO2 (bulk),2μTi + 3μO = μTi2O3 (bulk). Point D: μTi + μO = μTiO (bulk),2μTi + 3μO = μTi2O3 (bulk). Point E: μTi + μO = μTiO (bulk),μTi = μTi (bulk). Point F: μTi = μTi (bulk),μSr = μSr (bulk). Point G: μSr = μSr (bulk),μSr + μO = μSrO (bulk).