

Abstract
Cells exposed to thermal neutrons are simultaneously damaged by radiations with high and low linear energy transfer (LET). A question relevant for the assessment of risk of exposure to a mixed beam is whether the biological effect of both radiation types is additive or synergistic. The aim of the present investigation was to calculate whether the high and low LET components of a thermal neutron field interact when damaging cells. Human peripheral blood lymphocytes were exposed to neutrons from the HB11 beam at the Institute for Energy and Transport, Petten, Netherlands, in a 37 °C water phantom at varying depths, where the mix of high and low LET beam components differs. Chromosomal aberrations were analysed and the relative biological effectiveness (RBE) values as well as the expected contributions of protons and photons to the aberration yield were calculated based on a dose response of aberrations in lymphocytes exposed to 60Co gamma radiation. The RBE for 10 dicentrics per 100 cells was 3 for mixed beam and 7.2 for protons. For 20 dicentrics per 100 cells the respective values were 2.4 and 5.8. Within the limitations of the experimental setup the results indicate that for this endpoint there is no synergism between the high and low LET radiations.
Export citation and abstract BibTeX RIS
1. Introduction
Interaction of low energy neutrons with living matter leads to exposure of cells to a mixed field of high and low linear energy transfer (LET) radiation that is composed of protons and gamma radiation. The major source of protons is the capture of neutrons in nitrogen in the reaction 14N+1n=14C+1p + 0.63 MeV (cross-section: 1.84 barn) (Podgorsak 2010). Moreover, neutrons with kinetic energies above 100 eV interact in an elastic manner with hydrogen to produce recoil protons, whereby about 50% of the neutron kinetic energy is transferred to the protons (Podgorsak 2010).
The low LET component is referred to as induced gamma radiation that is produced via capture of thermal neutrons by atomic nuclei, mainly hydrogen: 1H+1n=2H + γ + 2.20 MeV (cross-section: 0.33 barn) (Gambarini et al 2000). Other possible reactions where gamma radiation is induced are 14N(n,γ)15N (cross-section: 79.8 mbarn) and 16O(n,γ)17O (cross-section: 0.19 mbarn) (Gambarini et al 2000, IAEA 2006). The low LET component of the beam is often augmented by the fact that epithermal and thermal beams are generated in a nuclear reactor and are accompanied by gamma radiation that is generated in the reactor core (Moss et al 1997). This gamma beam is referred to as incident gamma.
The biological effects of the high and low LET dose components are generally assumed to be independent of each other. While data exist on the relative biological effectiveness (RBE) of neutrons of variable energies (Hall et al 1975), not much is known on the possible interaction mechanisms between the gamma component and the high LET component of a given neutron beam. To the best of our knowledge ten studies have been published where the effect of sequential irradiation with fast neutrons and x-rays on clonogenic cell survival has been analysed (Durand and Olive 1976, Higgins et al 1983, 1984, Hornsey et al 1977, 1984, Masuda 1970, McNally et al 1984, Ngo et al 1977, Railton et al 1975, Suzuki 1993). The results of all these studies suggest a synergistic interaction between the two types of radiation, meaning that the effect of sequential exposure is higher than expected. In one study, where the level of cytogenetic damage in human peripheral blood lymphocytes was studied, no interaction between fast neutrons and x-rays was seen (Wuttke et al 1998).
Generally speaking, a synergistic (interacting) action of two agents on the cell can occur via two mechanisms: through potentiating the level of damage or through impairing the cellular mechanisms of damage repair. A good example of the former is the interaction of oxygen with ionising radiation (Giles and Riley 1950, Wardman 2007, Bristow and Hill 2008), while a good example of the latter is the interaction of metals with ionising radiation (Nias 1985, Skov 1987, Wang et al 2010). In the case of combined action of two radiation types there is no reason to assume that the level of initial DNA damage differs from additivity, because the level of damage is directly proportional to the amount of energy absorbed by the cell. However, it is possible that the simultaneous action of the two radiation types leads to a change of damage quality (an increased damage complexity) or that the damage induced by one radiation engages the DNA repair machinery to such an extent that the damage induced by the second radiation is not repaired properly.
Experiments aiming at analysing the possible interaction between the high LET component of a thermal neutron field and low LET radiation are somewhat difficult to perform because it is impossible to obtain a pure high LET field component. The only approach is to calculate the effects of the single field components. Recently, Mason et al (2011) calculated the RBE values of thermal neutrons in the fields of two epithermal neutron sources. The analysis of clonogenic cell survival revealed very high RBE values for one source, an observation that was interpreted by the authors as evidence for a synergistic interaction between the damage produced by the high and low LET components of the field.
Analogously to Mason et al (2011), the aim of the present investigation was to calculate whether the high (protons) and low (photons) LET components of an epithermal neutron beam interact when damaging cells. The rationale for the investigation was that, although it is impossible to separate the contribution of the low LET gamma radiation and the high LET proton radiation in the neutron beam, it is possible to make a calibration dose–response curve with a pure gamma radiation source and use this curve as a proxy for the gamma radiation in the neutron beam to calculate a calibration curve for the contribution of the proton radiation in the neutron beam in a fixed exposure setting. These calibration curves can then be used to compare calculated responses with measured responses in different exposure situations where the proportions of the gamma radiation and proton radiation in the neutron beam differ considerably from those in the calibration position.
A suitable source of neutrons was the HB11 beam of the high flux reactor (HFR) of the Joint Research Centre (JRC), Institute for Energy and Transport, Petten, Netherlands. The beam was constructed to treat patients by boron neutron capture therapy (BNCT) (Moss et al 1997, Nievaart et al 2006, Sauerwein et al 1999) and is very well characterised (Rassow et al 2001, Liu et al 2009). By means of a well-defined source term the energies and dose rates of the different beam components can be calculated using the Monte Carlo code MCNPX (Monte Carlo N-particle extended).
Human peripheral blood lymphocytes (PBLs) were exposed to neutrons in a 37 °C water phantom at varying depths, where the mix of proton and photon dose components differs. Chromosomal aberrations were analysed and the expected contribution of neutrons and photons to the aberration yield was calculated based on a dose response of aberrations in lymphocytes exposed to 60Co gamma radiation. Differences in the dose rate between the 60Co source and the neutron beam were accounted for by applying the G function (Lea and Catcheside 1942). The results indicate that there is no interaction between the damage produced by high and low LET radiation.
2. Materials and methods
2.1. Blood donors and blood collection
Peripheral blood was collected by venipuncture from healthy male and female donors. There were four male donors: 1—age 48, non-smoker; 2—age 33, non-smoker; 3—age 49, light smoker, 4—age 40, non-smoker, and two female donors: 5—age 26, light smoker and 6—age 27, non-smoker. Each experiment was performed with blood from two donors, where donor 1 was always one of the donors. The blood was either collected on the day preceding the experiment or in the morning of the day of the experiment.
2.2. Nomenclature of the dose components
Due to the complexity of the HB11 beam components it will be helpful to define the following terms: incident gamma radiation=photons produced in the reactor and present in the HB11 beam; induced gamma radiation=photons produced by neutron capture; proton dose=dose from elastic scattering and capture of neutrons; mixed beam dose=total dose from protons + incident gamma + induced gamma radiation; 60Co dose=gamma dose from exposing cells to the 60Co source.
2.3. HB11 beam irradiation setup and dose calculations
Irradiation with the mixed beam of neutrons and photons was performed with the HB11 beam of the High Flux Reactor, Institute for Energy and Transport, Petten, Netherlands. The beam was built for the purpose of BNCT (Moss et al 1997, Nievaart et al 2006). The incident gamma radiation component of the beam is reduced by the use of an argon filter and its dose rate at 2 cm depth in the water phantom is 0.42 Gy h−1. The beam is 'highly directed', has a very small divergence (2°), and is circular in cross-section due to beam collimators of diameters 8, 12 and 15 cm. In our experiments, the 15 cm collimator was used. The total neutron flux is 3.78 × 108 cm−1 s−1 (Liu et al 2009) and the composition of thermal ( < 10−3 keV), epithermal (10−2–101 keV) and fast neutrons ( > 102 keV) is shown in figure 1. The beam is mainly composed of epithermal neutrons which thermalise in the water phantom so that cells are exposed to a thermal neutron field.
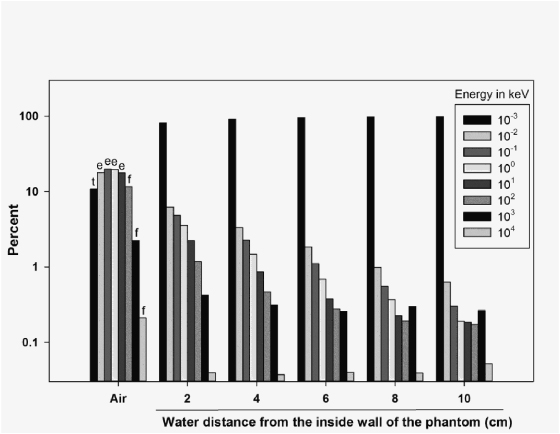
Figure 1. Spectra of neutron energies (expressed as per cent of the total flux) in air and at different distances from the inside wall of the water phantom. Here, t stands for thermal neutrons, e stands for epithermal neutrons and f stands for fast neutrons.
Download figure:
Standard imageBefore irradiation, the blood was aliquoted in 1.5 ml standard polyethylene Eppendorf tubes (Sigma-Aldrich), whereby care was taken to fill the tubes completely, leaving no air bubbles below the caps. The tubes were irradiated in a plexiglas phantom (h: 23 cm, w: 24 cm, l: 24 cm) that was filled with distilled water at a constant temperature of 37 °C. The tubes were positioned in two rows (0.5 cm apart, each row corresponding to blood from one donor), 2 cm below the water surface, at different distances from the phantom wall. The phantom position was adjusted so that the horizontal beam was centred between the two rows of blood tubes.
The doses from the protons and photons absorbed by the blood samples and the neutron energy distributions were calculated using the Monte Carlo code MCNPX (Monte Carlo N-particle extended, Los Alamos National Laboratory, USA) taking into account the phantom geometry and the neutron flux on the day of exposure. The content of N and H in the blood was taken from ICRU Report 46 (ICRU 1992).
2.4. Gamma irradiation setup, dosimetry and doses
Gamma irradiation was carried out at the Holy Cross Cancer Centre in Kielce, Poland with a therapeutic 60Co irradiation facility (Theratron Elite 80, MDS Nordion, Canada, dose rate: 1 Gy min−1). The blood was aliquoted in 1.5 ml standard polyethylene Eppendorf tubes (Sigma-Aldrich) and positioned in a water phantom that was filled with distilled water at a constant temperature of 37 °C, 2 cm below the water surface. Dosimetry was performed with an ionisation chamber attached to a UNIDOS (PTW, Germany) dosimeter.
2.5. Blood irradiation, lymphocyte culture and chromosome preparation
The blood was kept at 37 °C for 20 min before irradiation at each facility (HB11 beam and 60Co photons). Irradiations with the HB11 beam were carried out with samples at water depths of 2–18 cm. Five experiments were conducted where (1) the blood was irradiated with an increasing mixed beam dose at a water depth of 2 cm with the highest proton component; (2) the blood was irradiated at different water depths whereby the mixed beam dose was kept constant at 1 Gy; (3) the blood was irradiated at different water depths whereby the gamma dose was kept constant at 1 Gy; (4) the blood was irradiated at different water depths whereby the proton dose was kept constant at 0.5 Gy; and (5) the blood was irradiated at different water depths whereby the exposure time was kept constant at 22 min. The experiment with pure photons was carried out using the 60Co source with the following doses: 0.0; 0.25; 0.5; 1.0; 1,5; 2.0; 2.5 and 3 Gy.
Following irradiation whole blood cultures were set up by adding 0.5 ml of blood to 4.5 ml of complete medium (80% Roswell Park Memorial Institute (RPMI)-1640 medium (Sigma-Aldrich), 20% foetal calf serum (FCS), 10 μg ml−1 phytohaemagglutinin (Invitrogen-Gibco), 100 U ml−1 penicillin and 100 μg ml−1 streptomycin (Invitrogen-Gibco)). Five hours after setup, 20 μM 5-bromo-2'-deoxyuridine (BrdU) (Sigma) was added and left until harvesting. The cultures were incubated at 37 °C for 50 h. Colcemid (Sigma-Aldrich) at a concentration of 5 μg ml−1 was added for the last 3 h. The cells were harvested according to a standard procedure. The cells were swollen in 0.075 M KCl solution at 37 °C for 15 min and fixed in 3:1 methanol:acetic acid. Lymphocytes were spread on clean and humid slides and dried overnight. The dry slides were stained by the fluorescence plus Giemsa (FPG) technique (Goto et al 1978).
2.6. Chromosome scoring, aberration calculations and statistical analysis
The slides were coded and the frequencies of dicentric chromosomes were assessed in first-division metaphases. At least 100 metaphases per dose point and experiment were scored. Only in one case (figure 6, 2 cm depth) were 82 metaphases found.
The dose–response relationship for the mixed beam was fitted by a linear function (least-square method, SigmaPlot 12, Systat Software Inc., USA). The dose response for 60Co photons was fitted by a linear-quadratic function (maximum likelihood (Deperas et al 2007)). The dose–response relationship for protons was calculated as follows: the contribution of photons and protons to the total dose in the neutron beam is known from the Monte Carlo calculations (see section 2.3). Based on the 60Co calibration curve, the dicentric yield corresponding to the photon dose was calculated for total doses of 0.25, 0.5, 1, 1.5 and 1.7 Gy. This yield was subtracted from the observed yield. The remaining dicentric yield was assumed to be induced by protons and was plotted against the calculated proton dose. For example, for the total dose of 1 Gy where we found 28 dicentrics in 100 cells, 6 dicentrics were attributed to the photon dose of 0.7 Gy and the remaining 22 dicentrics were attributed to the proton dose of 0.3 Gy. The obtained results were fitted by a linear function (least-square method, SigmaPlot 12, Systat Software Inc., USA). The relative biological effectiveness (RBE=ratio of gamma dose to mixed beam and proton dose) was calculated for the levels of 10 and 20 dicentrics per 100 cells as well as for the α coefficients of the fit parameters.
The fraction of aberrations induced by gamma radiation in the mixed beam was calculated based on the 60Co dose–response curve. To this end the dose–response curve was modified by using the G function in order to take into account the lower, as compared to the 60Co beam, dose rate of the gamma radiation in the neutron beam. The G function is a time-dependent factor that enables modification of the dose-squared coefficient of the dose–response curve and thus allows for the effects of dose protraction (Bauchinger et al 1979, Lloyd et al 1984). The G function was used to calculate aberrations at every water depth inside the phantom. In accordance with Lloyd et al (1984) a value of 120 min was assumed for t0—the mean lifetime of breaks. The remaining aberrations were attributed to protons. The 95%-confidence limits of the observed aberration frequencies were calculated by the NETA program that takes into account the distribution of dicentrics (Morand et al 2008).
3. Results
3.1. Characteristics of the neutron beam
The spectra of neutron energies in air and as a function of water depth are shown in figure 1. At all depths over 90% of neutrons were thermal with fast neutrons contributing about 5% of the total neutron number.
3.2. Dose–response curves and RBE of the mixed beam and of protons
The dose–response curves for dicentric chromosomes are shown in figure 2. The 60Co data points were best fitted to the equation Y = c + αD + βD2, whereby the coefficients c, α and β were 0, 0.055 and 0.035, respectively (table 1). By applying the G function the β-term was reduced to a maximum of 0.028 for the highest water depth of 18 cm. The mixed beam data were fitted by the linear equation Y = c + αD, whereby the coefficients c and α were respectively 0 and 0.28 for the mixed beam and 0 and 0.67 for protons (table 1). The proton dose response showed a slight saturation curvature resulting from the subtraction of the linear-quadratic 60Co curve from the mixed beam curve.
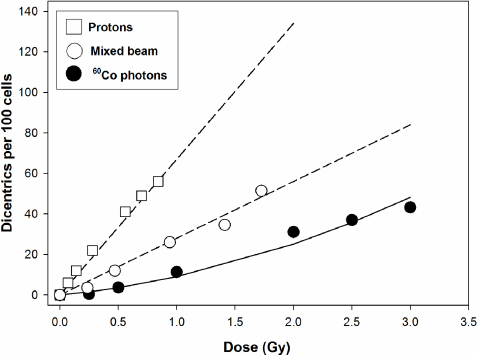
Figure 2. Dose–response curves for 60Co photons, the mixed beam (determined at a water depth of 2 cm) and calculated protons.
Download figure:
Standard imageTable 1. Linear (α) and quadratic (β) coefficients and goodness of fit parameters for the mixed beam, 60Co gamma radiation and the calculated protons. Values in brackets: standard deviations.
| Radiation type | α (std) | β (std) | R2 |
|---|---|---|---|
| Mixed beam | 0.297 (0.002) | — | 0.98 |
| 60Co photons | 0.055 (0.023) | 0.035 (0.010) | 0.95 |
| Protons | 0.669 (0.002) | — | 0.99 |
The following RBE values were calculated for 10 dicentrics per 100 cells: 3 for the mixed beam and 7.2 for protons. For 20 dicentrics per 100 cells the respective values were 2.4 and 5.8. The RBE values calculated for the α coefficients of the fit parameters were 5.40 for the mixed beam and 12.16 for protons.
3.3. Observed and expected dicentric yields in cells exposed to the mixed beam
The results of experiments where the blood was irradiated with different doses at different water depths are shown in figures 3–6. The expected yields of dicentrics induced by protons and photons were calculated from the dose–response curves shown in figure 2. Depending on the water depth, the blood samples received a variable mix of protons and photons. As expected, the contribution of protons in the induction of dicentrics decreased with increasing water depth. Only in 3 out of 18 dose points did the observed yield of dicentrics significantly differ from the expected yield. In two cases, figure 4: 2 and 4 cm, the observed yield was higher than expected and in one case, figure 5: 6 cm, it was lower. From these data we conclude that there is no indication of a synergistic interaction between the effects of protons and photons.
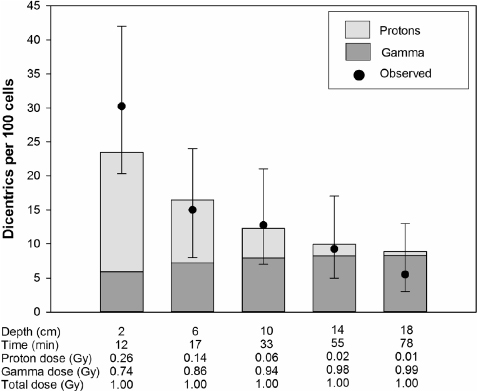
Figure 3. The total dose was kept constant at 1 Gy. The depth indicates the distance from the inside wall of the water phantom. The bars represent the expected dicentric yields. The light shaded areas of the bars indicate dicentrics induced by protons and the dark shaded areas ones induced by photons. The circles represent the observed dicentric yields. The error bars indicate 95% confidence limits.
Download figure:
Standard image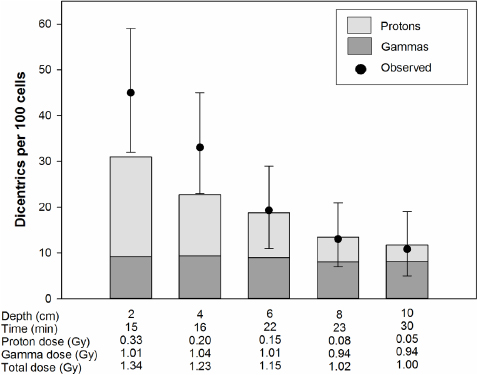
Figure 4. The gamma dose was kept constant at 1 Gy. The depth indicates the distance from the inside wall of the water phantom. The bars represent the expected dicentric yields. The light shaded areas of the bars indicate dicentrics induced by protons and the dark shaded areas ones induced by photons. The circles represent the observed dicentric yields. The error bars indicate 95% confidence limits.
Download figure:
Standard image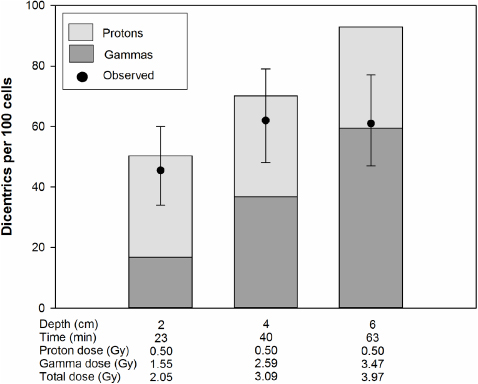
Figure 5. The proton dose was kept constant at 0.5 Gy. The depth indicates the distance from the inside wall of the water phantom. The bars represent the expected dicentric yields. The light shaded areas of the bars indicate dicentrics induced by protons and the dark shaded areas ones induced by photons. The circles represent the observed dicentric yields. The error bars indicate 95% confidence limits.
Download figure:
Standard image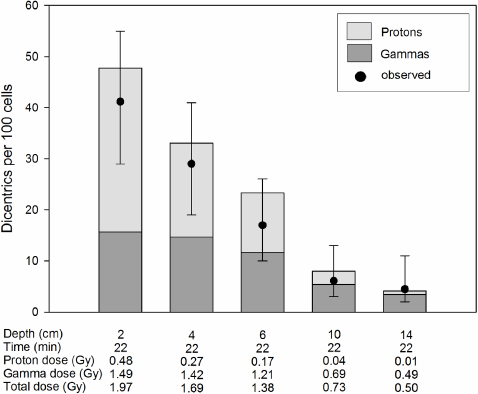
Figure 6. The irradiation time was kept constant at 22 min. The depth indicates the distance from the inside wall of the water phantom. The bars represent the expected dicentric yields. The light shaded areas of the bars indicate dicentrics induced by protons and the dark shaded areas ones induced by photons. The circles represent the observed dicentric yields. The error bars indicate 95% confidence limits.
Download figure:
Standard image4. Discussion
The aim of the study was to analyse the possible interaction between the high (protons) and low (photons) LET components of a thermal neutron field. Based on the effect of a 60Co gamma beam, we calculated the RBE of beam protons and compared the observed aberration frequencies with the calculated, expected frequencies.
The common strategy in studying the possible interaction between two DNA damaging agents is to expose cells to the individual agents as well as to a combination of both. Taking into account differences in the dose–response curves, the expected biological effect can then be calculated (Steel and Peckham 1979, Streffer and Muller 1987). The problem with attempting to delineate the effects of high and low LET components of thermal neutrons is that it is impossible to irradiate cells with the isolated beam components because neutrons interact with atoms to produce both the low LET photons and the high LET protons. The only possibility is to irradiate cells with photons from a pure gamma source and with protons from a pure proton source. While irradiating cells with photons is straightforward, for example, with a 60Co source, the choice of the appropriate protons is more difficult. The reason for this is that the linear energy transfer (LET) of a proton changes along its track (Podgorsak 2010) and the question arises of which LET value to choose. Protons are generated by capture and by scattering of neutrons so cells irradiated with a neutron beam are exposed to a mixture of different proton energies and LET values. Such a mixed field of protons is impossible to simulate with an external proton beam. In view of this, we chose to only irradiate cells with the pure low LET component and to calculate the expected frequencies of aberrations induced by the pure high LET component.
This strategy allows calculation of the RBE value of protons in the neutron beam. It was 7.2 for 10 dicentrics per 100 cells and 5.8 for 20 dicentrics per 100 cells. These values are in fairly good agreement with the RBE of 6.1 observed at the level of aberrations for 880 keV protons with an LET of 28 keV μm−1 (Mognato et al 2003) and with RBEs calculated for clonogenic survival in cells irradiated with low energy protons of different LETs (Belli et al 1989). As stated above it is not possible to determine the LET of the protons in the mixed beam as protons are produced inside the blood sample.
An RBE value can also be derived from the α coefficients of the dose–response fits to 60Co photons and the calculated protons. The result of such a calculation is 12.16. In an approach similar to ours, Mason et al (2011) calculated an RBE value of 14.5 for clonogenic survival of cells exposed to the proton component of thermal neutrons generated in the Studsvik (Sweden) reactor and an RBE of 7.05 for the thermal neutrons generated in the Birmingham (UK) accelerator. The high RBE value of the Studsvik beam as compared to the Birmingham beam was explained by a higher contribution of fast neutrons in the former beam and interpreted by the authors as evidence for a synergistic interaction between the low and high LET components of the beam. Because we only had a single neutron beam available, we chose a different approach to test whether the low and high dose components of the neutron beam interact: based on the 60Co dose–response curve and the known contributions of photons and protons to the total dose in the mixed beam, we calculated the expected frequencies of aberrations induced by the photons and protons and compared them with the observed yields. PBLs were irradiated at different depths in the water phantom, with different ratios of photon to proton doses. The rationale for doing this was that if there is an interaction between the two beam components, its extent will likely vary with varying ratio of photons to protons. It is logical to assume that the highest interaction will occur when both beam components equally strongly contribute to the dose. This is the case at a water depth of 2 cm, where the thermal neutron dose component is at its maximum. Consequently, should an interaction occur, it is expected to decline with increasing water depth, when the contribution of protons to the dose declines. No such pattern was observed and we conclude that the two beam components do not interact. This conclusion is in line with the hypothesis that it is the number and not the molecular structure of DNA double-strand breaks that is decisive for the formation of chromosomal aberrations (Obe et al 2010). In view of this we do not interpret the RBE of 12.16 calculated for the α coefficients of the dose–response fits to 60Co photons and the calculated protons as indicative of a synergy between the high and low LET components of the beam.
A comment is needed on the comparison of the expected and found frequencies of dicentrics at the water depth of 2 cm. We calculated the expected frequency of dicentrics based on the 60Co calibration curve and the neutron dose–response curve that was generated by irradiating blood samples at the same water depth of 2 cm. This gives the impression that the procedure is, in fact, circular. Why then do we expect (and see) differences between the expected and observed dicentric yields at this depth? The procedure is not circular because the calculated photon-attributed dicentrics are based on the pure photon, 60Co calibration curve. In one experiment (figure 3) we did see a significant deviation of the found dicentric yield from the expected yield; however, we do not interpret this as synergism. The reason for this is that such deviation was not observed in the other experiments (figures 4–6) and the decision about whether the difference is significant or not was based on calculating the 95% confidence intervals for the observed dicentric yields. Inherent to this procedure is the assumption that 5 out of 100 repeated results can, by chance, be outside of the confidence interval. So based on the fact that we observed this difference only once, and it also did not occur at other water depths (being marginal at 4 cm—figure 4) we conclude that there was no synergism between the high and low LET components of the neutron beam even at the water depth of 2 cm.
The consequence of exposing cells to the mixed beam at different depths in the water phantom is that the dose rate declines with water depth. Decreasing the dose rate has a sparing effect on the detrimental effects of radiation because the cells gain time to repair sublethal irradiation damage taking place over the period of exposure (Hall and Bedford 1964). Apparently, this makes it difficult to compare the results from irradiations at different water depths. Mason et al (2011) chose to irradiate cells at 4 °C because it was shown that the repair of DNA damage is inhibited at this temperature (Ward et al 1991). We decided to perform experiments at 37 °C because low temperature at exposure has a pronounced sparing effect on the level of cytogenetic damage in PBLs (Bajerska and Liniecki 1969, Gumrich et al 1986, Brzozowska et al 2009). Indeed, a sparing effect of low temperature was also noted by Mason et al (2011) at the level of clonogenic cell survival. Although the mechanisms of the sparing effect of hypothermia are not understood (Brzozowska et al 2009, Dang et al 2012), its strong impact on the radiation effect suggests that results obtained in cells exposed at low temperature may not be fully relevant to in vivo exposure of cells and tissues at 37 °C. Consequently, in view of the fact that one rationale for performing cell experiments on the effect of mixed beams is to better understand the risks associated with treating patients with BNCT (Coderre and Morris 1999, Barth et al 2005), it appears advisable to perform experiments at the physiological temperature of 37 °C.
It is known that the detrimental effect of radiation, i.e. also the frequency of chromosomal aberrations, decreases with decreasing dose rate. The dose rates used in our experiments ranged from 1 Gy min−1 (60Co photons) to 0.013 Gy min−1 (mixed beam at a water depth of 18 cm) and the question arises of how these differences should be accounted for. Lea and Catcheside (1942) introduced a method to adjust the expected frequency of aberrations in cells exposed to radiation at different dose rates. It is based on calculating a time-dependent factor known as the G function. It can be assumed that one-track damage, that results in linear dose responses (corresponding to the alpha term of the linear–quadratic dose response), shows no dependence on dose rate, while two-track lesions (corresponding to the beta term of the linear–quadratic dose response) are reduced in magnitude by reducing the dose rate (Sachs et al 1997, Sachs and Brenner 1998). The reason for this is that aberrations of two-track origin can be modified by repair mechanisms that have time to operate during the course of a protracted exposure. It was shown that the decrease in the frequency of aberrations appears to follow a single exponential function with a mean time of about 2 h (Lloyd et al 1984). We used the value of 2 h as the mean lifetime of breaks and applied the G function to account for differences in dose rate when calculating the expected frequencies of dicentrics induced by photons in the neutron beam. Application of the G function did not result in significant reduction of the expected aberration yields, which is in accordance with the results of Bauchinger et al (1979) who analysed the dose rate dependence of the dicentric yield after gamma irradiation of PBLs and found no significant difference in the aberration yield induced by doses below 1.5 Gy delivered at dose rates of 0.5 and 0.017 Gy min−1. Thus, it can be assumed that the variable dose rates in our experimental setup have no effect on the interpretation of results.
As mentioned in section 1, a number of studies have been published on the effect of sequential irradiation with fast neutrons and x-rays. Synergistic effects were observed with clonogenic cell survival as the endpoint (Durand and Olive 1976, Higgins et al 1983, 1984, Hornsey et al 1977, 1984, Masuda 1970, McNally et al 1984, Ngo et al 1977, Railton et al 1975, Suzuki 1993) and additivity with a cytogenetic endpoint (Wuttke et al 1998). The reason for this discrepancy is not clear. Experiments with a combination of other radiation types also yielded inconsistent results with some pointing towards synergism (Bird et al 1983, Brooks et al 1990, Zhou et al 2006, Bennett et al 2007, Hada et al 2007, Staaf et al 2012a) and others pointing towards additivity (Barendsen et al 1960, Raju and Jett 1974, Furusawa et al 2002, Phoenix et al 2009, Staaf et al 2012b). Obviously, more studies are needed to better understand the impact of mixed beams on cells.
In summary, our results suggest no interaction between the cytogenetic effects of a combination of high and low LET radiation in a thermal neutron beam. This conclusion is based on a number of assumptions and can in no way be considered general. For example, it is possible that, as shown by (Mason et al 2011), a different result could be obtained with a beam of more energetic neutrons. Nevertheless, we think that our data provide a further piece of evidence on the complex puzzle of the biological effects of combined exposure to high and low LET radiation.
Acknowledgments
We are grateful to Dr Ewald Rutten from the Medical Centre Alkmaar for help with blood collection and to the anonymous reviewer for their excellent comments. This work was supported by the European Commission's 'Quality of Life and Management of Living Resources' Programme, contract no. QLK3-CT-1999-01067.