
Abstract
Photodynamic therapy (PDT) can be a highly complex treatment, with many parameters influencing treatment efficacy. The extent to which dosimetry is used to monitor and standardize treatment delivery varies widely, ranging from measurement of a single surrogate marker to comprehensive approaches that aim to measure or estimate as many relevant parameters as possible. Today, most clinical PDT treatments are still administered with little more than application of a prescribed drug dose and timed light delivery, and thus the role of patient-specific dosimetry has not reached widespread clinical adoption. This disconnect is at least partly due to the inherent conflict between the need to measure and understand multiple parameters in vivo in order to optimize treatment, and the need for expedience in the clinic and in the regulatory and commercialization process. Thus, a methodical approach to selecting primary dosimetry metrics is required at each stage of translation of a treatment procedure, moving from complex measurements to understand PDT mechanisms in pre-clinical and early phase I trials, towards the identification and application of essential dose-limiting and/or surrogate measurements in phase II/III trials. If successful, identifying the essential and/or reliable surrogate dosimetry measurements should help facilitate increased adoption of clinical PDT. In this paper, examples of essential dosimetry points and surrogate dosimetry tools that may be implemented in phase II/III trials are discussed. For example, the treatment efficacy as limited by light penetration in interstitial PDT may be predicted by the amount of contrast uptake in CT, and so this could be utilized as a surrogate dosimetry measurement to prescribe light doses based upon pre-treatment contrast. Success of clinical ALA-based skin lesion treatment is predicted almost uniquely by the explicit or implicit measurements of photosensitizer and photobleaching, yet the individualization of treatment based upon each patients measured bleaching needs to be attempted. In the case of ALA, lack of PpIX is more likely an indicator that alternative PpIX production methods must be implemented. Parsimonious dosimetry, using surrogate measurements that are clinically acceptable, might strategically help to advance PDT in a medical world that is increasingly cost and time sensitive. Careful attention to methodologies that can identify and advance the most critical dosimetric measurements, either direct or surrogate, are needed to ensure successful incorporation of PDT into niche clinical procedures.
Export citation and abstract BibTeX RIS

Original content from this work may be used under the terms of the Creative Commons Attribution 3.0 licence. Any further distribution of this work must maintain attribution to the author(s) and the title of the work, journal citation and DOI.
1. Introduction
In this review, an analysis was undertaken about how dosimetry issues may improve or may inhibit the success of photodynamic therapy (PDT) in clinical procedure development, and how strategically reducing the overhead of dosimetry can benefit trials as they progress beyond the safety assessment stage. PDT is a light activated chemotherapy (Kessel 1992, Dougherty et al 1998, Celli et al 2010, Agostinis et al 2011), used to kill tissue, in which optically activated photosensitizer molecules are excited to a triplet state, which is quenched by molecular oxygen, producing singlet oxygen. Singlet oxygen can be produced in high yield by the cycling of the photosensitizer molecules from significant amounts of light irradiation, and ultimately tissue destruction occurs. The light delivery is usually highly confined to the prescribed treatment volume of tumor tissue, and the factors that affect outcome are the amount of each key component throughout the volume to be treated, including the photosensitizer, light fluence delivered (Wilson and Patterson 1986, 2008) and availability of oxygen for quenching (Foster and Gao 1992, Zilberstein et al 1997, Georgakoudi and Foster 1998b, Edrei and Kimel 1999, Bajgar et al 2014). There are many different photosensitizers (Ochsner 1997), each of which has particular strengths and weaknesses, and has undergone niche application developments in treatment (Hammer-Wilson et al 1999). While there are very successful clinical treatments today (Patel et al 2014), comparatively these are few relative to the vast body of published clinical trials where PDT has been evaluated.
Unfortunately, the most common outcome in PDT clinical trials has been the failure of each procedure to reach a critical mass of adoption by practitioners. In cases where advanced phase I/II clinical trials have not led to adoption, some of these failures are tied to the delivery and control processes required, as well as the variability in clinical responses due to uncontrolled dose delivery, resulting in a lack of perceived value in the technique. In commercial applications, it is generally believed that the simplest PDT procedures, delivered without the need for dosimetry measurements or tools (i.e. PDT for skin actinic keratosis) are the preferred way to achieve clinical acceptance. This is a logical perspective; however, delivery problems or unpredicted results with these spartan procedures often go unexplained. Ultimately, this can lead to the lack of wider adoption in that clinical specialty area, because the treatment is associated with unpredictable response rates or a failure to control the disease. Dosimetry describes the quantitative planning and verification processes used to prescribe and verify a patient treatment, which will ensure that the targeted areas are given appropriate dose to kill the tissue, and to prevent over-treatment to normal tissues, avoiding morbidity issues (e.g. stricture formation from esophageal PDT) (Wilson et al 1997). From this perspective, dosimetry is undoubtedly one of the most important issues for patient safety in localized physical treatments such as PDT. Both under-treatment of the targeted tissue and/or over-treatment of surrounding healthy tissue at risk can lead to lack of enthusiasm for PDT treatment adoption. In both cases, the judicious use of a clinically acceptable dosimetry process, which is not too cumbersome to implement, and ideally utilizes clinically known procedures for measurements, would provide assurance that treatment was being delivered as intended. Dosimetry research tends to push towards an explicit solution where all possible parameters are measured—yet, a heavy-handed approach can also lead to lack of clinical enthusiasm due to the complexity in implementing the additional measurements. In this review, we propose what we believe is a possible balancing point between using complete dosimetry in mechanistic studies and even early phase trials, and the minimally-sufficient approach to dosimetry in later stage clinical trials and clinical practice. This is done by determining the key factor governing dose delivery and either directly measuring that in all cases, or finding an alternative clinical surrogate measurement.
Unfortunately, because the deposition of PDT dose to biological tissue occurs at the micro-environmental level (i.e. based on the interactions of photosensitizer, molecular oxygenation, and light distribution within cellular ultrastructural components) (Evans et al 2011, Anbil et al 2013, Rizvi et al 2013) the variability in cumulative delivery can be high on both the microscopic scale as well as between subjects (Zhou et al 2006). In this review, we outline efforts to apply explicit dosimetry to map the distributions of light delivery, photosensitizer concentration, blood flow and tissue oxygen concentration. Secondarily, we briefly review efforts towards implicit dosimetry to measure or map photosensitizer fluorescence photobleaching or singlet oxygen luminescence, as direct end products that are more closely related to dose. Finally, we examine the potential to use conventional clinical modalities, such as optical imaging, contrast x-ray computed tomography (CT), ultrasound (US), magnetic resonance imaging (MRI), and tissue and blood sampling, as patient-specific surrogate PDT dosimetry tools. Because these modalities are widely used for patient workup, management of cancer, and assessment of treatment efficacy, their adaptation to PDT dosimetry could streamline the delivery and control of PDT.
Dosimetry has been demonstrated to be an essential mechanistic tool to understanding PDT therapeutic dose, and a means for planning optimal light and drug doses for specific organ-tumor-photosensitizer combinations. Yet, lessons from prior studies are not always adopted in translational research. For example, while PDT of bladder (Star et al 1987, Marynissen et al 1989, Jocham et al 1990) and esophageal cancer (Panjehpour et al 2005, Mackenzie et al 2008) was shown to be problematic when the light delivery device is not properly positioned in the organ, subsequent clinical trials have been conducted without careful application of this critical safety goal. Overtreatment at the wrong site of a hollow organ can lead to perforation failure; damage to the muscular-collagen support layers can lead to stricture and severe morbidity. Treatment with PDT to the pleural cavity has been demonstrated, and dosimetry is critically important to avoid over treatment to critical structures (Friedberg et al 2012, Zhu et al 2015). Additionally, over treatment is more problematic when using some of the more potent photosensitizers, such as Foscan, Photofrin or Verteporfin, as they can be present in very high concentrations at certain times after injection (Wenig et al 1990, Kubler et al 1999, Sunar 2013). Avoiding overtreatment or under treatment is a critical issue that deserves close attention when determining the appropriate dosimetric parameter that needs to be measured on each patient.
While concerns about PDT dosimetry are well founded, there is also a concern that clinical adoption will be impeded as delivery monitoring and control becomes more cumbersome. Clinical efficiency and cost effectiveness are becoming primary factors in translating new treatments in a rapidly changing landscape of healthcare delivery. An ideal clinical development flow diagram for PDT is illustrated in figure 1. In this paradigm, a comprehensive dosimetry approach is implemented in the pre-clinical mechanistic research stage, but as development shifts to clinical trials in phases I through II and III, the goal correspondingly changes to window down the necessary-but-sufficient factors that reliably predict treatment outcome. All too often this is confused with eliminating dosimetry altogether, yet the key issue is to determine the one or two predominant factors that affect treatment outcome, and develop clinically acceptable ways to measure these. Further, in this review, we propose that focusing on readily-translatable surrogate measures of dosimetry could facilitate clinical adoption more effectively than explicit or even implicit measures in some cases. We also suggest that overt patient-specific explicit dosimetry methods might actually impede clinical adoption of PDT because of the overhead cost required by both companies and physicians. Admittedly, this argument must be taken within the context of each individual treatment and the risk/benefit ratio of the treatment. In this review, we outline areas where surrogate and treatment-determining dosimetry methods may make the most sense for future PDT trials.
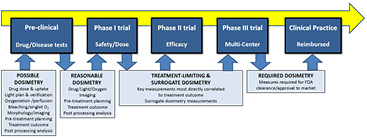
Figure 1. The shift from pre-clinical evaluation, through Phase I, II, and III clinical trials, and finally to accepted clinical practice is illustrated with the advocated shifts in dosimetry goals throughout the pathway. While a comprehensive dosimetry approach might be used in pre-clinical work to mechanistically inform practice, the transition to Phase I trial requires that reasonably efficient methods of dosimetry be implemented, and in the future the goal should be to shift towards treatment limiting dosimetry and correlated surrogates. Eventually, these might become the required dosimetry in approved/cleared treatments, going beyond basic prescriptions of light and drug doses.
Download figure:
Standard image High-resolution image2. PDT dosimetry approaches
2.1. Explicit dosimetry
Explicit dosimetry is the approach of directly measuring all pertinent parameters that contribute to the PDT treatment, or at least those that dictate the limits to treatment efficacy for the organ disease and photosensitizer used, as outlined in figure 1 (box at far bottom left). One of the key goals in explicit dosimetry is to determine those parameters that can be measured without prohibitively invasive clinical procedures. An example of this is to understand that measuring the distribution of photosensitizer and light in a solid tumor can be challenging without direct access to the tissue interior. Such direct measurements are routinely used in clinical trials of cancers with good access, such as in the skin, or for treatments where highly invasive procedures are common, such as head and neck, prostate and intra-uterine cancer. The measurement and calculation of light delivery is arguably the origin of modern approaches toward controlling PDT dose, with several groups attempting solutions in various clinical trials throughout the 1980s (Grossweiner 1986, Powers and Brown 1986, Werkhaven et al 1986, Wilson et al 1986, Grossweiner et al 1987, Potter et al 1987, Star et al 1987, Arnfield et al 1989). In this era, most of the approaches to dosimetry were focused around either direct measurement of the light fluence delivered in the tumor region or border, or computational modeling of the light fluence in the tumor, to predict the total integrated light dose within a clinically prescribed volume. In the 1990s, the approaches to dosimetry diversified considerably, as did the number of available photosensitizers, and so more focus was placed on direct measurement of the light fluence rate in vivo and the drug concentration where feasible (D'Hallewin et al 1992, Foster and Gao, 1992, Marijnissen et al 1993, Heier et al 1995, Beyer 1996, Braichotte et al 1996, Svaasand et al 1996, Tromberg et al 1996, Bays et al 1997, Wilson et al 1997, Lilge et al 1998, Tan et al 1999). The match between computational work and experimental measurements of light fluence was more routinely used in clinical trials. By the early 2000s, several groups had developed advanced delivery and monitoring systems that were fully integrated or were controlled by a medical physics team (Johansson et al 2002, van Veen et al 2002, Boere et al 2003, Radu et al 2003, Dickey et al 2004, van Veen et al 2006, Zhu and Finlay 2006, Johansson et al 2007, Swartling et al 2010, Zhu 2012), and pilot commercialization had emerged.
Complete dosimetry is now fairly widely recognized as a very challenging goal, with multiple probe locations required, intensive computational modeling for those areas between the control points, and geometrical problems in accurately assessing these values. Still, as a research pursuit, these developments show the major challenges of accurate dosimetry in PDT. However, we argue here that this brute force approach to dosimetry may be one of the factors leading to a lack of enthusiasm, due to the high overhead required to deliver and monitor treatment. This may be a controversial issue, but requires consideration since it is well known that PDT with explicit dosimetry has never seen clinical acceptance in a widespread, reimbursable manner. Another problem may be that a dedicated dosimetry system for PDT, developed for the single-use indication for PDT only, is inherently less attractive than a standard imaging or assay system that can be used for a broader range of procedures and is widely adopted in the clinical specialty. This is not to say that dosimetry is not needed, but rather a staged approach must be designed, which strategically finds those dosimetry parameters which dominate control of the process and could then be reduced to the minimum essential measurements or used to define surrogate measures of them.
Measurement of photosensitizer (PS) concentration in most clinical trials has been handled as a traditional drug delivery issue, whereby the prescribed injection or topical delivery dose is administered and bulk measurements of PS in serum and tissue are made. More recent efforts have focused around direct in situ verification of photosensitizer through online fluorescence measurement (Braichotte et al 1996, Farrell et al 1998a, Boere et al 2003, Yang et al 2003, Valentine et al 2013, Kanick et al 2014, Mallidi et al 2014) of each patient. This is especially important to understand and accommodate the wide variability in photosensitizer uptake/production between subjects and even within a given lesion. While early trials intentionally focused on plasma sampling and tissue extraction measurements of PS, later studies have focused on in situ measurements using the fluorescence properties of the PS. Several fiber probe systems exist for PS measurement in tissue, with varying levels of robustness to variations in tissue optical properties. Additionally, camera-based systems have been used largely for skin imaging (Cubeddu et al 2000, Fischer et al 2001, Ericson et al 2004, Tyrrell et al 2010a, Andrade et al 2014), and tomographic systems to image sub-surface PS distribution have been studied (Johansson et al 2007, Swartling et al 2010, Flynn et al 2013, Rollakanti et al 2013). The emergence of fluorescence-guided surgery has been a lateral development, significantly advancing the technologies available for imaging fluorescence in clinical settings, and this is expected to grow in the coming years.
A final obvious measurement in dosimetry is the oxygen level. However this may be the most elusive of all, because oxygen concentration varies spatially at the microscopic level, and can change dynamically throughout the treatment (Tromberg et al 1990, Foster and Gao, 1992, McIlroy et al 1998, Georgakoudi and Foster 1998b, Kelleher et al 2004, Zhu et al 2005, Woodhams et al 2007, Jarvi et al 2011, Weston and Patterson 2013). Many research efforts to measure parameters related to oxygen concentration have been reported, such as blood hemoglobin oxygen saturation (SO2) (Pham et al 2001, Solonenko et al 2002, Wang et al 2004, Thompson et al 2005, Wang et al 2005, Zhu et al 2005, Yu et al 2006, Wang et al 2007, Kruijt et al 2009), tissue partial pressure (pO2), and blood flow parameters. While each of these measurements is feasible in a laboratory setting, obtaining useful measurement in humans is challenging on a macroscopic scale, especially as values change dynamically during treatment. It is nearly impossible to acquire enough information that enables adequate assessment of the extreme heterogeneity present (Vaupel and Kelleher 2010). More innovative measures of oxygenation in the tissue, such as luminescence lifetime measurements of the photosensitizer (from quenching processes which are sensitive to ground state oxygen), could have value in understanding the regional variations in oxygenation; however these are currently restricted to surface imaging or diffuse imaging (Lebedev et al 2009, Wilson et al 2012).
2.2. Implicit dosimetry
The idea of implicit dosimetry has been a topic of advanced research for a number of years, and was eloquently summarized by Wilson et al (1997). The overall goal of dosimetry is to measure all relevant, individual parameters which, when added together, could provide an integrated parameter that correlates closely to treatment dose. What makes implicit dosimetry even more important is the observation that some previously non-measurable effects also seem to contribute to the dose delivery in non-linear ways. Examples of this are: (i) light dose rate & fractionation, (ii) micro-localization of the photosensitizer in the vasculature versus tumor parenchyma, (iii) cellular organelle localization effects, or (iv) whole body immune response to local PDT damage. Thus, a true appreciation of the complexity of PDT dosimetry suggests it may be impossible to measure all pertinent factors affecting dose delivery as a predictor of biological response.
The ultimate goal of PDT is the photochemical production of toxic species, and the most direct measurements of this production are thought to be of singlet oxygen generation, and biological damage occurring directly in the tissue (Douzou 1972, Niedre et al 2005, Jarvi et al 2006, 2012, Laubach et al 2008, Lee et al 2011, Mallidi et al 2014). For singlet oxygen, the measurement of which has been the focus of an enormous amount of engineering work, the most detectable signal is its luminescence at 1270 nm. The lifetime and amplitude of this emission are quenched by interaction with proteins, so direct measurement of the lifetime provides an estimate of the deposited PDT dose as the treatment occurs. Integrating this signal through the treatment is required to provide a metric related to dose. Also, intermittent measurement of the species can give information about oxygen limitations in treatment. While intense research is ongoing in this field, one could argue that a practical system to provide robust singlet oxygen dosimetry does not yet exist.
A good example of the value of implicit dosimetry comes in PpIX-based PDT, where fluorescence from PpIX can be directly measured, ideally with a spectrally resolved detection system during light irradiation. Interestingly the loss of fluorescence with PpIX is known to be quite rapid during treatment, and this photobleaching is well known to represent the time region where the maximal dose delivery occurs (Georgakoudi et al 1997, Farrell et al 1998a, Iinuma et al 1999, Kunz and MacRobert 2002, Zeng et al 2002). Studies have shown in vivo that the fluorescence loss integrated over the time interval of photobleaching is predictive of damage to the tissue, and further light treatment beyond this has little value (Sheng et al 2007), as shown in figure 2. This is a good example of how direct measurement of all parameters such as light delivery, the PpIX present, and tissue oxygenation would be not only challenging, but also insufficient to predict the treatment response. To be predictive, these parameters would have to be input into a dosimetric model which factors in photobleaching and its role as well, as shown by Wang et al (2010). Thus, the simpler idea of reducing all of this down to a direct measurement of integrated photobleaching signal is very attractive, assuming or verifying that this parameter directly correlates to the desired treatment outcome in a clinical trial. This has only been validated extensively for PpIX PDT.
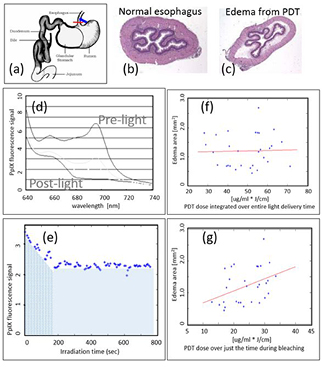
Figure 2. Rat esophagus was used to study PDT dosimetry and response for ALA-PpIX treatments (reproduced with permission from Sheng 2006 and Sheng et al 2007) (a). The histology images of each esophagus (b) were used to assay response, and the edema resulting from PDT (c). The fluorescence during treatment was spectrally resolved (d) and quantified as a function of time (e). Then the signal was tested for correlation to the edema area, and when the total fluorescence over the treatment time was used (f), there was no correlation (all blue area in (e)); yet when only the signal during the bleaching phase was used, a correlation became apparent (g) (just the blue wavy line area in (e)).
Download figure:
Standard image High-resolution imageClinical manifestations of this implicit dosimetry approach have been demonstrated in humans through a few phase 1 clinical trials. Valentine et al (2011) demonstrated significant photobleaching existed in all of 40 patients who responded to ALA or methyl-AL based PDT, and later (Valentine et al 2013) that modeling of this could allow interpretation of the dose delivery. In the work of Ericson et al (2004), it was shown in 37 patients that lower fluence rates were better correlated to superior initial treatment outcome. Also the photobleaching rate was inversely related to the fluence rate, with a threshold beyond which no further bleaching occurred, validating the potential for using photobleaching as an implicit measure of in vivo dose in humans. Cottrell et al (2008), took this concept to the next level by completing a prospective study of implicit dosimetry in 26 patients, showing that the fluence required to bleach PpIX was directly related to the irradiance used, and applied the active dosimetry concept of increasing the irradiance in a separate cohort. Mallidi et al (2014) compared photobleaching dosimetry to direct singlet oxygen measurements before and after PDT in 26 human subjects, and demonstrated that the treatment outcome was better predicted by the photobleaching metric. It should be noted however that while this approach is important for PpIX-based PDT, this is a particular type of photosensitizer which happens to photobleach rapidly, and these relationships certainly may not hold for most other sensitizers as the photobleaching rate varies considerably between compounds. (Svanberg et al 1998, Fischer et al 2001, Ericson et al 2005). Research into the potential value of photobleaching itself is widespread, but despite its promise, has not seen widespread adoption at this time.
3. Ongoing issues in PDT dosimetry
3.1. Uncertainties about photosensitizer concentration, location and effect in vivo
Perhaps the best success story with PDT, at least in terms of the largest commercial success, has been the use of aminolevulinic acid (ALA) and its related hexyl and methyl esters to induce protoporphyrin IX (PpIX) (Kennedy and Pottier 1992) for the treatment of actinic keratosis (AK) and squamous cell carcinoma (SCC). There are currently several commercial suppliers of topical ALA and ALA derivatives for skin application. The solution or cream is applied to the area to be treated and after a period of hours, light irradiation is used for PDT effect. The problem with this therapy is that while approved and widely adopted, it can have extremely variable response rates (Dognitz et al 2008, Gerritsen et al 2009, Sharwani and Alharbi 2014, Lerche et al 2015), which is thought to be linked to large variations in PpIX production within lesions. The origins of this variation are still unclear, but may be related to ALA penetration, or simply to biological variations in the lesions (table 1).
Table 1. The factors affecting photosensitizer location and effect are tabulated.
| Factors affecting Photosensitizer | Example | References |
|---|---|---|
| Variable production of PPIX | Actinic keratosis variation | (Ericson et al 2004, McLoone et al 2008, Wiegell et al 2011, Wiegell et al 2012) |
| Penetration of ALA | ||
| Keratin layers presence | ||
| Variability in skin occlusion use | ||
| Variability in application times | ||
| Vascular versus cellular location of PS from time after IV injection | Vascular delivery required for solid tumors | (Fingar et al 1992b, Schmidt-Erfurth et al 1995, Chen et al 2005a, Chen et al 2006) |
| Transvascular permeability variations | ||
| Intracellular redistribution in cells | Not an issue for all sensitizers but well known for lipid localizing agents (AlPcS2) and PpIX | (Strauss et al 1995, Fingar, 1996, Georgakoudi and Foster 1998a, Fingar et al 1999, Kessel and Poretz 2000, Krieg et al 2003, Chen et al 2005a, Osaki et al 2006, Yu et al 2006, Sailer et al 2007, Trachtenberg et al 2007, Woodhams et al 2010) |
| Well documented for most PS |
For vascular-injected photosensitizers, there are well-documented issues around understanding and controlling the degree to which the photosensitizer leaves the vascular space and penetrates the tumor tissue (table 1). This difference in microscopic localization is very important as it has been shown that changes during treatment, or at different phases of localization, result in strong changes in biological effect (Fingar et al 1992a, 1992b, Fingar et al 1999, Chen et al 2003, 2005a, 2008). Understanding and controlling this variability is further confounded by the competing time-dependent processes of (i) drug extravasation into tissue, and (ii) systemic clearance through normal physiological filtering processes. Some studies have demonstrated that mTHPC plasma concentration can increase over time (Glanzmann et al 1998, Chen et al 2000, Cramers et al 2003, de Visscher et al 2011) making prediction of the in vivo concentration complex. Also, it has been shown that dynamic changes to the vessels can occur in the initial phases of PDT activation, and these can affect the overall dose delivery process (Chen et al 1998, Pogue et al 2001a, Chen et al 2003, Wang et al 2004, Wang et al 2005, Yu et al 2006). Finally, vascular-cellular distribution kinetics are also superimposed upon an even smaller, micro-localization processes that occur where the PS associates within the cells. Microscopic re-localization to critical membranes and organelles can also radically affect the dose sensitivity (Strauss et al 1995, Georgakoudi and Foster 1998a, Seidl et al 2001, Pogue et al 2001b, Krieg et al 2003, Ji et al 2006, Osaki et al 2006, Sasnouski et al 2006, Kunz et al 2007), so that raw measurements of bulk concentration may not be representative of the impact of dose delivered. Furthermore, the above parameters are PS-specific for each treatment situation. These complex issues are not easily solved. Therefore, while fascinating areas for research, they point to the central issue discussed, namely that absolute PDT PS dosimetry may be almost uncontrollable in many clinical settings.
3.2. The challenge of measuring photosensitizer, light and oxygen in bulk tissues
Solid tumor PDT is perhaps one of the most challenging for dosimetry, because of the need to measure explicit dose parameters within the lesion, while they potentially vary over time. Invasive systems exist (Zhu et al 2005, Du et al 2006) but have not achieved market success yet. The need to predict between measurement points is still a challenge, typically solved with approximation modeling. For example, optical fluence measurements can be sampled, and diffusion theory or Monte Carlo modeling can be used to predict between the measurement points (Johansson et al 2007, Li and Zhu 2008, Swartling et al 2010). Additionally, fluorescence tomography has been demonstrated to measure PS distribution in deep tissue structures (Yu et al 2006, Johansson et al 2007, Wang and Zhu 2009, Swartling et al 2010, Flynn et al 2013), yet high spatial resolution through thick tissues is perhaps an insolvable problem. Taken as a whole, explicit 3D systems for PS exist and could be implemented more widely, but their output is still limited to regional approximations, and the challenges of daily implementation would require trained technical staff to operate complex instrumentation and to interpret the data.
Oxygen is critical for successful PDT (Fingar et al 1987, Henderson and Fingar, 1987, Wieman and Fingar 1992), yet the search for a useful and accurate way to measure tumor oxygenation has gone on for many decades (Vaupel et al 2005). The most important feature of this research challenge is the fact that variations in oxygenation occur at the capillary-tissue level, and thus the oxygenation varies by orders of magnitude every few tens of microns in tissue. This fact, combined with the extreme heterogeneity of tumors, means that obtaining highly-resolved maps of oxygenation throughout an entire tumor is not feasible. That said, dozens of methods to measure oxygen or oxygen-related parameters on a larger scale have been tried. Well controlled data certainly exist to show that oxygen is required (Henderson and Fingar 1987, Fingar et al 1988, Henderson and Fingar 1989, Fingar et al 1992a, Sitnik et al 1998, Henderson et al 1999), and that oxygenation can globally change during therapy, and that enhancement of blood flow or tumor oxygenation can improve response to PDT. However, as with radiation therapy, the actual implementation of routine oxygen monitoring during therapy has remained elusive, largely because of the intractability of the problem (Pogue et al 2001a). Local measurements can still be done, and on average can show reasonable trends. However, the introduction of systems such as the Eppendorf electrode were potentially inhibitory to clinical acceptance, owing to the extremely invasive nature of measurement (Vaupel et al 2006, 2007).
Singlet oxygen luminescence dosimetry has been widely pursued as a potentially superior alternative to oxygen measurement, as it would provide a more comprehensive measure of the total dose delivered (Patterson et al 1990a, Niedre et al 2002, Jarvi et al 2006, Wei et al 2008, Jarvi et al 2011, Lee et al 2011, Mallidi et al 2014). Yet, as with oxygen, the singlet oxygen signal should be assumed to vary on the distance scale of 10's of microns, and to vary dynamically throughout treatment. Significant research efforts are ongoing, and recent technological advances in mid-IR detection have made this seem more possible (Jarvi et al 2011, Lee et al 2011, Mallidi et al 2014). Yet, implementation of singlet oxygen detection on anything other than surface tissues seems challenging to implement in a clinically acceptable setting. Research and development efforts in this area are still progressing however, and it is quite possible that probe and surface imaging systems will advance into practical use.
3.3. Complete interpretive models of photodynamic dose
The goal of a physical theoretical model for dose delivery has been developed in many studies over the last several decades. Given the role of physicists in providing the basic tools and interpretations of dosimetry, the goal of providing a complete computational framework for estimating dose has been a long desired ideology, and the individual components of this model are briefly mentioned here. Early estimates of light dose spread in tissue are the first major theoretical part of this to be solved computationally with diffusion or Monte Carlo modeling (Wang et al 2010), but then this must be integrated with theoretical physical chemistry modeling of the active photosensitizer concentration, and the conversion of excited triplet state oxygen to singlet oxygen through collisional quenching. The added complexity of singlet oxygen then photobleaching the original photosensitizer is an important feature, which can lead to a mixture of photosensitization effects. Finally, the existence of a threshold dose in PDT effect has been validated both in vitro (Georgakoudi et al 1997, Coutier et al 2001) and in vivo (Patterson et al 1990b, Lilge and Wilson 1998, Farrell et al 1998b), demonstrating that the prediction of dose itself also must be interpreted relative to the presence of a non-linear step function before cellular destruction occurs (Wang et al 2010). However, there are features of photochemical oxygen depletion and biological blood flow reduction which are negative feedback aspects that can occur during the light delivery, which cannot be reliably modeled without direct measurement of these parameters, making physical modeling by itself incomplete (Foster and Gao 1992, Chen et al 2003).
While the tools to measure all these things are complex, one of the major goals of complete interpretive modeling would be to allow a reduced number of measurements, and yet still provide accurate dosimetry estimates. Thus, the idea of developing a complete interpretive model is not inconsistent with the idea of reducing PDT dosimetry measurements and streamlining the dosimetry process as clinical trials advance. Indeed, it will be important for interpretive modeling to be present and that surrogate or reduced dosimetry measurements agree with quantitative models in order to validate the effects seen. However, while PDT photochemical dose prediction is important, PDT response which includes all the biological effects is what actually matters for clinical trials. As such, the next section describes these issues which ultimately could have a heavy impact on the role of measurements and quantitative models, in cases where biological responses do not directly agree with quantitative photodynamic dose estimates.
3.4. Biological modifiers of dose response
Factors that modify tissue response to PDT have been well documented, some of which can alter the biological response to treatment, and may or may not correlate with direct physical dosimetry measurements. These types of modifisers can be divided into (i) pre-treatment modifiers which prepare the tissue for higher damage from a fixed dose, and (ii) biological factors which affect response post-treatment. The pre-treatment modifiers are factors that affect blood flow and perfusion, or factors which affect photosensitizer uptake, production or localization in the tissue to be treated.
Few clinical studies have examined vascular flow modifiers, although many pre-clinical studies have looked at this. In general, increases in tumor perfusion are thought to be good for improved delivery of PS and oxygen to the tumor. The radiobiology research world has examined this for decades without much clinical success, largely because of the fact that tumor vessels are thought to be unresponsive to modifiers, whereas normal vessels are much more responsive (Thews et al 2000, 2001). External modifiers such as heat, chemotherapy or radiation can induce changes in interstitial pressure, which can induce increased transvascular delivery (Bicher et al 1980, Lin and Song 1993, Song et al 1996, Vujaskovic et al 2000). Alternatively, mild PDT itself can induce improved transvascular delivery if done carefully, allowing for improved overall PDT delivery and response (Chen et al 2003, 2005a, 2005b).
Pre-treatment cellular modifiers have been examined in the recent decade, with a particular attention to PpIX production, based upon differentiating agents (Schick et al 1995, Ortel et al 2002, Ickowicz Schwartz et al 2004, Akilov et al 2008, Anand et al 2013). These agents are applied in the days and weeks prior to PDT (Anand et al 2011) and are thought to alter the transcription pathways for enzyme production to enhance the PpIX production pathway. Alternatively chemical modifiers such as iron chelators have been applied (Curnow et al 1998, Choudry et al 2003, Blake et al 2011), to reduce the available iron and halt the conversion of PpIX to heme, thereby yielding a larger amount of end product (PpIX). These biological modifiers produce changes in treatment response that, in addition to the alterations in PS levels (PpIX), reflect changes in other biochemical processes such as an increased activity of cell death pathways such as apoptosis (Anand et al 2011). While the effect of this biological modification could be measured by fluorescence and photobleaching dosimetry, their effect may not always be picked up by surrogate dosimetry metrics, and so care is required to consider this.
Finally, perhaps the largest biological effect that factors into PDT treatment is the subsequent immunological responses, and changes that occur in expression pathways of the surviving cells (De Goeij et al 1975, Canti et al 1994, Hryhorenko et al 1998, Wong et al 2003, Brackett 2011, Kammerer et al 2011, Shams et al 2015). Although these reactions have been well documented in recent decades, our understanding of these effects across a range of tumor lines is still not at a level that can be applied to clinical treatment. Despite this, there is a widespread belief that immune responses after PDT could be as important as the original PDT dose itself (Gollnick 2012, Korbelik and Hamblin 2015, Shams et al 2015). Developing the ability to image or assay changes in immunological and cellular signaling is a major part of PDT research today, and may well become a critical piece of surrogate dosimetry in treatments and tumor models where the post-PDT immunological response dominates the observed treatment outcome. This is a particularly important issue, because in the cases where immunology dominates the biological response, neither explicit nor implicit dosimetry measurements may have value. In these cases, searching for surrogate dosimetry measurements that better correlate to the immunological response may be more productive, especially if they are tools widely adopted in clinical practice, such as blood chemistry or imaging.
4. Clinical tools available for surrogate dosimetry measures
Surrogates for dosimetry would ideally be predictive of response, perhaps reporting on an important dose-limiting factor of the treatment. Identifying a metric which correlates with, or otherwise represents the dose-limiting factor for treatment response (specific for the PS used and the tumor type treated), is perhaps the key in choosing surrogate measures. The steps in establishing a robust surrogate metric for PDT are outlined in table 2. The measurements need not necessarily directly correlate to an explicit dosimetry parameter, but ideally they would. This would insure that if patient-specific treatment was designed, then the explicit parameters could be systematically altered to improve therapy outcome. Examples of clinically used radiological procedures and clinical chemistry tests are outlined in the next section, with an eye towards future utility in PDT dosimetry.
Table 2. The clinical trial phases are tabulated along with the stages of dosimetry appropriate for each.
| Trial stage | Dosimetry stage |
|---|---|
| Pre-clinical | • Vary dose factors systematically to determine which dominate response outcome |
| • Test surrogate measurements for correlation to response | |
| • Prospectively test delivery verification | |
| Phase 1 | • Verify/test limiting factors in dose escalation trial |
| • Verify/test measurements correlating to dose limiting factor | |
| Phase 2 | • Perform surrogate measurement |
| • Deliver therapy | |
| • Assess outcome | |
| • Verify that surrogate measure correlated to outcome | |
| • Test that changes to dose delivery can improve outcome & that this is predicted by the surrogate dose measurement | |
| Phase 3 | • Perform surrogate measurement |
| • Design dose delivery based upon measurement | |
| • Deliver customized therapy plan | |
| • Assess outcome |
In photodynamic therapy, the relationship between light energy delivered and actual dose deposition is constantly changing as a function of photosensitizer concentration. Therefore, the abstraction of pharmacokinetics—delivery, uptake and clearance of a drug—is considered as a major leverage point when optimizing PDT therapy. Photosensitizer uptake and retention depends on a number of factors within the body: arterial delivery of PS to the vascular bed (arterial input function), excretion rate (clearing PS from the plasma), extravasation to the tissue via gaps in the endothelial cells lining the vasculature, and leakage back into the vasculature from the tissue. Many of these factors can be characterized through dynamic-contrast enhanced imaging or tracer kinetic imaging, highlighting the potential for implicit clinical dosimetry. Tracer kinetic imaging is so-called because it uses contrast-enhancing molecules that 'trace' the path taken by a substance dissolved in the blood, in a manner driven by the vascular and tissue kinetics of the body. Acquired time-series of images can be analyzed using a variety of parametric (Kety 1951, Patlak et al 1983) and non-parametric models (Cenic et al 1999). The most common imaging modalities used in the clinic, and therefore the most likely candidates for dosimetry, are ultrasound, dynamic contrast-enhanced (DCE) computed tomography (CT) and DCE magnetic resonance imaging (MRI). While a handful of recent studies (Jermyn et al 2014, Elliott et al 2015) have specifically looked at the relationship between kinetic parameters and photosensitizer uptake or efficacy, most of the literature has focused on either treatment monitoring (Xiang et al 2007) or image-guidance of specific drug delivery systems (Maeda et al 2001). A summary of such approaches is described in table 3.
Table 3. Common modalities, their sources of contrast and the parameters which they report.
| Modality | Contrast mechanism | Routine parameters | Advanced parameters | Disadvantages | Refs |
|---|---|---|---|---|---|
| Ultrasound | Tissue interfaces, red blood cells, microbubbles | Tumor shape, location, density | Perfusion, velocity, elastography, stiffness & matrix | Operator dependent, quantification difficult | (Okihara et al 1999, Peters-Engl et al 1999, Maeda et al 2001, Goertz et al 2002) |
| DCE-MRI | Gadolinium | T1, T2, pre/post difference, Ktrans, ve | Blood flow & volume, vascular and tissue Vd, distribution of transit times | (Devries et al 2001, Armitage et al 2007, Rosen and Schnall 2007) | |
| ASL-MRI | Spin-labeled water | None | Blood flow | Limited mainly to brain imaging | (Silva et al 2000) |
| X-ray C-arm | Iodine | Location, blood flow visual, contrast enhancement patterns & changes | Estimated flow rates | Ionizing radiation | (Wallace et al 2008, Ganguly et al 2010) |
| Estimated arterial/venous values | |||||
| DCE-CT | Iodine | CT number, arterial & venous temporal contrast enhancement | Blood flow, volume, mean transit time, extraction, Permeability surface, kep | Ionizing radiation, motion artifacts for thorax | (Cenic et al 1999, Sahani et al 2005) |
Ultrasound is one of the most commonly used imaging modalities in the world, and standard ultrasound B-scan images can localize tumors and assess tumor size, but provide little information on microvessel flow or density. Doppler imaging has been used to study tumor blood flow both clinically and experimentally (Okihara et al 1999, Peters-Engl et al 1999, Goertz et al 2002). Contrast-enhanced ultrasound with microbubbles may be particularly useful when evaluating macromolecular PDT delivery systems, such as BPD nanocells, but will exhibit markedly different kinetics than typical contrast agents and smaller drugs (Maeda et al 2001). However the drawbacks of US imaging is the obviously low signal-to-noise ratio in the images, and the nonlinearities resulting from this, together with the 2D nature of the image data.
The most readily translatable information for the purpose of PDT dose planning with vascular acting photosensitizers, is derived from vascular activity images from DCE-MRI or DCE-CT (Elliott et al 2015). Though not nearly as clinically widespread as single time-point enhancement images, dynamic time-series images can provide a number of key kinetic parameters. Both modalities offer some common information, as well as certain specialized strengths. DCE-MRI provides an assessment of Ktrans, the rate of transfer between the intravascular space and the extravascular extracellular space, which is the product of blood flow and extraction fraction leakiness (Sourbron and Buckley 2011). Tissue distribution volume, ve, is also readily available. To date, DCE-MRI has been used extensively to evaluate the response of a tumor to treatment longitudinally and to assess the tumor vasculature in terms of permeability and vascular density, hallmarks of angiogenesis. From a dosimetry perspective, several studies have investigated the use of DCE-MRI parameters to predict responses to targeted therapies in renal cell carcinoma (Rosen and Schnall 2007), dexamethasone (Armitage et al 2007) and chemoradiation therapy in rectal cancer (Devries et al 2001). DCE-CT can provide similar measurements, although dose-limits can limit accurate characterization of ve. The endogenous-contrast technique of arterial spin labelling (ASL) MRI is attractive because it does not introduce a foreign substance into the patient, and can be used repeatedly without concern for nephrotoxicity. However, it is not used routinely in the clinic, and has only been demonstrated in monitoring brain tumors (Silva et al 2000). A major strength of DCE-CT is its ability to characterize first-pass kinetics—blood flow (BF), blood volume (BV), capillary transit time (Tc), extraction fraction (E), and permeability-surface area (PS) product—which are arguably easier to quantitate than in DCE-MRI. Most modern clinical scanners are equipped with the necessary algorithm to perform these perfusion CT measurements (Cenic et al 1999, Sahani et al 2005). Similarly, as technology improvements are realized in C-ARM flat-panel fluoroscopy systems, CT-like imaging is becoming available in operating rooms or interventional radiology environments (Wallace et al 2008), and emerging technology provides in situ estimates of perfusion parameters (Ganguly et al 2010).
The relationship between parameters obtained from these imaging modalities and the true spatial and temporal deposition of drug are complex. For example, the relationship between Ktrans and molecular weight when DCE-MRI is performed using a series of differently sized gadolinium-complex molecules obeys a power law (de Lussanet et al 2005). In addition to molecular weight, permeability and retention are influenced by charge, lipid solubility, and propensity for non-specific binding. The latter is the reason why the <1 kDa sized indocyanine green, which bindings strongly with the 66.5 kDa ubiquitous albumin protein, acts as a very large MW vascular tracer and not a small MW permeable tracer. Yet, it is evident from the large number of studies investigating the relationship between angiogenesis, blood volume, microvessel density and permeability that effective radiologic dosimetry will be realized only if imaging parameters can be mapped to the behavior of photosensitizers. Standardized procedures developed to determine the specific relationships between clinical contrast tracers and photosensitizer drugs are needed for large-scale deployment of this dosimetry approach.
Table 3 summarizes the possible contrast imaging methods, all accepted radiological modalities, which could contribute as surrogate imaging tools for dosimetry.
Biopsy and blood collection are standard practices in the workup of most patients. The key issue is the timing of the collection and how this impacts the interpretive value of the data. The data that is routinely available from blood draw are hematocrit, PS fluorescence in the plasma, circulating proteins, bilirubin and tumor mRNA/DNA. These latter three would be direct measures of tumor damage. Hematocrit levels factor into light attenuation in tissue, and PS plasma levels have routinely been sampled from patients to understand patient to patient variability when trying a new photosensitizer. Biopsies are rarely taken from treated tumors, but pre-treatment biopsy is the norm in many sites, and can be used to estimate vascular density and areas, which could predict light delivery issues or drug delivery issues, depending upon which is the dose limiting factor in a treatment. The ease of sampling and the fact that these two measurements are highly integrated into patient workflow are important factors in thinking about these as potential targets for surrogate dosimetry.
5. Example of surrogate dosimetry: contrast imaging
Examples of the process of distilling dosimetry to surrogate parameters have been illustrated in PDT of solid cancers, using vascular delivered sensitizers. This is a particularly important model because the impact of treatment is inherently localized by the light penetration out from the fiber delivery location, and that the treatments are inherently limited by drug delivery, light delivery or oxygen delivery, but not often not limited by more than one of these. So this means that there is an opportunity to determine which single parameter most dominates the treatment responses of the therapy and using clinical measurement tools as a surrogate metric for this.
An example of the basic use of radiological images to triage subject suitability was demonstrated by Karakullukcu et al (2013) in the treatment planning of head and neck cancers with Foscan, where the pre-operative CT or MRI scan was technically feasible for delivery, as illustrated in their flow chart of figure 3(a). This is a basic implementation of this information, allowing assessment of geometry and complete pre-treatment planning with light delivery simulation. In most solid tumor treatments though, interventional imaging during the placement of delivery fibers is done during phase 1 studies. This is completed to verify the placement and probe measurements between fibers can be achieved to verify the light delivery process in real time. This is a straightforward example of how a pre-treatment CT scan could be used for dosimetric value, and reduction of inter-patient response variability by making decisions prior to PDT treatment. Since most clinically implemented PDT (beyond clinical trials) is done without any dosimetry at all, this basic interpretation of imaging is one step towards surrogate dosimetry value.

Figure 3. One example of basic use of radiological imaging in dosimetry is outlined in the flow chart of (a) where pre-treatment MRI/PET/CT is used to assess if the treatment plan indicates a technically feasible treatment (reproduced with permission from Karakullukcu et al 2013). In prostate treatment planning (b), (reproduced with permission from Davidson et al 2009) for Tookad-based PDT, the % induced necrosis was found to be directly correlated to the % volume receiving a light dose over the threshold dose estimate, supporting that light delivery is a dominant factor in treatment efficacy.
Download figure:
Standard image High-resolution imageCT scanning is commonly implemented for post-treatment evaluation in solid tuomrs, because the responses often appear as a hypo-contrast area when the vasculature is ablated by the treatment. Light delivery in prostate cancer treatment has been developed for a number of different photosensitizers and simulation software used with pre-treatment MR or CT scans (Chen and Hetzel 1998, Chen et al 2002, Weersink et al 2005, Du et al 2006, Zhu and Finlay 2006, Johansson et al 2007, Li et al 2008, Li and Zhu 2008, Davidson et al 2009). The work by Davidson et al (Davidson et al 2009) shown in figures 3(b) and (c) indicates that treatment planning estimation is required, because the volume of necrosis directly correlated to the fraction of the tumor treated to greater than 50% of the threshold dose. While this is not an illustration of pre-measurement planning, it shows that post-PDT scans correlate to the light delivery, which is a challenge to measure in as the treatment is administered. The vascular delivery and fast action of injection and treatment of this photosensitizer suggests that the treatment light delivery would be a direct predictor of response, as was seen. If this trial follows into 2nd phase studies, it may be possible to find surrogates of response which would correlate with treatment outcome, related to the pre-treatment CT scans.
Following this idea, a new observation was seen in pre-treatment CT scanning in a clinical trial of verteporfin-based PDT in pancreas cancer. The study was carried out with injected dose of 0.4 mg kg−1 and a 60–90 min period prior to interstitial irradiation with 690 nm light. It was a safety trial with light dose escalation from 5 to 40 J cm−1, where the effect expected would be a mixture of vascular occlusion/ablation and cellular damage. Many photosensitizers used for solid tumor PDT have a mixture of cellular and vascular damage responses, with the vascular damage being the most obvious to measure by contrast CT. In this study, it was found that pre-treatment contrast-CT images could be analyzed for contrast difference values, and that these values were inversely correlated with the PDT-induced lesion volume as measured by the loss of functional CT contrast, as shown in figure 4 (Huggett et al 2014, Jermyn et al 2014). Because this was a dose escalation trial, with increasing prescribed light doses, and the lesion volumes were generally found to increase with the average prescribed dose but with some inter-subject variability. However, the correlation between pre-treatment CT contrast and final necrotic volume per light dose unit was much stronger. Because the correlation with blood volume contrast was so strong, these results imply that other factors, such as variations in photosensitizer concentration and tissue oxygenation, were relatively less important.
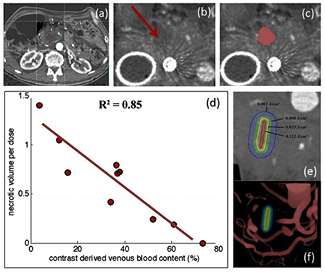
Figure 4. A case from the pancreas cancer treatment clinical trial with verteporfin-PDT is shown (a) with placement of the fiber in the pancreas for light treatment. The PDT-induced lesion sizes were imaged by contrast CT (b), and volumes thresholded to quantify the effect (c). When correlation was tested between the pre-PDT contrast enhancement relative to the necrotic volume per unit dose (volume normalized by the delivered light dose), there was a strong linear correlation (d). This supports the idea that the light dose (e) was limited by the volumes of blood around the treatment fiber, visualized in (f) (reproduced with permission from Huggett et al 2014 and Jermyn et al 2014).
Download figure:
Standard image High-resolution imageThe fact that blood volume was inversely correlated with necrosis indicates that increased blood volume (i.e. contrast) decreases the treatment effect, leading to the hypothesis that attenuation of the light (due to absorption by blood) is the primary limiting factor for the treatment response. This seems plausible and suggests that CT contrast may represent a singular, measurable dosimetry parameter for this type of treatment. Because pre-treatment contrast-CT scans are a standard part of the clinical workup for pancreatic cancer patients, this finding is readily translatable to larger-scale clinical trials of PDT. Of course, this example is one which has been found through retrospective analysis, and needs validation in prospective studies. Additionally, the hypothesis still must be validated, that changes to the treatment plan based upon the contrast-CT data can positively impact lesion volume and therefore patient outcome. However the same study did indicate that across patients there was a clear dose response with increasing light delivery, so it is reasonable to assume that this might be validated in the future study.
One can hypothesize that many solid tumor treatments would behave similarly. Because the goal of PDT using implanted fibers is to treat outwardly from the fiber, to the largest extent possible, light propagation becomes the key dominating factor in the induced lesion volume. This type of surrogate dosimetry should be examined in cases where PDT treatment is being done interstitially and where pre-treatment work up involves a contrast CT scan. Again, the hypothesis that this can positively affect individual dosimetry remains to be validated in prospective clinical trials, but the concept seems as though it could be adopted by a number of photosensitizer and solid tumor treatment situations. Going forward, the proposed ways to implement contrast-CT based surrogate dosimetry is to:
- (1)Test increasing the light dose delivery in subjects with high contrast enhancement
- (2)Attempt a multi-delivery treatment in these patients to enhance effect
- (3)Examine ways to reduce blood in the local region, to minimize light attenuation
These prospective modifications have not been tested clinically yet, but could be plausibly implemented, to reduce inter-subject variation, and yet not get into extensive explicit dosimetry system development and measurement which could curb enthusiasm for the trial.
6. Example of reductionist dosimetry: photobleaching
The most direct implementation of a reductionist approach to dosimetry is to follow the lead of implicit dosimetry. Perhaps the most studied approach to this is directly monitoring photobleaching to adjust the light delivery. As shown in a human trial published by Johansson et al (Hennig et al 2011, Johansson et al 2013), the amount of PpIX present and the completeness of the photobleaching from before to after light treatment was a direct indicator of completeness of treatment efficacy. The proposed reduced approach to dosimetrically measuring treatment completion is to sample fluorescence periodically throughout treatment and increase the prescribed light treatment until a suitable bleaching level has been achieved (Hennig et al 2011). While adjustment of the light fiber orientation and placement is still routine in PDT treatment planning, the implementation of active dosimetry which is used to individualize treatment is still not conventional, however.
In dermatology, the same type of distillation or reductionist approach to finding the singular limiting dose parameter has been examined, using ALA-PpIX photobleaching (Van der Veen et al 1997, Robinson et al 1998, 1999, Robinson et al 2000, Warren et al 2010). For dermatological applications of PDT, optical measurements can readily be assessed on tissue surfaces. Recently optical measurements were incorporated into a pilot clinical investigation of ALA-PpIX for AK (Kanick et al 2015), as shown in figure 5. A spectroscopic probe system was used to measure fluorescence emission figure 5(a) and decompose the signal into PpIX and background contributions. Measurements before treatment are shown for a subject with high production of PpIX (a), and a subject with low production (b). These measurements could be taken before and after treatment to verify the photobleaching process. However, one of the most important observations from data collected from 70 patients was that the pre-treatment PpIX concentration showed very large inter-patient variability, as seen in the figure 5(c) frequency histogram. The tissue response in the days after treatment as measured by redness index showed direct correlation to the amount of PpIX present at treatment, shown in figure 5(d), suggesting that patient-specific PpIX generation may be a limiting factor in clinical treatments. The data suggest that dosimetric assessment of PpIX generation prior to treatment may identify non-responding patients at the time of treatment, and allow for clinical interventions to improve the probability of successful response. While much attention has been paid to photobleaching, it is quite common that the photobleaching amount correlated to the amount of PpIX present at the start of treatment, and that so the more dominant factor affecting things is simply how much PpIX is produced in each individual lesion. Given the approach to PpIX PDT, it is almost always possible to photobleach away the compound by illuminating until this is achieved. IT may be more important though to alter the delivery of ALA prior to PDT to enhance the production of PpIX as much as is feasible in each subject.

Figure 5. Data from clinical ALA-PDT treatments of AK, showing (a) the strong fluorescence signature of PpIX emission in a responding patient compared with (b) the absence of PpIX fluorescence in a non-responding patient, each fitted for PpIX concentration, inset with fitting error below. In (c), the data histogram of all subjects shows that nearly 40% of patients (n = 70) presented very low PpIX concentrations. In (d) the patients binned into 3 groups of erythema scores show significant differences in the PpIX concentration value at the time of treatment (Kanick et al 2015).
Download figure:
Standard image High-resolution image
The ultimate implementation of this in a clinically adoptable package, would be to seamlessly integrate fluorescence measurements into the treatment device, as has been demonstrated in a number of research applications. Most recently, a clinical tool having this feature was widely produced (Andrade et al 2014), and this could eventually be used to track photobleaching in real time. This integrated package is unique in that it has been integrated into the commercially available devices used in Brazil with widespread distribution (Andrade et al 2014), allowing each physician team to understand the likelihood of response in every treatment with minimal extra time required. Unfortunately this is not the case with clinical PDT treatments in most countries, where it is not common to sample PpIX fluorescence at all, much less to follow photobleaching. While a large number of individual studies have demonstrated the interpretive value of fluorescence imaging of PpIX treatment with other measurement devices (Svanberg et al 1998, Fischer et al 2001, Ericson et al 2005), there still is not systematic monitoring of PpIX production in most commonly implemented clinical treatments of PpIX-based PDT. As a result, the heterogeneity of responses in skin treatments is unfortunately high (Wang et al 2009); much of this might be corrected with the integration of a simple single dosimetry measurement (Tyrrell et al 2010b). Zietouni et al (2014) implemented one type of modified treatment, where the light fluence was adjusted to a two-step irradiance protocol, in order to reduce pain and test improved treatment outcome with lower fluence rates. This is one step towards a tailored dose rate delivery, but individualization of the treatment plan would be the next stage in development of a custom treatment planning process.
The next step in this process is perhaps the most critical though to truly see the fruition of dosimetry reduction, which is to carry out prospective trials that test the hypothesis that the prescribed treatment should change in response to pre-treatment measurement of PpIX levels. Since PpIX photobleaches so strongly, the approach of applying more light delivery is not likely to have much value as a dose modification approach in PpIX-based PDT, but rather there would be a need to increase the observed production at the site to be treated. For example, if low sensitizer levels were observed in skin, the possible next step would then be to:
- (1)Apply more ALA or wait for longer period of time
- (2)Provide some added method for epithelium removal (tape stripping)
- (3)Provide occlusion to amplify the penetration of ALA into the skin
- (4)Modify the biology of the tumor through differentiation therapy approaches
Each of these approaches could have value, and individualization of the treatment process is required to see value in the reduced approach to dosimetry.
7. Summary
For pre-clinical work and even for phase I human trials, both explicit and implicit dosimetry are needed to gain the maximum mechanistic understanding from the data, and to test for correlations to treatment outcome. This information is central to the development process, because each tumor type and photosensitizer type has unique characteristics. Unfortunately, the number of important parameters to characterize exceeds six (tables 4 and 5), and quickly reaches a large number of measurements, especially if temporal kinetic changes during treatment are considered (Wilson et al 1997, 2010, Zhu 2012). However, it is critical for the field of PDT that this large parameter space not become the cause of failed clinical trials nor physician refusal to adopt PDT in their practices. Furthermore, recent information has shown that clinical outcomes may not be linearly related to factors associated with delivered dose (van Duijnhoven et al 2003, Kabingu et al 2009, Kammerer et al 2011), due to a number of nonlinear biological factors.
Table 4. Explicit dosimetry measurements are the key factors in dose, including: (1) photosensitizer, (2) light and (3) oxygen.
| Dose parameter | Prescribed | Minimal sampling | Verification points | 2D data | 3D data | Refs |
|---|---|---|---|---|---|---|
| Photosensitizer | Injected dose | Plasma sampling | Tissue point absorbance/ fluorescence | Tissue surface imaging fluorescence | Diffuse fluorescence tomography | (Braichotte et al 1996, Farrell et al 1998a, Boere et al 2003, Yang et al 2003, Valentine et al 2013, Kanick et al 2014, Mallidi et al 2014) |
| Light | Delivered power/area | Intra-organ measures | Surface or diffuser probes | Interstitial tissue diffuser probes | Diffuse tomography | (Grossweiner, 1986, Powers and Brown, 1986, Werkhaven et al 1986, Wilson et al 1986, Grossweiner et al 1987, Potter et al 1987, Star et al 1987, Arnfield et al 1989, D'Hallewin et al 1992, Foster and Gao, 1992, Marijnissen et al 1993, Heier et al 1995, Beyer, 1996, Braichotte et al 1996, Svaasand et al 1996, Tromberg et al 1996, Bays et al 1997, Wilson et al 1997, Lilge et al 1998, Tan et al 1999, Johansson et al 2002, van Veen et al 2002, Boere et al 2003, Radu et al 2003, Dickey et al 2004, van Veen et al 2006, Zhu and Finlay, 2006, Johansson et al 2007, Swartling et al 2010, Zhu 2012) |
| Oxygen | Blood SO2 | Blood flow monitoring / optical imaging | Point sampling of blood flow, SaO2 or pO2 | Needle electrode tracks / structured light imaging | Diffuse SO2 tomography | (Tromberg et al 1990, Foster and Gao, 1992, Georgakoudi and Foster 1998, 1998b, Kelleher et al 2004, Zhu et al 2005, Woodhams et al 2007, Jarvi et al 2011, Weston and Patterson 2013) |
Note: These are listed with the ways in which they have been shown to be quantified in mechanistic and translational studies.
Table 5. Methods for implicit dosimetry are outlined with values measured and some of the limitations of each technique.
| Method | Value | Limitations | Refs |
|---|---|---|---|
| Photosensitizer photobleaching | • Direct sampling of PS activated | • Limited to surface sampling, point probe measurements or potentially diffuse tomography | (Georgakoudi et al 1997, Farrell et al 1998a, Iinuma et al 1999, Boere et al 2003, Sheng et al 2007, Pogue et al 2008, Jarvi et al 2012) |
| • High signal to noise | |||
| • potential disconnect between 'bulk' tissue and microscopic localization of PS | |||
| Photosensitizer excited state lifetime measurement | • Direct sampling of PS and its instantaneous interactions with oxygen or other molecules | • Specific to oxygen sensitive excited states | (Redmond et al 1994, Aveline et al 1995, 1998, Pogue et al 2001b) |
| • Low signal to noise | |||
| Singlet oxygen phosphorescence | • Direct end product of PDT dose | • Limited to surface sampling or point probe measurements. | (Douzou, 1972, Niedre et al 2005, Jarvi et al 2006, Laubach et al 2008, Lee et al 2011, Jarvi et al 2012, Mallidi et al 2014) |
| • Low signal to noise | |||
| Free radical damage to tissue | • Membrane damage | • Restricted to research | (Mitra et al 2013) |
| • Necrosis morphology | |||
| • Enzyme & blood | |||
| component invasion | |||
| • Requires use of exogenous probes in some cases |
Therefore, as PDT treatments move into Phase II trials, it is important to identify (for a given tumor type and photosensitizer) the one or two key factors that truly limit the dose delivery, and that best correlate to the treatment response. The key challenge for dosimetry is identifying these parameters and choosing clinically acceptable tools capable of measuring those parameters. Ultimately, these measurement modalities will fall within the categories of explicit dosimetry, implicit dosimetry, or surrogate dosimetry. In the case of surrogate dosimetry, some situations will lend themselves to standard clinical practice, which could be ideal for improving physician /patient acceptance of the procedure.
Distillation of dosimetry measurements to the essential factors that dominate the treatment response, along with identification of clinically acceptable surrogates, will be essential to future successes of PDT. While maximal information is always better for scientific understanding, minimal overhead is desired for clinical and commercial success. Finding the proper balance between these competing goals represents an important challenge for the future of PDT as a clinical oncology therapy modality.
Acknowledgments
This work has been funded by NIH Program Project grant P01CA084203.