
Abstract
Proton beam range verification using positron emission tomography (PET) currently relies on proton activation of tissue, the products of which decay with a short half-life and necessitate an on-site PET scanner. Tissue activation is, however, negligible near the distal dose fall-off region of the proton beam range due to their high interaction energy thresholds. Therefore Monte Carlo simulation is often supplemented for comparison with measurement; however, this also may be associated with systematic and statistical uncertainties. Therefore, we sought to test the feasibility of using long-lived proton-activated external materials that are inserted or infused into the target volume for more accurate proton beam range verification that could be performed at an off-site PET scanner. We irradiated samples of ≥98% 18O-enriched water, natural Cu foils, and >97% 68Zn-enriched foils as candidate materials, along with samples of tissue-equivalent materials including 16O water, heptane (C7H16), and polycarbonate (C16H14O3)n, at four depths (ranging from 100% to 3% of center of modulation (COM) dose) along the distal fall-off of a modulated 160 MeV proton beam. Samples were irradiated either directly or after being embedded in Plastic Water® or balsa wood. We then measured the activity of the samples using PET imaging for 20 or 30 min after various delay times. Measured activities of candidate materials were up to 100 times greater than those of the tissue-equivalent materials at the four distal dose fall-off depths. The differences between candidate materials and tissue-equivalent materials became more apparent after longer delays between irradiation and PET imaging, due to the longer half-lives of the candidate materials. Furthermore, the activation of the candidate materials closely mimicked the distal dose fall-off with offsets of 1 to 2 mm. Also, signals from the foils were clearly visible compared to the background from the activated Plastic Water® and balsa wood phantoms. These results indicate that markers made from these candidate materials could be used for in vivo proton range verification using an off-site PET scanner.
Export citation and abstract BibTeX RIS
General scientific summary Conventional proton range verification uses positron emission tomography (PET) to visualize tissue activation. However, this approach is affected by perfusion driven activity washout, a lack of activation at the distal fall-off, and short half-lives which necessitates expensive on-site scanners. Therefore, we investigated the use of patient-implantable proton-activated markers that are strongly activated at the distal fall-off region and decay with relatively long half-lives. We selected three potential isotopes that can meet these criteria: 18O, 63Cu, and 68Zn. We irradiated ≥98% 18O-enriched water, Cu foils (63Cu 69.15%), and >97% 68Zn-enriched foils either directly or when imbedded in tissue-equivalent materials at various depths of the distal fall-off using a 160 MeV proton beam and compared the results to similarly placed tissue equivalent materials. Activation concentrations of 18O, Cu, and 68Zn were 5–100 times greater than those of tissue-equivalent materials when imaged with a PET scanner. Furthermore, the activation and dose fall-offs closely followed one another with offsets of 1–2 mm. Signals from the activated foils show the possibility of using these implantable markers for proton range verification.
1. Introduction
Proton therapy, now recognized as an effective treatment for cancer, is becoming more accessible. Currently, 37 proton therapy centers operate in the world, and 34 more centers are proposed or are under development (http://ptcog.web.psi.ch/). The advantage of proton therapy is that protons deposit their maximum energy at the Bragg peak just before they come to a stop, depositing the largest dose of radiation at a specific depth and very little dose beyond that depth. With the distal dose fall-off region placed just beyond the tumor, it is possible to effectively treat a tumor without irradiating critical organs that are distal to the tumor.
For an optimal treatment outcome, accurate estimation of the proton beam range is crucial. However, current proton beam range estimation techniques which convert CT numbers into stopping powers cannot guarantee accuracy to less than 3.5% of the total proton beam range (Mustafa and Jackson 1983, Alpen et al 1985, Moyers et al 2010, Paganetti 2012). This results in discrepancies that range from several millimeters to more than 1 cm, particularly in inhomogeneous tissue (such as the lung) or tissue that is undergoing anatomical changes due to treatment or motion.
To improve proton range measurement, imaging of proton-activated tissues using positron emission tomography (PET) has been suggested (Paans and Schippers 1993, Oelfke et al 1996, Nishio et al 2005, 2008, Crespo et al 2006, Parodi et al 2007a, 2007b, Knopf et al 2008, Zhu et al 2011). Because high-energy proton beams activate human tissues which subsequently decay by positron emission among other pathways, PET can be used for verification of treatment and range. However, verifying the proton beam range from tissue activation alone is difficult for a number of reasons. First, most elements in human tissue require relatively high proton energies to be activated (Litzenberg et al 1999) and, therefore, are minimally activated near the distal end of the proton beam, which limits the accuracy of proton beam range estimation using PET. Second, radioisotopes created in activated tissues tend to diffuse and perfuse away from the proton interaction point (Tuckwell and Bezak 2007, Parodi et al 2007b), which causes PET images to be distorted away from the proton activation region. Third, the radioisotopes created by tissue activation decay relatively quickly, necessitating an in-beam, in-room or at least an on-site PET scanner, which can be cost-prohibitive or technically challenging for many centers (Shakirin et al 2011, Min et al 2013).
Because of these drawbacks, current in vivo proton therapy range verification using PET is supplemented by Monte Carlo simulations to compare with direct PET measurements. However, this approach has also been shown to have many limitations including the lack of reliable nuclear cross-section data (España et al 2011), tissue elemental composition uncertainty (Schneider et al 2000, Cho et al 2013) and dependable biological washout models (Parodi et al 2007b, Knopf et al 2009, 2011). Therefore, a reliable in vivo proton therapy verification method that is not subject to the above limitations is desired.
As noted earlier, the elemental composition and other characteristics of human tissue limit the ability to accurately determine the proton beam range. However, some stable isotopes of elements, including oxygen, copper, and zinc, have large proton nuclear interaction cross-sections ranging from several hundred to more than 1000 mb (EXFOR library 2013). Furthermore, the interaction energy thresholds of these isotopes is only a few MeV (which equates to a sub-millimeter proton residual range), which could potentially allow PET imaging to determine the end of the proton beam range (figure 1, table 1). In addition, the radioisotopes created by these isotopes decay with relatively long half-lives (tens of minutes). Therefore, when inserted or infused into the target volume, these isotopes could potentially be used to verify the proton beam range with an off-site PET scanner (Cho et al 2009, 2011).
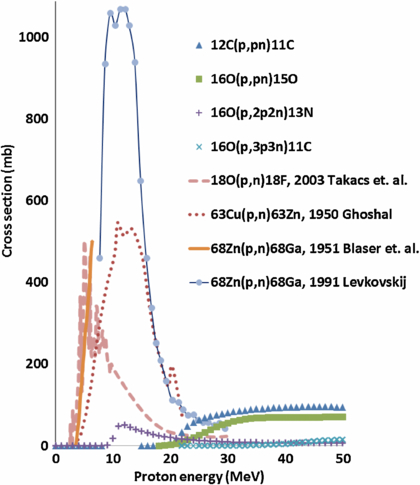
Figure 1. Proton nuclear interaction cross-sections of tissue-equivalent elements 12C and 16O, as well as candidate elements 18O, 63Cu, and 68Zn, that produce positron-emitting isotopes (www.nndc.bnl.gov/exfor/exfor.htm).
Download figure:
Standard image High-resolution imageTable 1. Characteristics of the four most abundant proton-induced reactions in tissue that result in positron decay, along with characteristics of candidate elements.
| Reaction of elements | Maximum interaction cross-section, mb MeV–1 | Interaction threshold energy, MeV | Proton beam range in tissue below threshold energy, mm | Proton beam range below maximum cross-section, mm | Half-life of radioisotope, minutes |
|---|---|---|---|---|---|
| Tissue-equivalent | |||||
| 12C(p, pn)11C | 96/45 | 20.3 | 4.0 | 18.4 | 20.3 |
| 16O(p, pn)15O | 71/53 | 16.6 | 3.0 | 24.7 | 2.0 |
| 16O(p, α)13N | 50/12 | 5.5 | 0.4 | 1.7 | 10.0 |
| 16O(p, αpn)11C | 19/63 | 27.5 | 8.0 | 33.7 | 20.3 |
| Candidate | |||||
| 18O(p, n)18F | 502/5 | 2.6 | 0.1 | 0.4 | 109.8 |
| 63Cu(p, n)63Zn | 546/11 | 3.9 | 0.2 | 1.5 | 38.5 |
| 68Zn(p, n)68Ga | 1070/11 | 3.4 | 0.2 | 1.5 | 67.7 |
Iljinov et al 1994, Nishio et al 2008; www.nndc.bnl.gov/exfor/exfor.htm.
In this study, we investigated the feasibility of using proton-activated implantable markers for proton range verification by testing whether candidate materials such as 18O, 63Cu, and 68Zn would produce a sufficiently large signal at the distal dose fall-off region to reliably determine the proton beam range using PET imaging. We also investigated the relationship between the dose fall-off and the proton activation. Tissue-equivalent materials were irradiated alongside the candidate materials for comparison. Our investigations were conducted for candidate materials that were directly irradiated or embedded in tissue-equivalent phantoms.
2. Materials and methods
2.1. Experimental setup
We examined three candidate isotopes as implantable markers: 18O, 63Cu, and 68Zn. All candidate isotopes had three common characteristics: a large proton interaction cross-section, a low interaction energy threshold, and a relatively long half-life (figure 1, table 1). The three candidate materials used in our investigation were: ≥98% 18O-enriched water, natural Cu foils (natural abundance: 69.15% 63Cu, 30.85% 65Cu), and 97.8±0.2% 68Zn-enriched foils (which we refer to as >97% 68Zn). We also chose tissue-equivalent materials containing 16O and 12C (such as water (99+% H216O), 99+% heptane [12C7H16], and polycarbonate [12C16H1416O3]n) for comparison. These tissue-equivalent materials were chosen since 16O and 12C are responsible for more than 95% of tissue activation in typical patient proton treatments (Litzenberg et al 1999).
Two groups (direct irradiation and embedded irradiation) of experiments were conducted in this research. In each group, two experiments were performed. In the direct irradiation group, the candidate materials were directly irradiated and then PET imaged. In the embedded irradiation group, the candidate materials were first embedded in tissue-equivalent materials such as Plastic Water® and balsa wood and then irradiated before being imaged with the PET scanner. The setups for each of the four experiments are summarized in table 2.
Table 2. Sample irradiation and positron emission tomography (PET) scan setup for each experiment.
| Measurement | ||||
|---|---|---|---|---|
| Group | Direct irradiation | Embedded irradiation | ||
| Experiment | First | Second | First | Second |
| Dose, Gy | 10.0 | 12.5 | 12.5 | 12.5 |
| 90% range, mm | 108 | 110 | 110 | 110 |
| SOBP, cm | 6 | 10 | 10 | 10 |
| Field size, cm × cm | 18 × 18 | 25 × 25 | 10 × 10 | 10 × 10 |
| Irradiation time, | 8.0 | 15.4 | 4.0 | 4.5 |
| minutes | ||||
| Candidate material | 18O-enriched | 68Zn foils, | 68Zn foils, | 68Zn foils, |
| water | Cu foils | Cu foils | Cu foils | |
| Candidate material | 2000 | 10 | 50 | 50 |
| volume, mm3 | ||||
| Tissue-equivalent | Water, heptane | Poly-carbonate | Plastic Water® | Balsa wood |
| material | ||||
| Tissue-equivalent | 2000 | 76 | 500 000 | 1000 000 |
| material volume, mm3 | ||||
| Depth 1, mm/PDD,% | 108/87 | 106.5/99.6 | 106.5/99.6 | 106.5/99.6 |
| Depth 2, mm/PDD,% | 110/49 | 108.5/97.4 | 108.5/97.4 | 108.5/97.4 |
| Depth 3, mm/PDD,% | 112/15 | 110.5/79.2 | 110.5/79.2 | 110.5/79.2 |
| Depth 4, mm/PDD,% | 113/6 | 112.5/38.7 | 112.5/38.7 | 112.5/38.7 |
| Delay time, minutes | 35 | 50 | 95, 155 | 50 |
| PET scan time, minutes | 20 | 30 | 180 | 30 |
2.2. Direct irradiation
For both experiments in this group, we stacked slabs of water-equivalent (with respect to proton stopping power) plastic phantoms (Plastic Water®; CNMC, Nashville, TN) in four columns of different heights on top of the proton treatment couch (figure 2(a)). On top of each column, we placed samples of candidate materials and tissue-equivalent materials. After accounting for the thickness of the treatment couch and container (for liquid samples), the location of the samples corresponded to four different water-equivalent depths at the distal dose fall-off region (100% ∼3% of COM dose) of the proton beam (figures 2(b)). The setup was then irradiated from below the treatment couch using a passively scattered 160 MeV proton beam (Hitachi PROBEAT, Chiba, Japan) at The University of Texas MD Anderson Cancer Center Proton Therapy Center in Houston, Texas. A modulated proton beam of 6 cm and 10 cm spread-out Bragg peak (SOBP), with a field size of 18 × 18 cm2 and 25 × 25 cm2 for the first and second experiment respectively was used to generate a laterally uniform beam to irradiate all the samples.
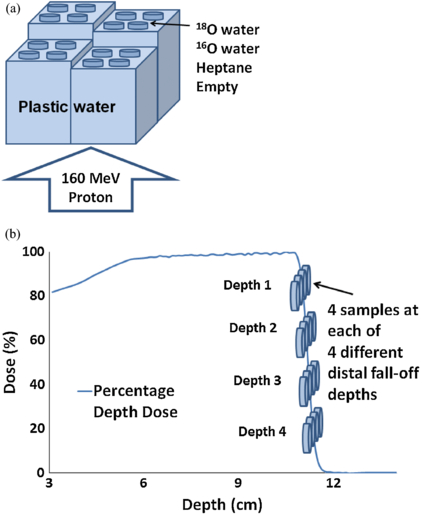
Figure 2. Setup for direct irradiation. (a) Water-equivalent plastic phantoms (Plastic Water®) were stacked to different depths in four columns on top of the treatment couch. The four petri dishes on top of each column contained 99 +% heptane (12C), 99 +% 16O water, ≥98% 18O-enriched water, and blank (empty dish). A 160 MeV proton beam irradiated the samples from below. (b) Locations of the samples on the four columns of water-equivalent plastic phantoms overlaid on the percentage depth dose (PDD) curve of the proton beam. Samples were irradiated at four different depths along the distal fall-off.
Download figure:
Standard image High-resolution imageFor the first experiment in this group, we tested whether the activation of 18O produces a stronger signal than that of endogenous tissue elements (16O and 12C). We used 2 ml samples of ≥98% 18O-enriched water (Matheson, Montgomeryville, PA), 99+% 16O water (distilled water), and 99+% heptane. Each 2 ml sample was placed in a cylindrical polystyrene petri dish with an inner diameter of 3.6 cm, which made each sample 2 mm thick when poured into the petri dish. One empty petri dish was additionally placed at each depth for background measurement, and the samples at the four different depths were irradiated to a dose of 10 Gy. The irradiated samples (three samples + 1 empty at each depth) in petri dishes were then moved to an off-site PET/CT scanner (Discovery PET/computed tomography (CT) 690 scanner, GE Healthcare, Waukesha, WI) at the MD Anderson Center for Advanced Biomedical Imaging Research, which is located approximately 300 m from the Proton Therapy Center. A PET scan was then acquired for 20 min after a delay of 35 min.
The second experiment in this group was performed to compare the activation of two other proposed candidate isotopes (63Cu and 68Zn) with a tissue-equivalent material. An identical setup was used as the first experiment (figure 2); however, 0.10 mm-thick natural Cu foils (Nimrod Hall Copper Company, Springfield, VA; density = 8.96 g cm−3) and 0.10 mm-thick >97% 68Zn-enriched foils (Trace Sciences International, Richmond Hill, Ontario, Canada; density = 7.14±0.50 g cm−3) were used as candidate materials. Natural Cu foils were used because 63Cu's natural abundance is relatively high (69.15%). In addition, 0.76 mm-thick polycarbonate sheets (density = 1.22 g cm−3) were used as a tissue-equivalent material. The water-equivalent thickness of polycarbonate sheets was approximately the same as Cu and 68Zn-enriched foils (about 1 mm), so all samples were activated by the same proton energy fluence. All samples were cut into squares 1 × 1 cm2, yielding volumes of 10 mm3, 10 mm3, and 76 mm3 for 68Zn-enriched foils, Cu foils, and polycarbonate sheets, respectively. Two samples of each material were placed at each of four different depths over the distal dose fall-off region and were irradiated with a dose of 12.5 Gy to the COM. The irradiated 68Zn-enriched foils, Cu foils, and polycarbonate sheets were then moved to the same off-site scanner and scanned for 30 min after a delay of 50 min.
2.3. Embedded irradiation
Two experiments were performed in this group as well. In the first experiment, two types of foil stacks (Cu and 68Zn) were used. Each stack was composed of five 1 × 1 × 0.01 cm3 foils (Cu or 68Zn) placed on top of one another. This process resulted in a volume of 50 mm3 which ensured a large activation signal. A total of four stacks of Cu and two stacks of 68Zn (due to limited availability of 68Zn foils) were made. The Cu and 68Zn stacks were then embedded in slabs of Plastic Water® (as a soft-tissue replacement) at four different depths of the distal dose fall-off range and irradiated (figure 3). To obtain 68Zn activation at four different depths out of two available stacks, two repeat experiments were performed. Repeat experiments were performed with one week interval to allow enough time for activated 68Zn foils to decay. A modulated proton beam (10 cm SOBP) with a field size of 10 × 10 cm2 was used to deliver 12.5 Gy to the samples. The activated phantoms with embedded samples were then moved to the off-site scanner for PET/CT scanning. A much longer delay and PET scan duration were required for this experiment due to the high background signal from Plastic Water®. This high background is mainly from high 12C (46.7% of mass fraction composition) of Plastic Water®. Its complete elemental composition is shown in Ramaseshan et al 2008.
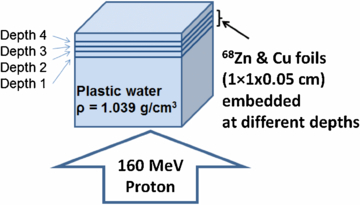
Figure 3. Setup for imbedded irradiation. 68Zn and Cu foils at a volume of 1 × 1 × 0.05 cm3 were sandwiched between Plastic Water® at four different distal dose fall-off depths. Phantom was irradiated using a 160 MeV proton beam.
Download figure:
Standard image High-resolution imageThe setup of the second experiment in this group was identical to the first experiment (figure 3) except for using a high-density (∼0.3 g cm−3) balsa wood (Turner Toys, Essex Junction, VT) phantom as a human lung replacement (average density ∼0.3 g cm−3) instead of Plastic Water®. Cu foils were placed at all four depths while 68Zn foils were placed at depths 2 and 3 only. No repeat experiment was performed in this case to place the 68Zn stacks at depths 1 and 4. The depths of each sample in balsa wood were determined from CT simulation followed by treatment planning performed using a Varian Eclipse™ treatment planning system (Palo Alto, California). The activated phantom with samples was then moved to the off-site scanner and scanned for 30 min after a delay of 50 min. The chemical composition of balsa wood (Ochroma lagopus) is shown in Sjo˘stro˘m 1981 and 12C also comprises about 50% of mass.
All PET data in the four experiments were acquired without decay correction. The mean and standard deviation of the activation signal intensity in the candidate material was then measured in regions of interest drawn on the corresponding PET images. The normalized percentage of activity (normalized to maximum activity) for each sample was then compared with the percentage depth dose (PDD) curve in the distal dose fall-off region. The PDD data used for comparison is based on the commissioning data which also agrees with the most recent annual data (2012). However, the accuracy of the data was checked by point Markus ionization chamber measurements prior to each experiment throughout this research. For the liquid samples (direct irradiation group, first experiment), background signal was calculated from the image of an empty petri dish and was subtracted from the signals from each of the liquid samples.
For all PET imaging procedures, the samples were separated by more than 1 cm to minimize the impact of partial volume effects. Each depth/PDD value in table 2 represents the middle depth of the sample and the PDD in the middle of the sample. All depths are water-equivalent depths.
2.4. Monte Carlo simulation
Monte Carlo simulations were performed for two purposes. The first purpose was to find the PDD depths at which candidate materials should be placed to obtain adequate signal for proton range verification. The second purpose was to compare the Monte Carlo-simulated relative signal intensities of candidate materials to those of the tissue-equivalent materials over the distal dose fall-off region in both experiments of the direct irradiation group. A modulated SOBP proton beam delivered by a double-scattering system was simulated. The beam line model was validated by Titt et al (2008) using the MCNPX Monte Carlo code (Waters et al 2005) and was based on blueprints of the MD Anderson Cancer Center proton gantry and nozzle provided by the manufacturer (Hitachi Ltd., Tokyo, Japan). This model was used to generate a PDD curve in a water phantom. The Monte Carlo-generated PDD curve was matched with measurement data at the distal 90% dose depth. The distal 90%–10% dose fall-off region agreed with the commissioning as well as annual measurements to within ±0.2 mm (±4% dose). This agreement was necessary because the accuracy of the location and shape of the distal dose fall-off region was crucial for this study. Particle information for the transported protons, such as particle fluence and its energy distribution (particle energy fluence), was scored at several depths within the distal dose fall-off region. To calculate the proton induced activation of different samples, the product of published cross-section data and the proton energy fluence (MCNPX tally type 4) at each depth was integrated. Activity contributions from secondary neutrons were ignored in this calculation for simplicity, because the secondary neutron fluence was small compared to the total number of protons. Furthermore, the probability of producing positron emitters is smaller for neutrons than it is for protons. Details of the Monte Carlo simulation technique were described by Seravalli et al (2012)), whose MCNPX activity simulation was followed. All cross-sections used here were from experimental data available in the EXFOR library (www.nndc.bnl.gov/exfor/exfor.htm).
3. Results
PET images obtained from the first experiment of the direct irradiation group are shown in figure 4(a). The normalized activity in the samples placed at the proton beam distal fall-off depths is tabulated in table 3 and also shown in figure 4(b). The vertical error bars represent standard error computed with 95% confidence limits. The uncertainty in the distal dose fall-off location of the beam, which is shown as horizontal error bars, was on the order of ±1 mm which is equivalent to the standard error of the commissioning data. The relationship between the percentage of proton activity in 18O water and depth followed closely the distal dose fall-off curve with an offset less than 1 mm. The Monte Carlo simulations agreed with measured activity within 5% difference for all three samples (figure 4(b)).
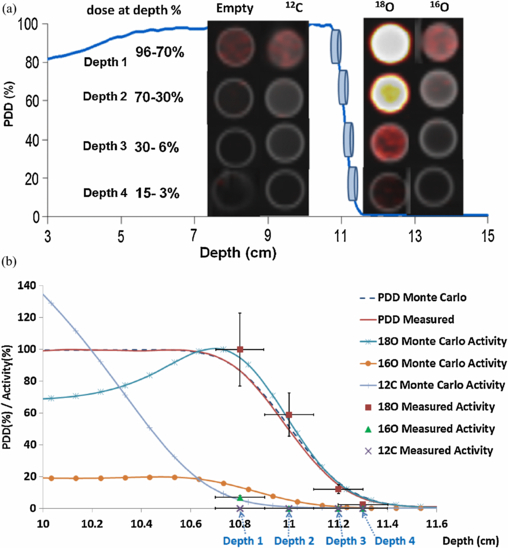
Figure 4. Direct irradiation—first experiment. (a) PET/CT fusion images of petri-dishes containing nothing (empty), heptane (12C), 18O water, 16O water are arranged along the various depths. (b) PET signals from each sample were quantified and overlaid on the PDD curve of the proton beam. Vertical error bars represent the standard error with 95% confidence limits. Monte Carlo results are shown for comparison.
Download figure:
Standard image High-resolution imageTable 3. Direct irradiation—first experiment: percentage activity (mean ± standard error) per unit volume for 18O-enriched water, 16O water and heptane at four different distal fall-off depths. Errors in 95% confidence limits.
| Percentage activity (%) | ||||
|---|---|---|---|---|
| Depth | PDD | 18O-enriched water | 16O water | Heptane |
| Depth 1 | 96–70% | 100±23% | 7±2% | <1% |
| Depth 2 | 70–30% | 59±14% | <1% | <1% |
| Depth 3 | 30–6% | 12±3% | <1% | <1% |
| Depth 4 | 15–3% | 3±1% | <1% | <1% |
PET images from the second experiment of the direct irradiation group are shown in figure 5(a). PET signals from the polycarbonate sheets were comparable to those from 68Zn and Cu foils, despite the fact that the polycarbonate volumes were 7.6 times greater than those of the 68Zn and Cu foils. The polycarbonate sheets show a strong activity signal only at depth 1 while 68Zn and Cu foils show relatively strong activity till depth 3. PET signals were normalized to a unit volume and overlaid on the PDD profile at the distal dose fall-off depth (figure 5(b)). The activities per unit volume at four distal fall-off depths are tabulated in table 4 and also shown in figure 5(b). The change in activity of 68Zn and Cu with depth resembled the change in dose, with offsets of approximately 1 mm and 2 mm, respectively. Monte Carlo simulations agreed with measurements with a mean difference of 7% (figure 5(b)); however, the measured polycarbonate activation was consistently higher (maximum difference of 23%) than the Monte Carlo-simulated polycarbonate activation.

Figure 5. Direct irradiation—second experiment. (a) PET/CT fusion images from the polycarbonate sheets (PC), 68Zn and Cu foils are arranged along the different depth locations. (b) PET signals per unit volume were quantified and overlaid on the PDD curve of the proton beam.
Download figure:
Standard image High-resolution imageTable 4. Direct irradiation—second experiment: percentage activity (mean ± standard error) per unit volume for 68Zn-enriched foil, Cu foil and polycarbonate at four different distal fall-off depths. Errors in 95% confidence limits.
| Percentage activity (%) | ||||
|---|---|---|---|---|
| Depth | PDD | 68Zn-enriched foil | Cu foil | Polycarbonate |
| Depth 1 | 100–99% | 80 ± 28% | 67 ± 16% | 30 ± 2% |
| Depth 2 | 99–95% | 100 ± 21% | 91 ± 16% | 8 ± 5% |
| Depth 3 | 87–71% | 68 ± 6% | 32 ± 19% | 2 ± 1% |
| Depth 4 | 49–29% | 2 ± 2% | 17 ± 1% | <1% |
Figure 6 shows PET/CT fusion images from the first experiment of the embedded irradiation group (50 mm3 samples irradiated with 12.5 Gy using a 10 × 10 cm2 beam). Figures 6(a)–(d) are from the first image reconstruction—a 95 min post-irradiation delay followed by a 3 h scan. Figures 6(e) and (f) are from the second image reconstruction—a 155 min post-irradiation delay followed by a 3 h scan. Figures 6(a), (b), and (e) show the activation of the phantom and foils with a beam's-eye view. Figures 6(c), (d), and (f) show a lateral view of activation, with the proton beam incident from below. For the first image reconstruction, activation of the 68Zn foils is seen at depths 1–3 but not depth 4 (figures 6(a)–(d)). Activation of the Cu foils was seen only for depth 1 and only after a much longer delay of 155 min (figures 6(e) and (f)) because of the high background 11C signals coming from the Plastic Water® phantom.

Figure 6. Embedded irradiation—first experiment. 68Zn and Cu foil samples (50 mm3) were sandwiched in four different depths of Plastic Water® and were proton activated and PET/CT fusion images are shown. (a) Beam's-eye view of depths 1 and 2 for 68Zn and Cu. (b) Beam's-eye view of depths 3 and 4 for 68Zn and Cu. (c) and (d) Lateral views for 68Zn. (e) Beam's-eye view of depth 1 for Cu. (f) Lateral view for Cu at depths 1 and 2. Image reconstruction conditions for (a), (b), (c), and (d) were a 95 min delay followed by a 3 h scan; (e) and (f) were obtained with a 155 min delay followed by a 3 h scan.
Download figure:
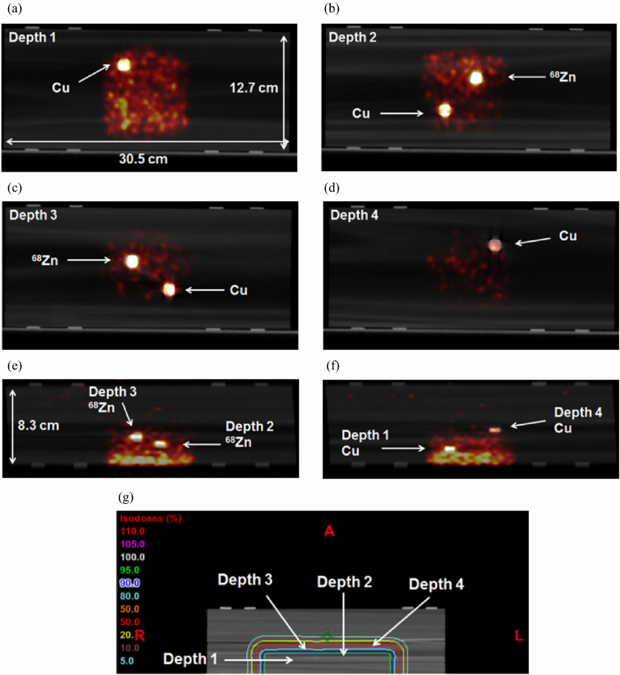
Standard image High-resolution imageFigures 7(a)–(f) shows PET/CT fusion images from the second experiment of the embedded irradiation group. The phantom was irradiated by 12.5 Gy, and PET scanning lasted for 30 min after a 50 min delay. All irradiated foils were strongly activated. The relatively weaker activation of Cu at depth 4 indicated the distal margin of the proton activation. The location of each depth is shown relative to the isodose curves created from a CT simulation is shown in figure 7(g).
Figure 7. Embedded irradiation—second experiment. Samples (50 mm3) sandwiched at four different depths (for Cu foils) and at depths 2 and 3 (for 68Zn foils) of balsa wood were proton activated and PET/CT fusion images are shown. (a)–(d) Beam's-eye views of depths 1–4. (e) and (f) Lateral views. (g) Isodose curves are shown relative to each depth location. The phantom was irradiated by 12.5 Gy, and PET scanning lasted for 30 min after a 48 min delay.
Download figure:
Standard image High-resolution image
4. Discussion
In this research we performed experiments showing that when candidate materials such as 18O, 63Cu, and 68Zn are irradiated with protons, a much stronger PET signal intensity will be produced compared to tissue-equivalent materials over the proton distal fall-off region. This demonstrates that the candidate isotopes could possibly be used as implantable markers for proton beam range verification using PET.
In this study, we investigated the feasibility of using proton-activated implantable markers for proton range verification by testing whether candidate materials such as 18O, 63Cu, and 68Zn would produce a sufficiently large signal at the distal dose fall-off region to reliably determine the proton beam range using PET imaging. Once irradiated, the markers would be activated and would emit positrons with relatively long half-lives. This would allow a delayed PET scan to detect the strong signals only from the markers, because most activated patient tissue would decay after tens of minutes due to their inherent short half-lives.
At a minimum two markers would be required to verify the proton range. One would be implanted proximally near the distal fall-off region (at a shallower depth) and the other distally (outside the field). These markers should be implanted with a separation along the direction perpendicular to the beam and a small separation in the beam direction to minimize beam-shadowing. When one proximal marker is activated and the other distal marker is not, it can be assumed that the proton beam stopped between the two fiducial marker depths. The CT images can help to distinguish the activated markers from the non-activated markers because CT and PET images are obtained sequentially in current PET/CT system.
The candidate isotopes tested in this work could be manufactured as biocompatible implantable markers that could serve as proton-activated markers. 18O enriched water is not toxic because it is biologically identical to 16O water. Also, Zn is an essential mineral in the body and has no known toxicity from moderate consumption. However, Cu has some known side effects such as fatigue, depression and skin reaction (Brewer 2010). Also a study by Tindel et al 2001 showed that small fragments of Cu that were surgically implanted on the spinal cords of rabbits caused a localized neural injury. However in cases where the toxicity of implanted elements is a concern, the implants can be coated with biologically compatible elements such as Ti to alleviate this concern.
Figures 7(e), (f) show the potential of this approach. While it is difficult to define the furthest activation depth from phantom (or patient tissue) activation alone, due to the gradual decrease of activity and the resultant increase in PET image noise, activation of implanted foils show the distinct end of activation at depth 4. By correlating the signal from implanted markers and the PDD, it is possible to estimate the proton range.
It was observed that the measured activity from polycarbonate sheets was consistently greater than the Monte Carlo-simulated activity (figure 5(b)). This could be attributed to the higher kinetic energies of positrons from 68Zn and Cu progeny radioisotopes (∼1 MeV) compared to those from 11C (385.7 keV) (EXFOF library 2013). Alternatively, the smaller thickness of foils compared to polycarbonate sheets could cause more positrons to escape from the foils than from the polycarbonate sheets thereby resulting in a lower PET signal.
Monte Carlo simulation was only performed for the direct irradiation group of experiments to validate quantitatively the relative activity of candidate materials compared to tissue-equivalent materials. The same validation was not necessary for the experiments in the embedded irradiation group because the purpose of these experiments was primarily to demonstrate that the signals from the embedded candidate materials are strong enough to be visible despite the background signals from tissue-equivalent phantoms.
A long PET scan duration (3 h) was required (figure 6) for 68Zn and Cu foils embedded in Plastic Water® to be imaged above the background signal. A typical 30 min PET scan did not provide enough SNR for 68Zn and Cu foils due to the high background signal. The high background signal from the phantom was mainly due to the high 12C content (mass 12C fraction: 46.7%, physical density: 1.039 g cm−3) of Plastic Water® (Ramaseshan et al 2008). Figures 6(a)–(d) show moderate SNR from 68Zn foils but not from Cu foils. This result is expected due to the higher interaction cross-section of 68Zn and the longer decay half-life of its progeny radioisotopes compared to Cu. For the same volume of 68Zn and Cu foils embedded in balsa wood, activation was much stronger than the background, although the phantom and inserts were scanned for only 30 min. This result was mainly due to the lower background signal coming from the balsa wood's lower physical density (∼0.3 g cm−3), despite having a high 12C fraction (∼50%). Both Plastic Water® and high density balsa wood are not ideal tissue-equivalent materials in activation studies due to their higher 12C content. The average 12C mass fraction in soft-tissue is typically less than 20% (ICRU Report 46 (ICRU 1992)).
With the exception of the first experiment in the embedded irradiation group, all PET scan times were 20 min or 30 min which corresponds to the maximum patient whole body PET scan time. A 20–30 min PET scan corresponds to a typical whole body eyes to thighs scan duration and is expected to be tolerable by patients. The scans were acquired at a different delay time to provide the maximum SNR compared to background signals from phantoms or tissue-equivalent materials.
A relatively large dose (10 or 12.5 Gy) and volume (50 mm3 for imbedded irradiation) were used in this feasibility study to ensure a strong signal from the candidate materials. Although, 12.5 Gy is the daily dose used for thoracic stereotactic body radiation therapy (SBRT) patients at our institution, a 2 Gy daily dose (1 Gy per field) is more commonly used. Also, a typical mid-atomic numbered (non-gold) fiducial markers has a smaller size (about 10 mm3) than what was used in this feasibility study. We are currently in the process of investigating the sensitivity of the proposed candidate materials for more practical volumes (∼10 mm3) and dose (∼2 Gy). The result of this investigation will be the subject of a future publication.
There are several advantages of the proposed approaches. These include the relatively high atomic numbers of some of the candidate isotopes (Cu and 68Zn), to also serve as radiographic fiducial markers when surgically implanted into the target or the distal organ (for example, the lung or the liver) prior to proton therapy. The proposed markers may replace radiographic fiducial markers with the added benefit of proton beam range verification. Another advantage of the proposed candidate materials is their minimal dose perturbation or shadowing. As reported by Cheung et al 2010, Huang et al 2011, non-gold fiducial makers have the advantage of significantly less dose perturbation compared to gold fiducial makers due to their smaller atomic numbers. The proposed materials (Cu and 68Zn) have similar atomic numbers to the currently available non-gold fiducials makers and are expected to provide the same benefit.
Finally, thoracic SBRT patients can benefit greatly from this application due to the large daily dose as well as the large uncertainties in proton range calculation using the treatment planning system. Additionally, the SNR of the lung-implanted proton-activated markers is expected to be greater than our balsa wood experiment because the typical fraction of 12C in the lung is only around 10% (Woodard and White 1986) while balsa wood is around 50%.
There are limitations of the use of implanted markers for proton range verification. These include the invasive nature of the procedure and the limited information achieved. Only a single or multiple point verification can be obtained rather than a volumetric proton range verification. Implanting more markers on the other hand will provide more volumetric proton range information, however this could increase organ stress due to multiple needle punctures. Implanting a small number of markers, however, can still satisfy some clinical needs; for example, by implanting only two markers in front of critical organs such as the spinal cord, we can verify the proton range as well as the irradiation of that organ. Another limitation of this feasibility study includes our use of idealized samples (flat liquid samples and foils) and phantoms made of plastic or wood. Future studies should use representative shapes (eg., cylinder) that facilitate implantation in soft tissue or lung and the use of more realistic phantoms that include tissue heterogeneity.
18O-enriched water was included in our experiment, although its application seems unlikely, unless it is encapsulated. However, despite other disadvantages including perfusion driven wash-out, oxygen offers the advantage of being a major component of human tissues. If consumed as 18O water or injected into the tissue region to obtain enough concentration, it can be used for proton range verification assuming 18O-enriched water can be obtained cheaply in the future.
To the best of our knowledge, this is the first investigation evaluating the feasibility of implantable or infusible materials for in vivo proton beam dose and range verification using PET. Our results indicate that the three materials we studied—18O-enriched water, natural Cu foil, and 68Zn foil—could potentially be used for in vivo proton beam range verification. Future research will be performed using a thoracic anthropomorphic phantom and realistic stereotactic body radiotherapy. This future study will address the sensitivity issue in proton activation and radiographic visibility as well as the optimal delay and PET scan time.
Acknowledgments
The authors thank Reinhard Schulte at Loma Linda University Medical Center; Pablo Yepes at Rice University; Wen Hsi at ProCure Treatment Centers; Moiz Ahmad at Stanford University; Francesco Stingo in the Department of Biostatistics; Lawrence Bronk, Bryan Stewart, Kevin Casey, and Kevin Vredevoogd in the Department of Radiation Physics; Ryan Bosca in the Department of Imaging Physics and the Department of Scientific Publications at The University of Texas MD Anderson Cancer Center. This research was supported in part by the National Institutes of Health through MD Anderson's Cancer Center Support Grant (CA016672).