

Abstract
Transient heat pulses with triangular, square, and ELM-like temporal shapes are investigated in order to further understand how transient plasma instabilities will affect plasma facing components in tokamaks. A solution to the 1D heat equation for triangular pulses allows the peak surface temperature to be written analytically for arbitrary rise times. The solution as well as ANSYS simulations reveal that a positive ramp (maximum rise time) triangular pulse has a higher peak surface temperature by a factor of  compared to that from a negative ramp (rise time = 0) pulse shape with equal energy density, peak power, and pulse width. Translating the results to ITER, an ELM or disruption pulse with the shortest rise time is the most benign compared to other pulse shapes with the same peak heat flux and same energy density.
Export citation and abstract BibTeX RIS
1. Introduction
Transient heat loads due to ELMs on the ITER divertor will push the boundaries of material limits. Facilities around the world have been testing tungsten (W) and other materials using pulsed plasma sources [1, 2], electron beams [3], and lasers [4–7]. With the exception of Magnum-PSI [8], most of these facilities do not reproduce the characteristic temporal shape of an ELM which has a fast rise time and longer decay time. The motivation for the present work is to understand how the temporal shape of a transient heat pulse influences the surface temperature and the surface damage. This is particularly important because the ITER ELM damage threshold of 0.5 MJ m−2 was established based on high heat flux testing done at QSPA with a temporal pulse shape that was approximately a symmetric triangle (equal rise and decay times) rather than ELM-like. We show here that even with the same energy density and pulse width, the shape of the heating pulse has a significant effect on the peak surface temperature reached during the pulse and on the level of surface damage caused by the heat pulse.
2. Heat pulse simulations
Finite-element simulations of the temperature evolution with different temporal pulse shapes were performed with the ANSYS code using a 30 mm diameter W disc with thickness 1 mm. A circular spatially uniform heat pulse with diameter 1.5 mm was used with different temporal pulse shapes. Temperature-dependent values were used for the thermo–mechanical properties. Figure 1 shows a comparison between two square heat pulses and two symmetric triangular pulses. The peak surface temperatures are different despite the fact that the 2 GW m−2 triangular pulse and the two square pulses all have the same energy density (1 MJ m−2), and the fact that the same peak power densities were used for each triangle–square pair. The peak temperature reached during the 2 GW m−2 square pulse is highest even though the pulse width is the smallest of the four pulse shapes. The maximum temperature of the triangular pulses is reached 0.66 ms after the start of the pulse, or 0.16 ms after the peak of the heat pulse. For the square pulses, the temperature increases continuously with a square root of time dependence (as expected) until the heat load is finished. The 1 GW m−2 triangular pulse with energy density of 0.5 MJ m−2 causes a significantly lower peak temperature than the 1 GW m−2 square pulse even though the peak heat fluxes and pulse widths are the same.

Figure 1. Four simulated heat pulse shapes are shown in (a). The surface temperature and the time derivative of the surface temperature are shown in (b) and (c), respectively. The half amplitude symmetric triangle heat pulse has energy density of 0.5 MJ m−2, and all other heating pulses have energy density of 1 MJ m−2.
Download figure:
Standard image High-resolution imageFigure 1(c) shows the heating and cooling rates for the four simulated pulse shapes. The heating rates for the square pulses are very high at the beginning of the pulses and decrease continuously during the pulse. A very strong cooling rate is also obvious because at the end of the heat pulse the power goes to zero almost instantaneously. For the triangular pulse, the rate of temperature change increases more progressively and the cooling rate curve is much less steep. The rate of temperature change is expected to affect the strain rate in the material, leading to differences in surface damage.
Figure 2 shows that as the rise time τr of equal-energy-density triangular pulses is increased, the peak surface temperature increases. The reason that different pulse shapes with the same energy density and pulse width produce different peak surface temperatures is the diffusive nature of heat. A triangular pulse shape with a short rise time and long decay time creates a smaller peak surface temperature than a triangular pulse with a longer rise time, because the long tail contributes to the total energy density but only has a moderate effect on raising the surface temperature.
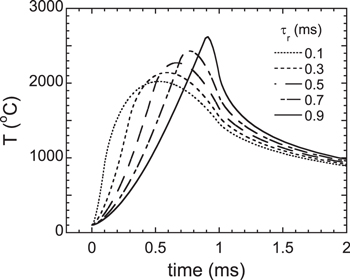
Figure 2. Simulations of the surface temperature evolution for triangular heat pulses with various rise times τr. The peak power density is P0 = 2 GW m−2 and total pulse width τw = 1 ms, all with the same energy density.
Download figure:
Standard image High-resolution image3. Analytic solution for triangular temporal pulse shape
The 1D heat equation for an arbitrary triangular temporal pulse shape can be solved analytically [9]. The peak surface temperature rise as a function of the heating pulse rise time for a triangular pulse shape is given by

where  is the peak absorbed power density in units of W m−2, τw is the total pulse width (s), κ is the thermal conductivity (W m−1 K−1), ρ is the density (kg m−3), c is the specific heat (J kg−1 K−1), and τr is the rise time (s). This solution can also be written in terms of the total absorbed energy density E, because for a triangular pulse
The analytic solution for the time  at which the peak surface temperature occurs for a triangular heat pulse is given by

Thus, an infinitely fast rise time with a 'negative ramp' pulse shape  results in the peak surface temperature being reached after a duration equal to half the total pulse width. At the other limit of a 'positive ramp' shape, in which the rise time is the maximum possible,
  the peak surface temperature is reached at the end of the pulse as expected since the heat load is zero for
  .
.
Equations (1) and (2) are compared with ANSYS simulations in figure 3, and there is excellent agreement. However, the analytic solution assumes that the thermo–mechanical properties such as thermal conductivity do not change significantly over the temperature range of interest, and thus caution must be used if the analytic result is used instead of simulations. The peak surface temperature rise for triangular pulses has been normalized to that for a 'half width' square pulse with same peak power density and same energy density as the triangular pulses (and thus the pulse width for the square pulse is equal to half the triangular pulse widths). The normalizations were done in the following way: for the ANSYS data points in figure 3, the half width square pulse was simulated; and for the analytic results shown by the solid line, the solution for the peak surface temperature rise for a square heat pulse was used:

where  is the pulse width of the square pulse.
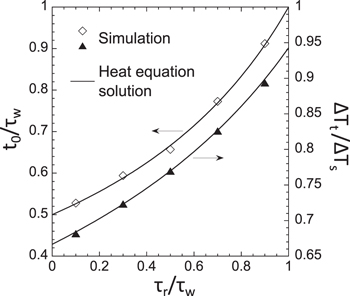
Figure 3. ANSYS simulations (symbols) of triangular heat pulses with various rise times τr. The white diamond data points (left vertical axis) show the normalized time to/τw at which the peak surface temperature occurs (t = 0 is the start of the pulse), and the black triangle data points (right axis) show the normalized peak surface temperature rise. The solid lines are the solution to the heat equation for a triangular pulse. The peak surface temperature rise is normalized to that for a half width square pulse.
Download figure:
Standard image High-resolution image4. Surface roughness after laser heating
The PISCES-B facility [10] was used to expose W samples to heat pulses with different temporal pulse shapes from an Nd:YAG laser with wavelength of 1064 nm and an approximately Gaussian spatial profile [11]. The laser pulse repetition frequency was low (0.2 Hz) and the sample cooled to the base temperature between laser pulses. After laser irradiation, the surface roughness was measured with a confocal microscope along line profiles through the center of the laser spot extending to the edge of the damaged area, and four measurements were done at different orientations for each laser spot. We use the root mean square (rms) roughness Rrms, which is defined as the rms average of the surface height deviations relative to the mean height. The roughness is used as a measure of surface damage because it can be readily quantified, and it is a precursor to more extreme damage such as melting and cracking. Roughness occurs due to the cumulative plastic deformation of the material at the surface. With repeated cycling, the surface roughness increases due to the repeated movement of dislocations caused by thermal expansion during heating and contraction during cooling.
Figure 4 shows that the heat-induced surface damage depends on the temporal shape of the heating pulse even with the same energy density and same peak power density. A positive ramp pulse shape produces more surface roughness than other triangular pulse shapes, and it also produces more roughness than a square pulse that has lower peak power density but the same energy density. Using a fast pyrometer, we have observed the surface roughness depends mainly on the peak surface temperature reached during the pulse, which was also found in [5].

Figure 4. Surface roughness of W measured with a confocal microscope after irradiation by 100 laser pulses with laser spot diameter ∼1 mm. Four different temporal pulse shapes were used by the laser during He plasma exposure with base temperature 420 °C. The peak absorbed power density for all the triangular pulses (negative ramp, symmetric triangle, and positive ramp) was approximately 0.3 GW m−2, and for the square pulses Po ∼0.1 GW m−2. Different energy densities were achieved by varying the pulse width from 0.8 to 10 ms. The rms surface roughness with no laser irradiation was 0.05 ± 0.01 μm.
Download figure:
Standard image High-resolution image5. ELM-like pulse shape
ELMs have a fast rise time and longer decay time due to the physics of plasma pedestal collapse and the transit time for the pedestal ions to reach the divertor [12]. Since the ITER ELM damage threshold was based on heat testing done at QSPA using approximately a symmetric triangle pulse shape, we compare laser-induced damage from a symmetric triangle heat pulse to that from a characteristic ELM pulse shape. The ITER ELM damage threshold is specified in terms of energy density, and thus we use laser pulse shapes with the same energy density. The ELM pulse shape has a rise time of 250 μs and total pulse duration of ∼1.1 ms and is chosen based on [13]. The long tail of the ELM contributes to the total energy density, and thus the peak power for the ELM-like pulse shape is lower than that for the symmetric triangle.
The surface roughness shown in figure 5 is significantly lower for the ELM-like pulse shapes compared to the symmetric triangular pulse. As the cycle number increases above ∼10, the laser-induced roughness becomes measurable. We have also used a fast pyrometer to measure the temperature averaged over the laser spot (the Gaussian laser profile creates a higher temperature at the center of the spot, however), and found that the triangular pulse produces a higher surface temperature than the ELM-like pulse.

Figure 5. The root mean squared surface roughness Rrms of W as a function of the number of heating and cooling cycles for two pulse shapes, both with the same energy density of ∼0.5 MJ m−2. The pulse widths were 0.6 and 1.1 ms and the spatially averaged peak temperatures were ∼1600 °C and ∼1200 °C for the symmetric triangle and ELM-like pulses, respectively. The base temperature was 30 °C between laser pulses, and the laser spot diameter was ∼0.5 mm. The dashed lines are guides for the eye.
Download figure:
Standard image High-resolution image
6. Conclusions
We use 3D ANSYS simulations, an analytic solution for triangular heating pulses, and laser heating experiments to show that the temporal pulse shape has a significant effect on the peak surface temperature rise and surface damage. Comparing a half width square pulse to triangular pulse shapes with the same energy density shows that the peak surface temperature rise is lowest for a negative ramp triangular pulse.  increases with the rise time for the triangular pulses, and the highest
  is produced by a half width square pulse (equal peak power as the triangular pulses but half the pulse width). The results show that the pulse shape, pulse width, and either the energy density or peak power density are necessary to fully describe a transient heat pulse. For ITER, the results indicate that for a given energy density and pulse width, a heat pulse with the fastest rise time would cause the least amount of surface damage.
The ITER ELM damage threshold is specified in terms of energy density and the limit was established based on the melting threshold of W using a symmetric triangle pulse at the QSPA facility [1]. Thus, the ramifications of a characteristic ELM pulse shape for ITER are encouraging, because similar to a negative ramp triangle pulse shape, the long tail of an ELM contributes to the energy density but only marginally to the surface temperature rise. A heat pulse with an ELM-like temporal shape will result in a lower peak surface temperature and lower damage level compared to a symmetric triangle heat pulse with the same energy density. Thus, the temporal shape of an ELM creates a slight margin of safety to the established ITER ELM energy density damage threshold of 0.5 MJ m−2. For the ELM shape studied here and up to 500 heating cycles, the surface roughness is 2–3x smaller than that produced by a symmetric triangle heating pulse with the same energy density. Future work includes investigating the effects of temporal pulse shape at higher pulse number, since the damage threshold has been observed to decrease with larger pulse number [14].
Acknowledgments
This work was supported by US DOE Grant No. DE-FG02-07ER54912. The views and opinions expressed herein do not necessarily reflect those of the European Commission or the ITER Organization.