
Abstract
At present, imaging of cochlear mechanics at mid-cochlear turns has not been accomplished. Although challenging, this appears possible with partially coherent hard x-rays. The present study shows results from stroboscopic x-ray imaging of a test object at audio frequencies. The vibration amplitudes were quantified. In a different set of experiments, an intact and calcified gerbil temporal bone was used to determine displacements of the reticular lamina, tectorial membrane, and Reissner's membrane with the Lucas and Kanade video flow algorithm. The experiments validated high frequency x-ray imaging and imaging in a calcified cochlea. The present work is key for future imaging of cochlear micromechanics at a high spatial resolution.
Export citation and abstract BibTeX RIS

Content from this work may be used under the terms of the Creative Commons Attribution 3.0 licence. Any further distribution of this work must maintain attribution to the author(s) and the title of the work, journal citation and DOI.
Introduction
A key step in the transformation of acoustic into electric information plays the cochlea with its complex interplay of different processes including electro-chemistry, cell biology and mechanical tissue properties [1–8]. Therefore, knowledge of undisturbed cochlear anatomy and the micromechanics of the organ of Corti constitute an important factor in understanding the working of the inner ear [6, 9, 10]. Static and dynamic imaging of the cochlea may provide essential information on cochlear function. At present, the main challenge relates to imaging the structures under realistic conditions. In particular, it would be desirable to record soft tissue dynamics (such as the movement of membranes) in a temporal bone preparation or—even more challenging—in a pristine cochlea.
Current imaging modalities employed for this purpose are facing multiple challenges. Visible light microscopy provides detailed information on the micron-length scale. Under dynamic conditions structural displacements of tenths of nanometers can be detected. However, the cochlea has to be opened for this type of study [9, 10]. Non-invasive methods such as magnetic resonance imaging preserve the integrity of cochlear structures [11]. Nevertheless, imaging of soft tissues and its displacements appears not feasible because of the low sensitivity of the method. More recently, optical coherence tomography (OCT) has been introduced as a promising alternative imaging method [12–23]. The relatively short penetration depth of the radiation used for OCT, limits the applications of the technique to small cochlea such as those from mouse. Typically the penetration depth is less than 1 mm.
X-rays are usually employed for any non-invasive study and are wide-spread used in medical imaging. When imaging soft tissue, contrast agents such as iodine are commonly used. With the technological progress regarding x-ray sources, new imaging modalities are available.
One method—the so-called in-line phase contrast imaging technique—exploits the coherence property of the radiation [24–30]. Even weakly absorbing objects in the cochleae can be identified through the interference effects, enhancing the edges of the structure [31–33]. One source for generating (partially) coherent x-rays are synchrotrons. The high brilliance of the radiation allows not only imaging weakly absorbing structures at micron resolution and better, but also performing time resolved studies. Energy and contrast can be tuned over a large extend to exploit the parameter space for optimal experimental conditions.
In the past imaging of soft tissue in closed cochlea has been demonstrated [31–42], in the present work we extend the study for dynamic imaging. In order to validate the experimental method, we examined the detection limit of small displacements for a metal needle at audio frequencies.
Secondly, we recorded small displacements of cochlear soft tissue in the unopened calcified cochlea. Both experiments provide the elemental information needed to perform a detailed, minute study of cochlear micromechanics. Meanwhile, we have been developing a method for imaging membrane resonances in function of the frequency and will report about the latter on a different occasion.
Methods
The experimental setup
The x-ray experiments have been carried out at third generation Synchrotron facilities. The cochlear measurements were done at the 34 ID-C station of the Advanced Photon Source (APS), Argonne National Laboratory, the stroboscopic imaging experiments at the recently built I13 Imaging and Coherence beamline at Diamond Light Source [43]. Diamond is the latest UK based synchrotron of the 3rd generation, operating at 3 GeV electron energy. The I13 beamline is located in a long straight section of the storage ring, cut into two sub-sections by intermittent focussing magnets. Undulator radiation sources are located in each of these sections, one is dedicated to the 'imaging' branch, also known as the 'Diamond-Manchester branchline'. The ID of the 2 m long device can be closed to 5 mm gap, providing 1.5 × 10¹² photons monochromatic beam (ΔE/E = 10−4) at 13 keV photon energy. The current experiment was carried out during the commission phase of the beamline, closing the gap to 8.75 mm. A 'pink' beam was generated extracting from the undulator a beam with limited energy bandwidth. Here, the photon flux is about to be 50–100 times higher when compared to monochromatic beam. A band-pass filter consisting of a combination of x-ray filters as high-pass and an x-ray mirror operating near the critical angle as low-pass filter are used. In this case the filters were a set of 0.2 mm pyrolitic carbon and 0.2 mm aluminium filters and for the mirror a platinum-coated strip under an incident angle of 1.15 mrad was used. The experimental setup is located at about 220 m from the source. It consists of a sample stage and a detector, placed on a granite table. A sketch for the experiment is shown in figure 1. The transmitted intensity is recorded with a fast detector system. The detector consists of a scintillation screen transforming the x-rays into visible light, and a visible light microscope optic, projecting the image of the screen onto the chip of a CMOS camera.
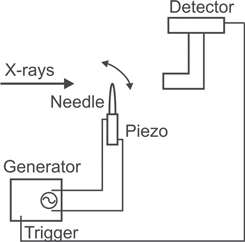
Figure 1. Sketch of the experimental setup, which was used for stroboscopic imaging at the Diamond Light Source beamline I13.
Download figure:
Standard image High-resolution imageFor the experiments a 170 μm thick Gadolinium Gallium Garnet screen containing a 45 μm Cerium doped top-layer (GGG:Ce) in combination with a 2x objective lens with a numerical aperture of 0.08 and a 2x tube lens were used. The detector is PCO Dimax CMOS camera with 11 × 11 μm pixels. This combination provides an effective pixel size of 2.75 μm and a spatial resolution not better than 6 μm.
The PCO DiMax, has the capability to read out a 2016 × 2016 pixels array with a rate of up to 1279 frames per second. The dark current is 530 e− per pixel and per second, the readout noise of 23 e−, and the fullwell capacity is 36 000 e−. Converting 8.8 e− per count, the dynamic range of the camera is 12 bit.
Dynamic measurements with needle
The test sample was a parabolic-shaped metal needle with a base diameter of 300 μm. This needle was driven by a piezo, deflecting in the horizontal plane. A wave generator (HP33120A) controlled the needle oscillation and the triggering of the camera. The camera trigger signal can be delayed, so that different needle positions are probed over the whole cycle. For each position several images are added up on the camera's memory.
For the experiments the frequency was 400 Hz, the output voltage was modified from 20 V to 0.1 V for the different the data sets. For each voltage, ten different positions were recorded. The exposure time for each single image was 250 μs and was integrated over 256 cycles. The total exposure time for each position was therefore 64 ms.
All images were flat-field corrected using images with sample (projection), without sample (flat-field), and no beam (dark-field).
Displacements of the needle were computed by using the intensity modulation in a 5 × 5 pixel neighborhood (for an overview see [44, 45, 46]). The following steps are included in the computation of the flow field (spatio-temporal patterns of image intensity): (1) spatial prefiltering of the stack of captured images with a low-pass or band-pass filter in order to extract the signal structure of interest and to enhance the signal to noise ratio. (2) Extraction of the basic measurements, such as spatio-temporal derivatives, and the integration of these measurements to produce a two-dimensional flow field. Computations were conducted with an ImageJ plugin FlowJ, which provided a frame-by-frame velocity.
Displacement was determined by the subtraction of two images at extreme position. This method is referred to in the following as the 'direct method'.
Cochlear sample imaging
Care and use of animals was conducted in accordance with guidelines in the NIH Guide for the Care and Use of Laboratory Animals. Animal procedures were approved by the Animal Care and Use Committee of Northwestern University.
A setup similar to the one described above was used at the APS, Argonne, IL to image cochlear structures. Instead of a piezo-driven setup with a frequency generator, the camera was controlled by its own software. A detailed description of the experiment at the APS is given in Rau et al [33].
To image cochlear tissue, adult gerbils were euthanized by a lethal intraperitoneal injection of sodium pentobarbital (180 mg kg−1 body weight). Bullae were harvested immediately and removing most of the bony wall of the bulla exposed the cochlea. Care was taken to maintain the middle ear, to keep the stapes in place, and the round window membrane intact. Before mounting the sample, a small access hole was created in the basal turn and a 200 μm plastic tube was secured with dental acrylic into scala tympani. A second hole was created in the apex of the cochlea to allow continuous perfusion of the scala tympani with artificial perilymph (in mM: 100 lactobionic acid, 10 hydroxyethyl piperazineethanesulfonic acid HEPES, 81 NaOH, 24 NaHCO3, 45 NaCl, 5 KCl). The solution was adjusted to pH 7.45 and 305 mosmol. The flow rate was set by a syringe pump (Sage Instruments, Division of Onion Research Incorporated, Cambridge, MA) at a rate of 0–20 μl min−1. Changing the flow rate resulted in the displacement of the basilar membrane. By comparing the images that were captured at two different flow rates, displacements of soft tissue structures could be determined in the experiments.
Results
Dynamic measurements
The results for the dynamic measurements with the metal needle are shown in the following. Figure 2 is a graphical representation using FlowJ for the needle measurements. From (a) to (h) the voltage increased from 0.1 to 20 V. The green lines represent the differences between the maxima positions of the needle. The width of the displacement as judged from the width of the green line increased linearly with increasing driving voltage to the piezo (figure 3). For higher voltages, the displacement can be measured directly. This becomes more and more difficult for small deflections (figure 2).
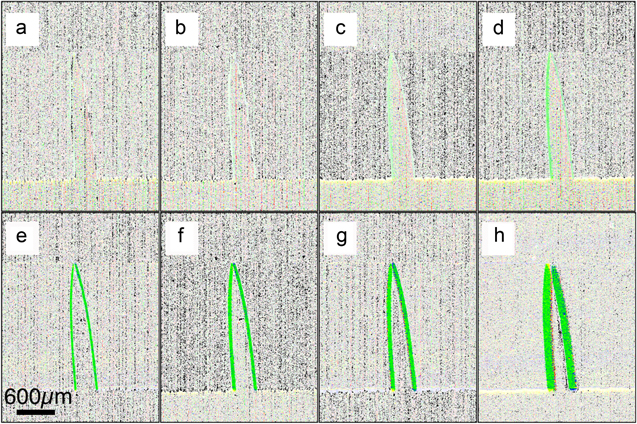
Figure 2. Difference image of the needle position at maxima, recorded at 400 Hz and 250 μs exposure time. The driving voltage to the piezo, which is holding the needle, increases from (a) to (h), 0.1 to 20 V respectively. The width of the green line corresponds to the amplitude of the horizontal needle displacement.
Download figure:
Standard image High-resolution image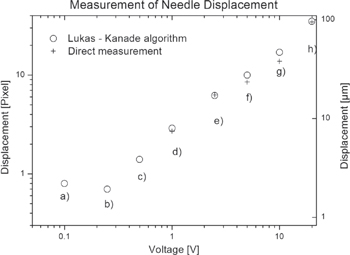
Figure 3. Result of stroboscopic imaging at 400 Hz with a needle test sample, using direct measurement (+) and the Lucas and Kanade algorithm (O).
Download figure:
Standard image High-resolution imageIn addition to the graphical presentation, FlowJ provided a numerical value for the displacement. The algorithm is expected to provide accurate results in particular for small displacements. In figure 3, values for the graphical and numerical outcomes were compared. At high voltages the results between direct measurement and the Lucas and Kanade algorithm (LKA) coincide well. Data are plotted on a double logarithmic scale. For both analyses methods, the needle displacement appears to grow linearly with increasing voltage. At 1 V the displacement of the needle is about 8 μm. This value is close to the current resolution of the detector system. For voltages less than one volt the needle displacement cannot be detected directly but still with the LKA. The curve deviates from linearity for the lowest voltages and the minimum detectable displacement is expected to be about 2 μm, about four times lower compared to a direct measurement.
Displacements of cochlear structures
The results obtained from the perfusion of the cochlea with artificial perilymph at constant flow rates are shown in figure 4. Again, the data was analysed with both methods, image subtraction and the LKA. In this case the potential of the LKA is quite limited, because only two data points have been used. The analysis is useful to acquire comparative information.

Figure 4. (a) X-ray image of a closed calcified gerbil cochlea including the soft tissue. (b) Difference of images taken at different flow rates of the artificial perilymph. Flow rates were 0 and ∼20 μl s−1. (c) Same data from (b) analysed with the LKA.
Download figure:
Standard image High-resolution image
In the static image, the location of soft tissue is almost undetectable (figure 4(a)). The background from the bony structure of the cochlea walls provide much structure in the image, therefore the horizontal lines corresponding to the soft tissue are very difficult to identify. When subtracting two consecutive images from each other the location of the displaced soft tissue is easily revealed. For flow rates of 0 and ∼20 μl min−1. The displacement is about 5 μm at the tectorial membrane and the reticular lamina and ∼10 μm at Reissner's membrane.
With the help of the direct method, areas of interest are identified for the analyses with the LKA. Results show some interesting tendencies. The small line in the centre of the image is blue, signifying an upwards movement of the structure, while the broader line above undergoes a downwards movement, indicated by its yellow colour. The very broad line at the top of the image likely results from the movement of Reissner's membrane and seems to be dominated by a downward movement (yellow colour).
Discussion
First, we compared the capabilities of detecting small displacements using a direct method and the LKA. We found that the minimal detectable displacement is about 8 μm for the direct method. For the LKA this value is about 1.5 μm, which is about four times less than the detector resolution. When applying this method to visible light microscopy the detection limit for LKA is in theory a hundred times and in practice ten times less than the spatial resolution of the detector. The difference between x-ray and visible light results may be related to the fact that other parameters play a significant role. Eventually, beam stability may be a dominant factor and is constantly improved throughout the commissioning phase of the beamline. The signal-to-noise ratio can be improved when recording the data by integrating the single images of each data point on the chip of a CCD-based camera. The x-ray detector system can provide micrometer resolution, similar to a visible light microscope. At present, we address all factors to bring the method to sub-100 nm detection sensibility.
The present setup is limited to the detection of micrometer displacements. This amount of movement in cochlear soft tissue corresponds to an extreme stimulus and is likely close or beyond destructive levels. For a gerbil, typically the basilar membrane deflection at threshold for hearing is about 1 nm [47]. While no data are available for the gerbil cochlear apex, in guinea pigs, for example, the vibration amplitude of the organ of Corti at the outer hair cells is approximately 700 nm at 96 dB SPL sound level and stimulation frequencies between 98 and 400 Hz (for example Khanna and Ho, [48, 49]). In cochleae of deaf animals and in the apex of the cochlea typically larger vibration amplitudes are expected. The low frequency response of the membrane occurs in the apex, while the high frequency is signal appears in the area as shown in figure 4.
For the first time we identified soft tissue in a calcified cochlea by its displacement. This is a significant achievement, because the structures of interest are usually hidden in the background of other signals, mainly the bony walls of the cochlea. The results are indicative with only two measurement points recorded. Applying a (periodic) sound signal to the closed cochlea enables sufficient data points to apply the LKA.
The current results show that it is possible to analyse soft tissue displacement in an intact calcified cochlea with high-level stimulation. Small cochlea soft tissue displacements are detectable with an optimised experiment and high resolution optics. Under these conditions cochlear micromechanics can be studied at audio frequencies. The sensitivity will further increase with the progress made in the experimental setup.
Summary
A stroboscopic study with coherent hard x-rays has been carried out at audio frequencies, here 400 Hz. It has been shown on a test object that minimal displacements, four times smaller than the spatial resolution of the detector, can be resolved, using the LKA algorithm. The vibration amplitudes were quantified for different excitation amplitudes and agree with the directly measured results.
In an intact, calcified gerbil temporal bone, displacements of the reticular lamina, tectorial membrane and Reissner's membrane were determined using the same algorithm for qualitative analyses. The present work is key for future imaging of cochlear micromechanics.
Acknowledgments
We acknowledge Diamond Light Source for time on the Diamond-Manchester Branchline at the I13 Imaging and Coherence beamline under proposal number MT-8432. Lixin Fan is acknowledged for the initial contributions in data analyses, especially using the LKA. CPR has been supported by a grant from the NSF (IBN-0415901) and the Hugh Knowles Foundation. Use of the APS at Argonne National Laboratory was supported by the United States Department of Energy, Office of Science, Office of Basic Energy Sciences, under Contract No. DE-AC02-06CH11357. The funders had no role in study design, data collection and analysis, decision to publish, or preparation of the manuscript.